. 2023 Jun 19;58(12):1071-1086.e8.
doi: 10.1016/j.devcel.2023.04.010. Epub 2023 May 5.

Immune mechanisms shape the clonal landscape during early progression of prostate cancer

Affiliations

Immune mechanisms shape the clonal landscape during early progression of prostate cancer

Lara F Tshering et al. Dev Cell. .

Abstract

Understanding the role of the immune microenvironment in modulating intratumor heterogeneity is essential for effective cancer therapies. Using multicolor lineage tracing in genetically engineered mouse models and single-cell transcriptomics, we show that slowly progressing tumors contain a multiclonal landscape of relatively homogeneous subpopulations within a well-organized tumor microenvironment. In more advanced and aggressive tumors, however, the multiclonal landscape develops into competing dominant and minor clones accompanied by a disordered microenvironment. We demonstrate that this dominant/minor landscape is associated with differential immunoediting, in which minor clones are marked by an increased expression of IFNγ-response genes and the T cell-activating chemokines Cxcl9 and Cxcl11. Furthermore, immunomodulation of the IFNγ pathway can rescue minor clones from elimination. Notably, the immune-specific gene signature of minor clones exhibits a prognostic value for biochemical recurrence-free survival in human prostate cancer. These findings suggest new immunotherapy approaches for modulating clonal fitness and tumor progression in prostate cancer.

Keywords: clonal competition; immunoediting; prostate cancer; single-cell transcriptomics.


Conflict of interest statement

Declaration of interests The authors declare no competing interests.

Figures
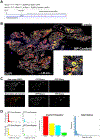
Figure 1.
Figure 1.. Analysis of clonal patterns in mouse models of prostate cancer.
(A) Time course of lineage-tracing experiments with the Confetti reporter. (B-D) Workflow of clonal quantification by automated image processing. (B) Representative image of clonal distribution in NP-Confetti tumors at 5 weeks post-TAM, showing a 20x scan of an entire section of an anterior prostate (AP) lobe, with an individual tile in inset. (C) The image in B was processed through a MatLab script. The background subtraction and binarization steps are shown. (D) Clonal quantification of the processed image, showing number of cells/individual clones for each channel (left), total number of clones/each channel/entire section (middle), and distribution of cells/clone for the entire section (right). Additional examples are provided in Figure S1D- S1J.
Figure 2.
Figure 2.. An aggressive PCa model displays rapid progression to clonal dominance.
(A-F) Confetti lineage-tracing at the indicated time points post-TAM in NP mice. (G) Representative H&E staining of NP tumors at 5 weeks post-TAM showing features of low-grade PIN. (H-M) Confetti lineage-tracing at the indicated time points post-TAM in NPK mice. Asterisk in J denotes areas of cell death. (N) Representative H&E staining of NPK tumors at 5 weeks post-TAM showing features of high-grade PIN. Note the similarly sized larger clones in NP tumors vs the rapid emergence of a dominant/minor landscape in NPK tumors at early time points. GFP was under-represented as previously reported ,. Scale bar represents 100 μm. See Figure S3A- S3C. (O) Heatmap representation of clonal size distribution comparing densities of clones of various sizes at the indicated time points post-TAM in NP and NPK tumors. Both tumor types show an increasing number of disproportionately large clones, albeit with different kinetics. For NP: 4-5 mice per time point, 5-7 tile scans of entire sections/mouse, 90,000 clonal events across all time points were included. For NPK: 3-6 mice/per time point, tile scans of entire sections/mouse, 180,000 clonal events across all time points were included. Frequency is computed as the proportion of clones in a given size interval among all clones collected for a certain time point. A clone was defined as a contiguous fluorescent patch, including clones of 1 cell. The NPK tumors have a larger proportion of clones of 1 at later time points due to local spread. See Figure S3D. (P) Index of dispersion (Fano factor) of clonal size. The same clonal events as in O were included and reported per mouse. For each mouse, clone sizes were aggregated from all sections imaged. The index of dispersion is calculated as the ratio of the variance to the mean. Mean value and variance of clone sizes were calculated for each mouse. (Q) Lorenz curves of cumulative percentage of all labeled cells versus cumulative percentage of clonal sizes. Dashed line represents the line of equality. Individual members within a population (unique Confetti+ clones ≥ 20 cells) were ranked in order of abundance. (R) Circle plot representation of clonal size distribution for NP and NPK at 4 and 12 week time points. The threshold for Dominant, Minor, and Medium size clones were extracted from the Lorenz curve ranking for each section and averaged per time point (Dominant at 75% including top 25% clones by size, Minor at 25% including bottom 25% of clones, and the Medium as sizes in between). Circles representing clones were plotted randomly on a 2D plot. All clones ≥ 20 cells/clone were included. Note the increase in dominant representation in the NPK vs NP, but also the progression of NP towards a more D/M type by 12 weeks. (S) Representation of the Gini Coefficient for all time points. If all individual clones are of equal abundance, the Lorenz curve follows the line of equality, and the Gini index is zero. The more unequal the distribution of abundances, the larger the Gini index (=1). See Figures S3E - S3H and Table S2. (T) Clone counts per section normalized to the number of nuclei/section were averaged per mouse, per time point. Both mouse models show an overall decrease from the initial clonal density, with a faster drop in the NPK model.
Figure 3.
Figure 3.. Clonal features in NP and NPK tumors.
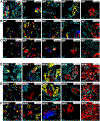
(A-F) Assessment of cell types and proliferation in NP and NPK clones. Luminal (CK8) and basal (CK5) marker expression in NP (A, B) and NPK (D, E) clones at the indicated time points. (C, F) Assessment of proliferating cells/clone determined by Ki67 immunostaining in NP (C) and NPK (F) clones. Note that most clones are sustained by a reduced number of Ki67+ cells/clone. Arrows: Ki67+ cells in clones. Asterisk: Ki67+ cells in TME. Scale bar represents 100 μm. At least 3 mice/time point were included in these analyses. See Figures S4A- S4E.
Figure 4.
Figure 4.. Remodeling of the tissue microenvironment accompanies initial clonal expansion in NP and NPK tumors.
(A-H) Immunostaining with the indicated markers at the indicated time points post-TAM in NP (A-D) and NPK (E-H) tumors, showing increase in CK5+ cells surrounding and penetrating the clones (A, E), increase in stromal (SMA+) cells (B, F) and neurites (SYN+) (C, G), as well as increased Iba1+ myeloid cell infiltrate (D, H). In contrast to NP tumors, in NPK tumors the CK5+ layer is disrupted by clonal growth by 6 weeks (E) and the stromal and neurite response is more disorganized (F, G). All images are 40x 4x4 tile scans; scale bar represents 100 μm. Serial sections were stained. See Figures S4F- S4I.
Figure 5.
Figure 5.. scRNAseq analysis of dominant and minor clones reveals distinct immunoediting profiles.
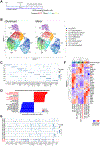
(A) Schematic of experimental design. (B) Cell type cluster distribution of Dominant and Minor samples by UMAP (Seurat) identifying 9 separate clusters in both samples. (C) Dot plot of the top 5 genes/cluster. (D) Top activated and repressed pathways in Minor vs Dominant samples by GSEA analysis. Note that the top activated pathways belong to the immune category. (E) Dot plot of gene expression levels of IFNγ-responsive genes. For each cluster, D and M levels are shown in comparison. Most of these genes are overexpressed by Minor cells. (F) Regulon analysis by SCENIC further implicates Irf1 and Irf8 as master regulators of the most immunoedited/immunogenic clusters. See Figures S5A- S5H and Tables S3 and S4.
Figure 6.
Figure 6.. A gene signature of minor clones exhibits prognostic value for time to biochemical recurrence in human prostate cancer.
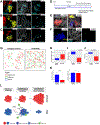
(A) Violin plots of the indicated genes in each cluster. Cxcl9, Cxcl11, and members of the MHC class II were differentially expressed and enriched across multiple clusters in the Minor vs Dominant samples. (B) Heatmap of proportion of cells expressing MHC class I, II and other relevant antigen presentation regulatory genes in Dominant vs Minor samples. (C) A signature of top differentially expressed genes of the “C8_Immunoedited” Minor cluster (ImmunoUp) has predictive value on the MSKCC Taylor data set (p = 0.0086) for BCR-free time. (D) Patients with high expression of the ImmunoUp signature show increased time to biochemical relapse (p = 0.017) in a TCGA-PRAD cohort that includes PCa patients with reported BCR status . See Figures S5I-S5M and Table S5.
Figure 7.
Figure 7.. In vivo immunomodulatory interventions alter clonal landscapes.
(A-C) Immunofluorescence analysis of Cxcl9 (A) and T cell markers (B, C) at clonal level. Note the differential Cxcl9 expression and T cell infiltration in distinct clonal “niches.” See Figure S6. (D) Schematic of IFNγ blockade experiments. (E-K) IFNγ blockade on NPK tumors equilibrated the clonal size distribution with more surviving clones of smaller size scattered along the landscape (E, right) compared to anti-isotype control injections (E, left) and reduced clonal Cxcl9 expression (F). (G) Circle plots of Confetti+ clones from control and anti-IFNγ treated mice showing that a reduced number of large, dominant clones is produced upon IFNγ blockade. Thresholds of clonal categories were based on Lorenz curves quantiles. All clones ≥ 20 cells/clone were included. 17 tile scans of entire AP lobes were included for IFNγ blockade (n=6 mice) and 8 tile scans for the isotype control group (n=3 mice). (H-K) IFNγ blockade on the NPK tumors modified the clonal landscape leading to more clones/section (H) that were more equally distributed in size (I, J) and had a reduced number of Ki67+ cells/clone (K, left). At the same time, a similar proportion of fluorescent patches show positive Ki67 staining (K, right). Ki67 immunofluorescence was performed on FFPE NPK-Confetti slides. Clones were identified with an anti-GFP antibody that recognizes all Confetti fluorochromes. Histologically separated, continuous fluorescent patches corresponded to individual clones. n = 2 mice/group and at least 3 4x4 tile scans/mouse were included. See Figure S7. (L) Model of immune effects on clonal selection. Figure created with Biorender.com.

References

    1. Black JRM, and McGranahan N (2021). Genetic and non-genetic clonal diversity in cancer evolution. Nat Rev Cancer 21, 379–392. 10.1038/s41568-021-00336-2. - DOI - PubMed
    1. Greaves M, and Maley CC (2012). Clonal evolution in cancer. Nature 481, 306–313. 10.1038/nature10762. - DOI - PMC - PubMed
    1. McGranahan N, and Swanton C (2017). Clonal Heterogeneity and Tumor Evolution: Past, Present, and the Future. Cell 168, 613–628. 10.1016/j.cell.2017.01.018. - DOI - PubMed
    1. Haffner MC, Zwart W, Roudier MP, True LD, Nelson WG, Epstein JI, De Marzo AM, Nelson PS, and Yegnasubramanian S (2021). Genomic and phenotypic heterogeneity in prostate cancer. Nat Rev Urol 18, 79–92. 10.1038/s41585-020-00400-w. - DOI - PMC - PubMed
    1. Clark J, Attard G, Jhavar S, Flohr P, Reid A, De-Bono J, Eeles R, Scardino P, Cuzick J, Fisher G, et al. (2008). Complex patterns of ETS gene alteration arise during cancer development in the human prostate. Oncogene 27, 1993–2003. 10.1038/sj.onc.1210843. - DOI - PubMed

Publication types