. 2023 Jun 19;58(12):1106-1121.e7.
doi: 10.1016/j.devcel.2023.04.012. Epub 2023 May 5.

A platform for efficient establishment and drug-response profiling of high-grade serous ovarian cancer organoids

Affiliations

A platform for efficient establishment and drug-response profiling of high-grade serous ovarian cancer organoids

Wojciech Senkowski et al. Dev Cell. .

Abstract

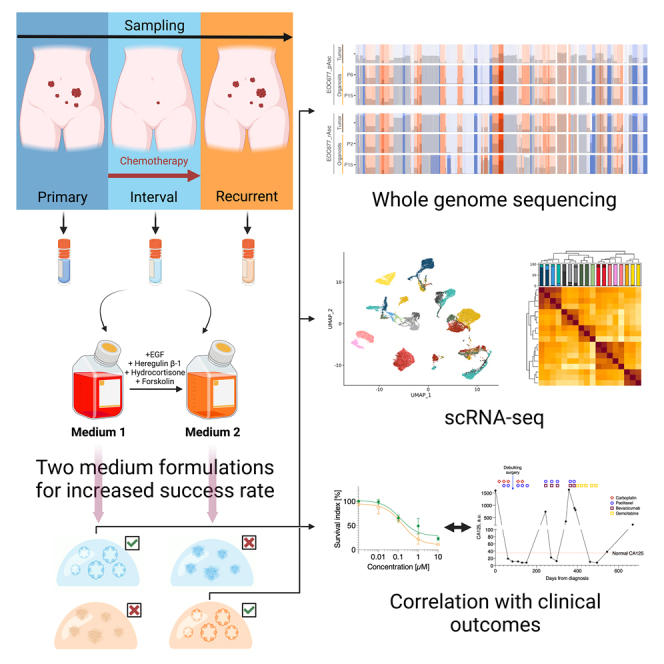
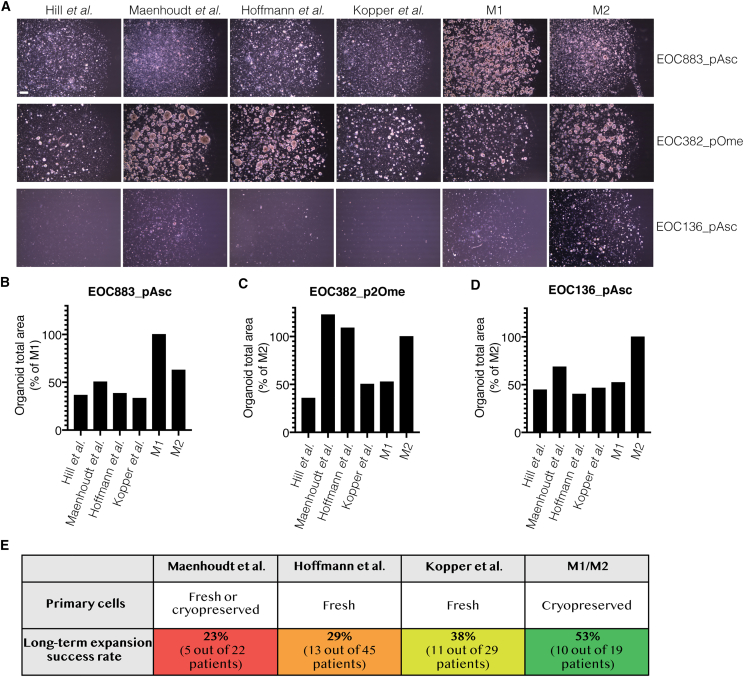
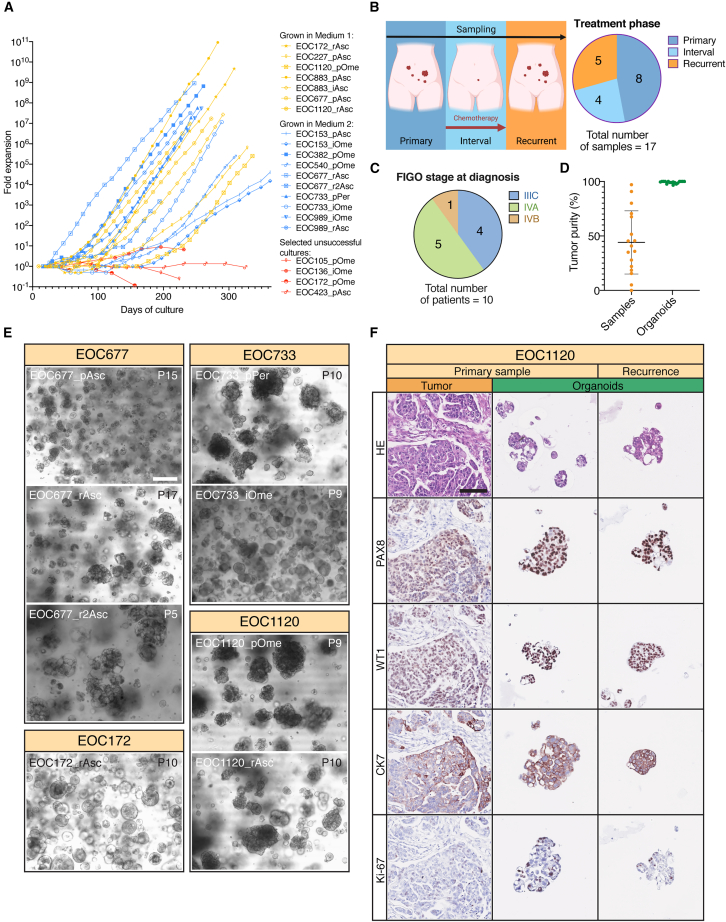
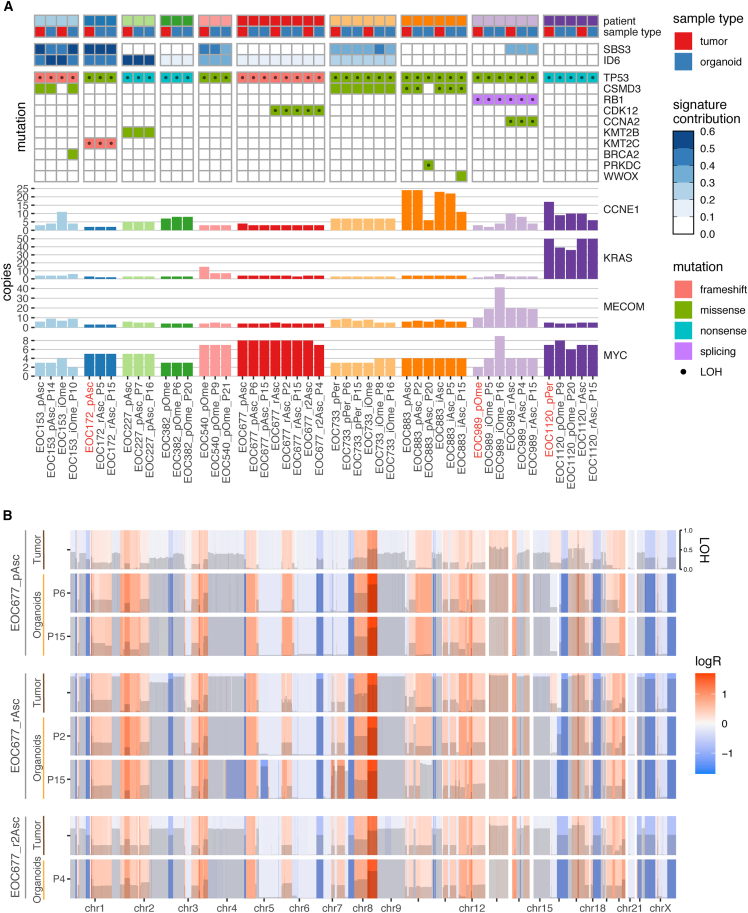
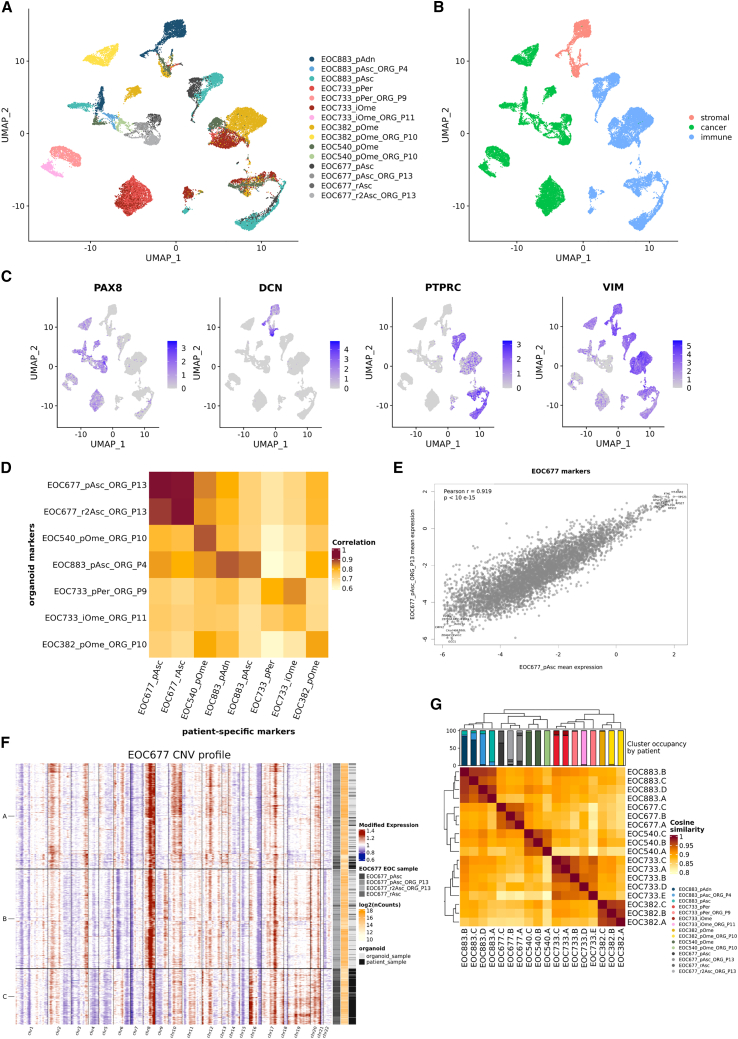
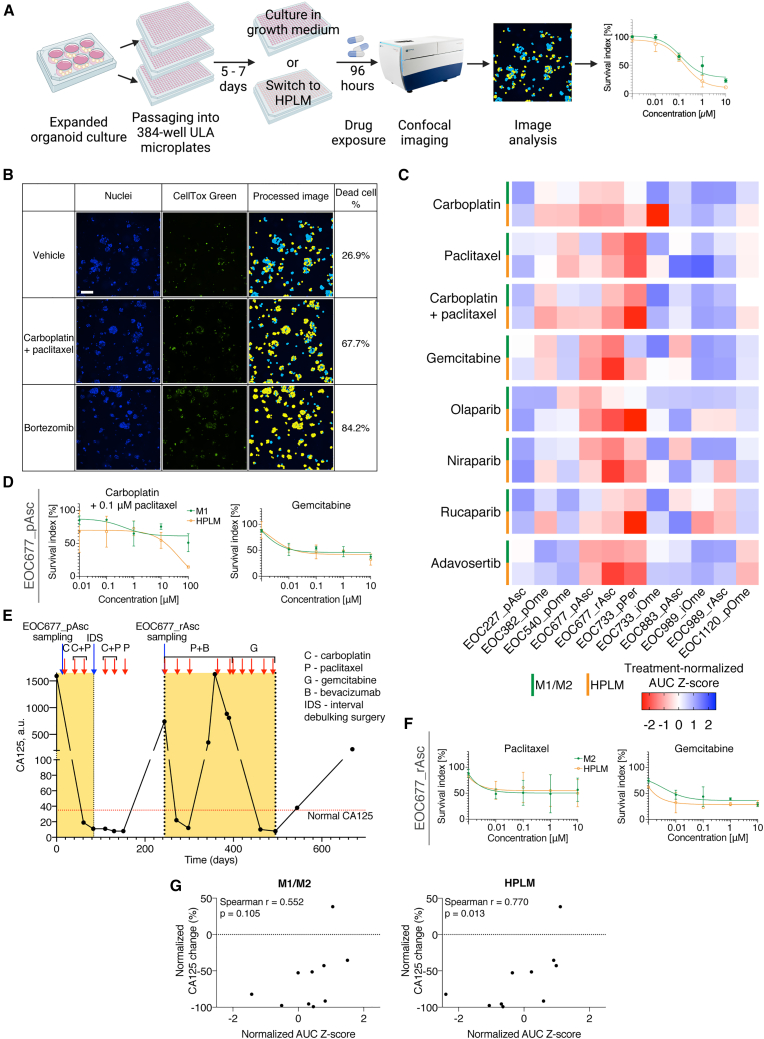
The broad research use of organoids from high-grade serous ovarian cancer (HGSC) has been hampered by low culture success rates and limited availability of fresh tumor material. Here, we describe a method for generation and long-term expansion of HGSC organoids with efficacy markedly improved over previous reports (53% vs. 23%-38%). We established organoids from cryopreserved material, demonstrating the feasibility of using viably biobanked tissue for HGSC organoid derivation. Genomic, histologic, and single-cell transcriptomic analyses revealed that organoids recapitulated genetic and phenotypic features of original tumors. Organoid drug responses correlated with clinical treatment outcomes, although in a culture conditions-dependent manner and only in organoids maintained in human plasma-like medium (HPLM). Organoids from consenting patients are available to the research community through a public biobank and organoid genomic data are explorable through an interactive online tool. Taken together, this resource facilitates the application of HGSC organoids in basic and translational ovarian cancer research.

Keywords: 3D cell culture, culture conditions; HPLM; functional precision medicine; high-grade serous ovarian cancer; organoid biobank; organoids; personalized medicine; scRNA-seq; tumor models.


Conflict of interest statement

Declaration of interests The authors declare no competing interests.

Figures

None
Graphical abstract
Figure 1
Figure 1
Establishment of HGSC organoid media formulations (A) Summary of the medium composition establishment process. (B) Left: phase-contrast images of basement membrane extract (BME) droplets with objects (outlined in yellow) identified with CellProfiler. EOC883_pAsc cells were cultured in M0.1 or M0.1 supplemented with FGF-4 (10 ng/mL) for 38 days (passaged once on day 17). Scale bars, 200 μm. Right: total area of objects and mean (marked with a line) object radius in the particular picture, estimated using CellProfiler. (C) Left: phase-contrast images of BME droplets with objects identified as above. EOC883_pAsc cells were cultured in M0.2 or M0.2 supplemented with β-estradiol (100 nM) for 39 days (passaged once on day 20). Scale bars, 200 μm. Right: total object area and mean object radius in the particular picture, as above. (D) Top and bottom-left: phase-contrast images of BME droplets with objects identified as above. EOC883_pAsc cells were cultured in M0.3 or M0.3 supplemented with nicotinamide (NAM, 5 mM) or EGF (5 ng/mL) for 38 days (passaged once on day 19). Scale bars, 200 μm. Bottom-right: mean object radius in the particular picture, as above. (E) Overview of particular HGSC organoid media formulations. n, number of analyzed objects p < 0.05; ∗∗∗ p < 0.001; ∗∗∗∗ p < 0.0001, unpaired two-tailed Mann-Whitney test. See also Figures S1 and S2 and Tables S1 and S2.
Figure 2
Figure 2
The M1/M2 method provides greater success rate of HGSC organoid culture than previously published protocols (A) Phase-contrast images of EOC883_pAsc, EOC382_pOme and EOC136_pAsc cultures in previously published HGSC organoid media or M1/M2. EOC883_pAsc, EOC382_pOme or EOC136_pAsc cells were cultured for 36 days (passaged once on day 20), 31 days (passaged once on day 17) or 51 days (passaged once on day 29), respectively. Scale bar, 200 μm. (B–D) Total area of objects identified with CellProfiler in images presented in (A), for EOC883_pAsc (B), EOC382_pOme (C) and EOC136_pAsc (D). (E) Comparison of HGSC organoid culture establishment success rates reported previously (for source of the data in relevant publications, see Table S3) to the success rate of M1/M2 organoid culture. See also Table S3.
Figure 3
Figure 3
Overview of the HGSC organoid collection (A) Growth curves of successful organoid cultures in M1 (n = 7), M2 (n = 10) and selected unsuccessful cultures (n = 4). (B and C) Categorization of established HGSC organoid cultures according to the clinical course phase at sampling (B) and FIGO stage at diagnosis (C). (D) Tumor purity of tumor samples and corresponding organoid cultures presented as mean ± SD. (E) Bright-field images of selected organoid cultures depicting various organoid morphologies. Passage numbers (P) indicated in top-right corners. Scale bar, 100 μm. (F) HE and IHC staining of EOC1120_pOme tumor tissue, organoids derived from it and organoids derived from relapsed tumor (EOC1120_rAsc). Organoids demonstrate morphological features similar to the original tissue, including nuclear pleomorphism, adenopapillary growth pattern, and positive staining for PAX8, WT1, and CK7. They are also more proliferative than the original tissue, depicted by higher Ki-67 expression. Scale bar, 100 μm. See also Figure S3.
Figure 4
Figure 4
HGSC organoids cultured with M1/M2 recapitulate genomic landscapes of original tumor tissues over long-term culture (A) Chart displaying somatic mutations and amplifications of selected, HGSC-relevant genes and contribution of HRD-associated mutational signatures (ID6, SBS3) in patient tumor tissue and corresponding organoid cultures. Passage numbers (P) at sequencing are indicated for organoid cultures. Sample names are typed in orange, where tumor tissue from a different metastatic location/clinical progression stage than the one used for organoid derivation is presented (due to limited matching tissue availability for sequencing). LOH, loss of heterozygosity. (B) Genome-wide CNV analysis of tumor tissue and corresponding organoids from patient EOC677, derived from material sampled at diagnosis, first and second recurrence. Copy-number changes are expressed as logR and color-coded. The extent of LOH is displayed with gray bars. Passage numbers (P) at sequencing are indicated for organoid cultures. See also Figure S4.
Figure 5
Figure 5
HGSC organoids preserve transcriptomic features of original tumors (A) UMAP visualization of 30,492 cells from 7 organoid cultures and their tissue controls (with addition of EOC883_pAdn tumor sample) with color-coded assignment to particular sample. (B) The same UMAP visualization with color-coded assignment to particular cell type (tumor, stromal, or immune). (C) Single-cell expression of PAX8, DCN, PTPRC, or VIM visualized in the same UMAP plot. (D) Heatmap displaying overall correlation scores between the patient-specific marker expression derived from organoids vs. the original patient material. (E) Pearson correlation plot of patient-specific markers expression in EOC677_pAsc tumor sample and corresponding organoids. (F) Single-cell CNV plots from EOC667_pAsc and EOC667_r2Asc organoids and EOC667_pAsc and EOC677_rAsc tumor samples, inferred using InferCNV and classified into 3 subclusters. All analyzed samples are represented in each of the subclusters. (G) Heatmap displaying cosine distances between all subclusters in all samples, demonstrating patient-specific clustering of organoids and matching tissue samples. ee also Figure S5.
Figure 6
Figure 6
Correlation of HGSC organoid drug responses to clinical outcomes is culture medium dependent (A) Overview of the drug-response profiling assay. (B) Image-based cytotoxicity assay. After drug exposure, cells’ nuclei in organoids are stained with Hoechst 33342 (blue, Nuclei) and dead cells are stained with CellTox Green (green). Organoids are imaged using automated confocal fluorescence microscopy, dead cell percentage is estimated using image analysis and normalized to negative (vehicle) and positive (bortezomib) control values. Scale bar, 100 μm. (C) Heatmap displaying treatment-normalized AUC Z score values, showing responses of particular organoid cultures in growth medium (M1/M2) or HPLM to a panel of HGSC-relevant drugs. (D) Dose-response curves of EOC677_pAsc organoids treated with carboplatin + 0.1 μM paclitaxel or gemcitabine, in M1 or HPLM. Results are shown as mean of 2 biological replicates (each with 2–3 technical replicates) ± SD. (E) CA125 blood levels of patient EOC677 over time. Periods relevant for comparisons with in vitro drug response indicated with yellow rectangles. Normal CA125 range (<35 a.u.) indicated with a red dotted line. (F) Dose-response curves of EOC677_rAsc organoids treated with paclitaxel or gemcitabine, in M2 or HPLM. Results are shown as mean of 2 biological replicates (each with 2–3 technical replicates) ± SD. (G) Spearman correlation plots between normalized AUC Z score for carboplatin + 0.1 μM paclitaxel combination in organoids and normalized change (expressed as % of maximal patient-specific CA125 level in the relevant period) of blood CA125 in corresponding patients after carboplatin + paclitaxel chemotherapeutic treatment. Number of samples = 10. See also Figure S6.

References

    1. Bowtell D.D., Böhm S., Ahmed A.A., Aspuria P.J., Bast R.C., Beral V., Berek J.S., Birrer M.J., Blagden S., Bookman M.A., et al. Rethinking ovarian cancer II: reducing mortality from high-grade serous ovarian cancer. Nat. Rev. Cancer. 2015;15:668–679. doi: 10.1038/nrc4019. - DOI - PMC - PubMed
    1. Cancer Genome Atlas Research Network Integrated genomic analyses of ovarian carcinoma. Nature. 2011;474:609–615. doi: 10.1038/nature10166. - DOI - PMC - PubMed
    1. Ciriello G., Miller M.L., Aksoy B.A., Senbabaoglu Y., Schultz N., Sander C. Emerging landscape of oncogenic signatures across human cancers. Nat. Genet. 2013;45:1127–1133. doi: 10.1038/ng.2762. - DOI - PMC - PubMed
    1. Poveda A., Floquet A., Ledermann J.A., Asher R., Penson R.T., Oza A.M., Korach J., Huzarski T., Pignata S., Friedlander M., et al. Olaparib tablets as maintenance therapy in patients with platinum-sensitive relapsed ovarian cancer and a BRCA1/2 mutation (SOLO2/ENGOT-Ov21): a final analysis of a double-blind, randomised, placebo-controlled, phase 3 trial. Lancet Oncol. 2021;22:620–631. doi: 10.1016/S1470-2045(21)00073-5. - DOI - PubMed
    1. Macintyre G., Goranova T.E., De Silva D., Ennis D., Piskorz A.M., Eldridge M., Sie D., Lewsley L.A., Hanif A., Wilson C., et al. Copy number signatures and mutational processes in ovarian carcinoma. Nat. Genet. 2018;50:1262–1270. doi: 10.1038/s41588-018-0179-8. - DOI - PMC - PubMed

Publication types