. 2023 May 6;23(1):409.
doi: 10.1186/s12885-023-10899-y.

Model-based assessment of combination therapies - ranking of radiosensitizing agents in oncology

Affiliations

Model-based assessment of combination therapies - ranking of radiosensitizing agents in oncology

Marcus Baaz et al. BMC Cancer. .

Abstract

Background: To increase the chances of finding efficacious anticancer drugs, improve development times and reduce costs, it is of interest to rank test compounds based on their potential for human use as early as possible in the drug development process. In this paper, we present a method for ranking radiosensitizers using preclinical data.

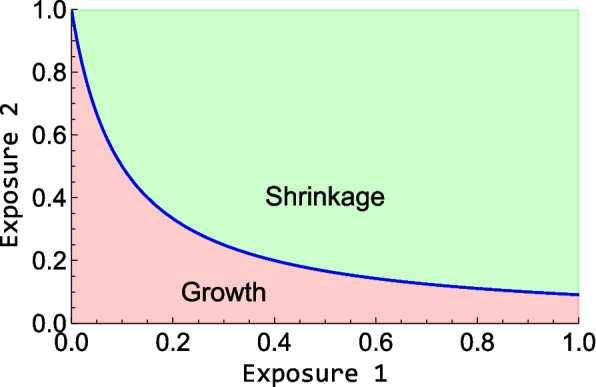
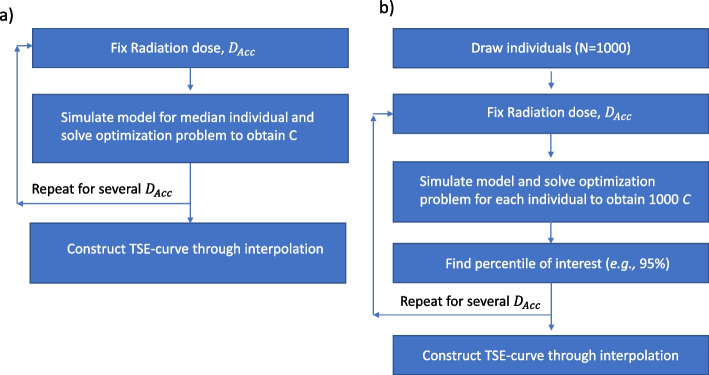
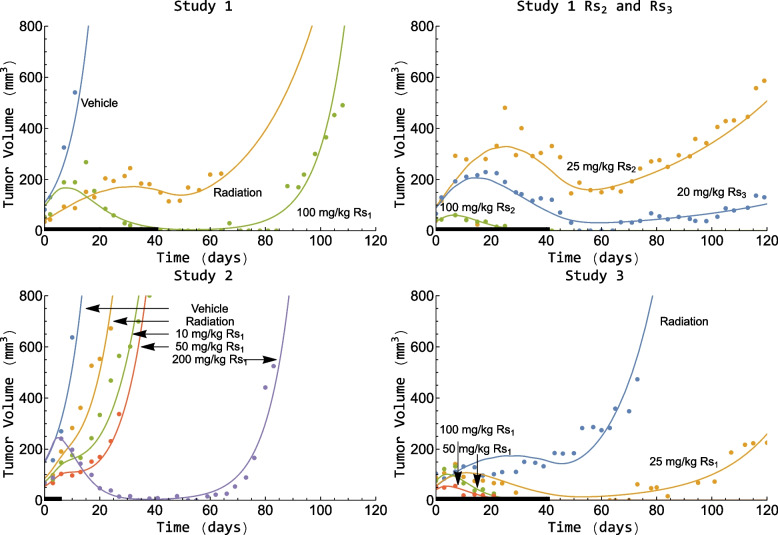
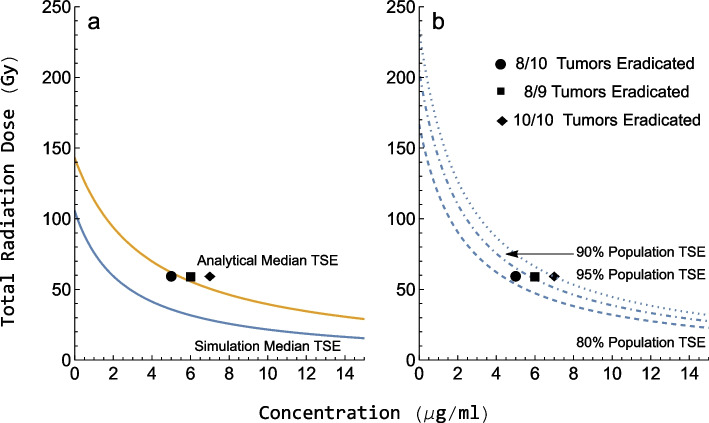
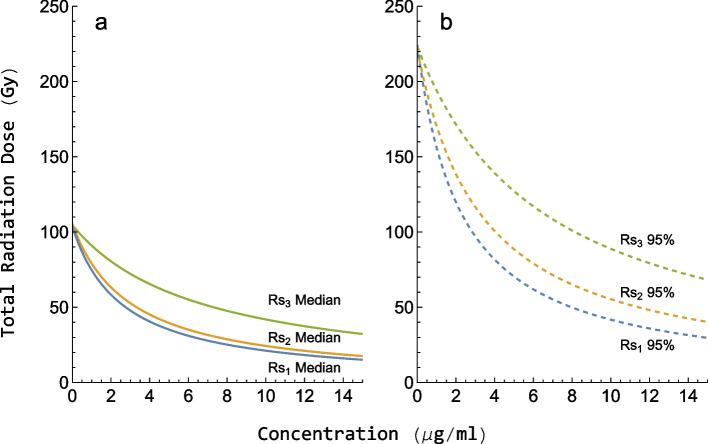
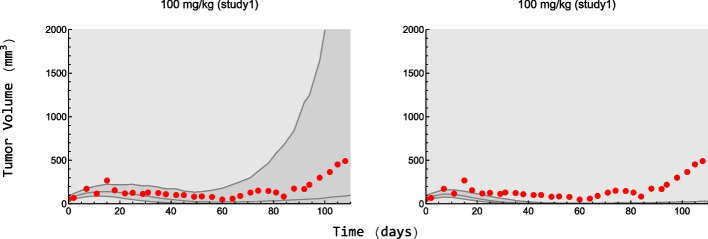
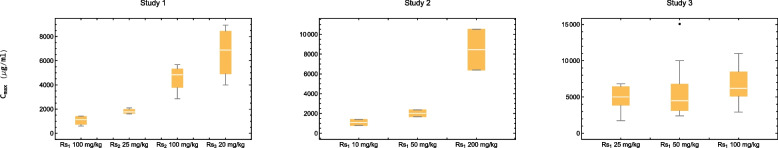
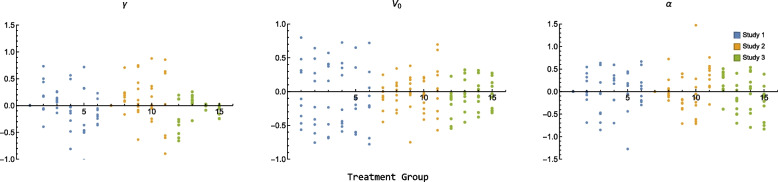
Methods: We used data from three xenograft mice studies to calibrate a model that accounts for radiation treatment combined with radiosensitizers. A nonlinear mixed effects approach was utilized where between-subject variability and inter-study variability were considered. Using the calibrated model, we ranked three different Ataxia telangiectasia-mutated inhibitors in terms of anticancer activity. The ranking was based on the Tumor Static Exposure (TSE) concept and primarily illustrated through TSE-curves.

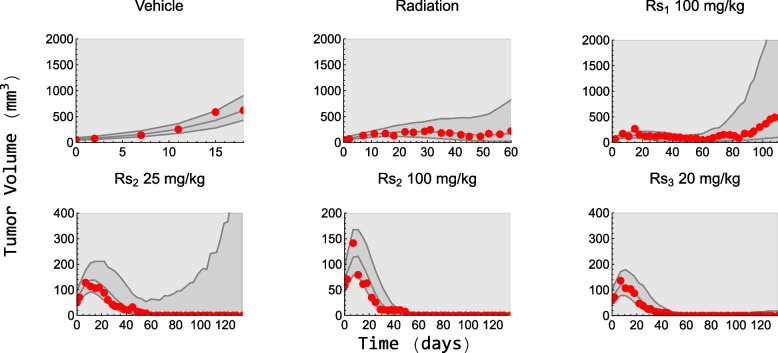
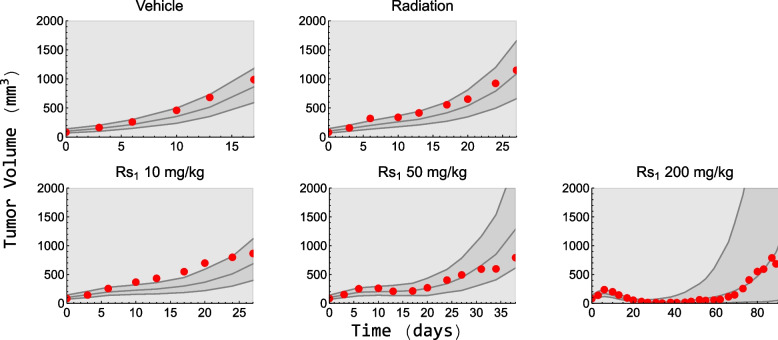
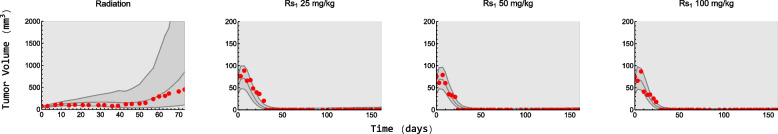
Results: The model described data well and the predicted number of eradicated tumors was in good agreement with experimental data. The efficacy of the radiosensitizers was evaluated for the median individual and the 95% population percentile. Simulations predicted that a total dose of 220 Gy (5 radiation sessions a week for 6 weeks) was required for 95% of tumors to be eradicated when radiation was given alone. When radiation was combined with doses that achieved at least 8 [Formula: see text] of each radiosensitizer in mouse blood, it was predicted that the radiation dose could be decreased to 50, 65, and 100 Gy, respectively, while maintaining 95% eradication.

Conclusions: A simulation-based method for calculating TSE-curves was developed, which provides more accurate predictions of tumor eradication than earlier, analytically derived, TSE-curves. The tool we present can potentially be used for radiosensitizer selection before proceeding to subsequent phases of the drug discovery and development process.

Keywords: Combination therapy; Inter-study variability; Non-linear mixed effects; Radiation therapy; Tumor static exposure.


Conflict of interest statement

FL is an employee of Merck Healthcare KGaA, Darmstadt, Germany.

AZ is an employee of Merck Healthcare KGaA, Darmstadt, Germany.

SB was an employee of Merck Healthcare KGaA, Darmstadt, Germany, at the time of the study.

Figures

Fig. 1
Fig. 1
A schematic representation of the long-term radiation and radiosensitizer model. V1 consists of proliferating tumor cells.V2, V3, and V4 are transit compartments consisting of damaged tumor cells. The growth rate of the proliferating cells is denoted by kg and the rate of natural cell death of all cells by kk. As a result of the radiation treatment cells become radiation damaged and this affects them in two ways. Firstly, the growth rate is inhibited and secondly, a fraction of proliferating cells is irreversibly damaged at each radiation session. These damaged cells are moved to U1 and can go through mitosis once, but their daughter cells (U2) cannot. Therefore, these radiation damage cells eventually also die. Both radiation effects are stimulated by the radiosensitizers. DR denotes the radiation dose and Rsi denotes the exposure of radiosensitizer i at the instant of radiation application
Fig. 2
Fig. 2
Tumor Static Exposure curve for two different exposures. Both axes can represent plasma concentration of an anticancer drug, one axis can also represent radiation dose. All exposure pairs on the blue line result in the tumor being in stasis and thus, exposures below it (red area) lead to tumor growth while exposures above it (green area) lead to tumor shrinkage. The values on the axes are only chosen for illustrative purposes
Fig. 3
Fig. 3
a The algorithm used to construct the median TSE-curve. The optimization problem formulated in Eq. 13 is iteratively solved to find the radiosensitizer exposure, which renders the median individual’s tumor to be in stasis for different radiation doses. The TSE-curve is then created through interpolation. b The algorithm used to construct percentile TSE-curves. A virtual dataset of individuals (here 1000) is first created. The optimization problem formulated in Eq. 13 is then iteratively solved for each individual, to find the radiosensitizer exposure that renders that individual’s tumor to be in stasis at different radiation doses. For a given percentile of interest, e.g., 95%, the radiosensitizer exposure that is sufficient for this percentile of tumors to be in stasis can be calculated for each radiation dose and the TSE-curve is then constructed through interpolation
Fig. 4
Fig. 4
Tumor volume versus time for one individual per treatment group and study. The continuous lines are the model predictions, and the dots are the experimental observations. Radiosensitizer and/or radiation treatment were given 5 days a week for either 1 or 6 weeks, and the black line along the x-axis denotes the treatment period of each study
Fig. 5
Fig. 5
TSE curves where the total radiation dose is plotted against the concentration of radiosensitizer. Exposure pairs on the curves are predicted to result in tumor stasis for the given population percentile. a Median TSE predictions using the simulation-based method (blue) and the analytical long-term method (yellow). b 80%, 90%, and 95% percentile predictions using the simulation-based TSE. The three black markers in both subfigures represent the exposure combinations of three treatment groups in study 3. The corresponding number of eradicated tumors observed for different exposure combinations is shown in the legend
Fig. 6
Fig. 6
Median (a) and 95% population TSE-curves (b) for each of the three radiosensitizers as continuous and dashed lines, respectively. Rs1, Rs2, and Rs3 are shown in blue, yellow, and green, respectively. The total radiation dose has been plotted versus the concentration of radiosensitizer. Exposure pairs on the curves are predicted to result in stasis for a 50% and b 95% of the tumors in a population. The ranking of the radiosensitizers is based on this figure
Fig. 7
Fig. 7
VPCs for the 100 mg/kg Rs1 using Cmax (left) and average radiosensitizer concentration (right). The continuous line in the middle of the grey area is the simulated median, and the grey area is a 90% confidence interval for the median. The red dots are the observed median from the experimental data. Tumor volume is shown on the y-axis and time on the x-axis
Fig. 8
Fig. 8
Boxplots showing the maximum observed plasma concentrations for each dose level of radiosensitizer in each study. Black horizontal lines represent the average maximum observed plasma concentration, which was used to drive the pharmacodynamics of the model
Fig. 9
Fig. 9
EBEs for the three log-normally distributed parameters. The different colors signify which study the different treatment groups are from, and the placement on the x-axis signifies which treatment group it is. The order the treatment groups are placed in is vehicle, radiation and then combination groups in increasing dose order. The different radiosensitizers in study 1 are placed in numerical order
Fig. 10
Fig. 10
VPCs for the different treatment groups in study 1. The continuous line in the middle of the grey area is the simulated median, and the grey area is a 90% confidence interval for the median. The red dots are the observed median from the experimental data. Tumor volume is shown on the y-axis and time on the x-axis
Fig. 11
Fig. 11
VPCs for the different treatment groups in study 2. The continuous line in the middle of the grey area is the simulated median, and the grey area is a 90% confidence interval for the median. The red dots are the observed median from the experimental data. Tumor volume is shown on the y-axis and time on the x-axis
Fig. 12
Fig. 12
VPCs for the different treatment groups in study 3. The continuous line in the middle of the grey area is the simulated median, and the grey area is a 90% confidence interval for the median. The red dots are the observed median from the experimental data. Tumor volume is shown on the y-axis and time on the x-axis
Fig. 13
Fig. 13
Cross-validation VPC for the 100 mg/kg Rs3 treatment group in study 3. The continuous line in the middle of the grey area is the simulated median, and the grey area is a 90% confidence interval for the median. The red dots are the observed median from the experimental data. Tumor volume is shown on the y-axis and time on the x-axis

Similar articles

References

    1. Philips T, Hoppe R, Roach M. Leibel and Phillips Textbook of Radiation Oncology. 3rd ed. 2010.
    1. Harrison L, Chadha M, Hill R, Hu K, Shasha D. Impact of tumor hypoxia and anemia on radiation therapy outcomes. Oncologist. 2002;7(6):492–508. doi: 10.1634/theoncologist.7-6-492. - DOI - PubMed
    1. Zimmermann A, Zenke FT, Chiu LY, Dahmen H, Pehl U, Fuchss T, et al. A new class of selective ATM inhibitors as combination partners of DNA double-strand break inducing cancer therapies. Mol Cancer Ther. 2022;21(6):859–870. doi: 10.1158/1535-7163.MCT-21-0934. - DOI - PMC - PubMed
    1. Li Y, Cucinotta FA. Mathematical model of ATM activation and chromatin relaxation by ionizing radiation. Int J Mol Sci. 2020;21(4):1214. doi: 10.3390/ijms21041214. - DOI - PMC - PubMed
    1. Wang H, Mu X, He H, Zhang XD. Cancer radiosensitizers. Trends Pharmacol Sci. 2018;39(1):24–48. doi: 10.1016/j.tips.2017.11.003. - DOI - PubMed

Substances