Review
. 2023 May 6;21(1):149.
doi: 10.1186/s12951-023-01890-7.

Recent development of surface-enhanced Raman scattering for biosensing

Affiliations
Review

Recent development of surface-enhanced Raman scattering for biosensing

Chenglong Lin et al. J Nanobiotechnology. .

Abstract

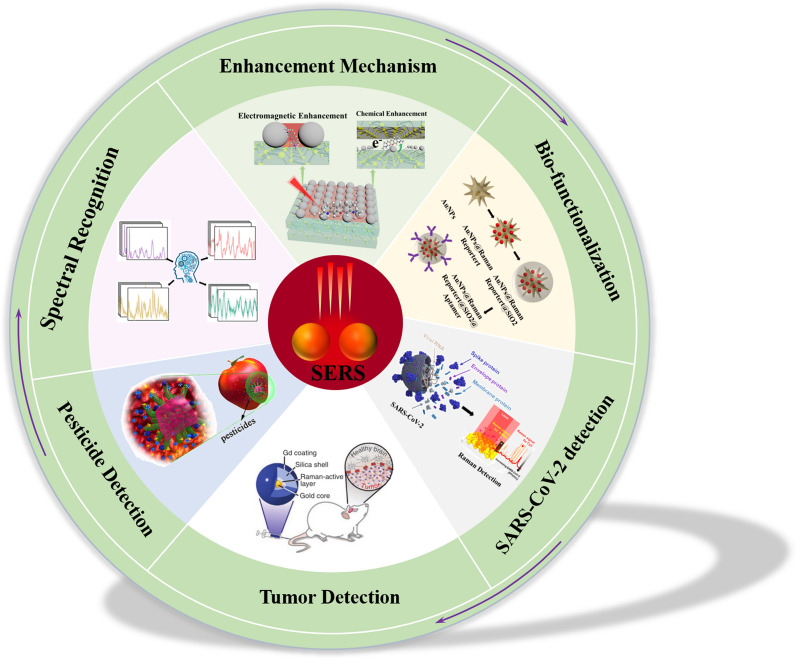
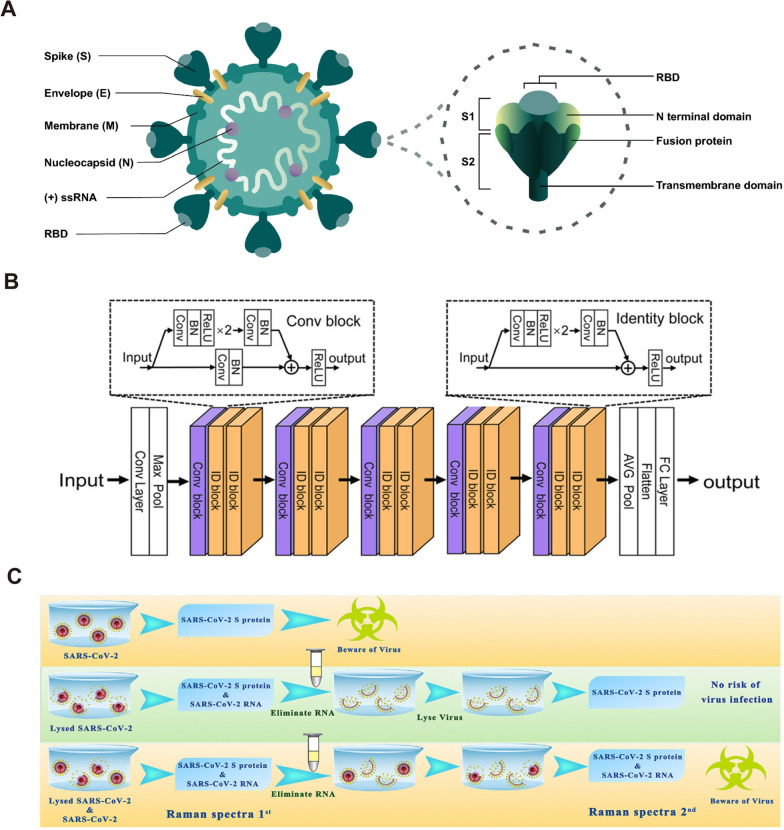
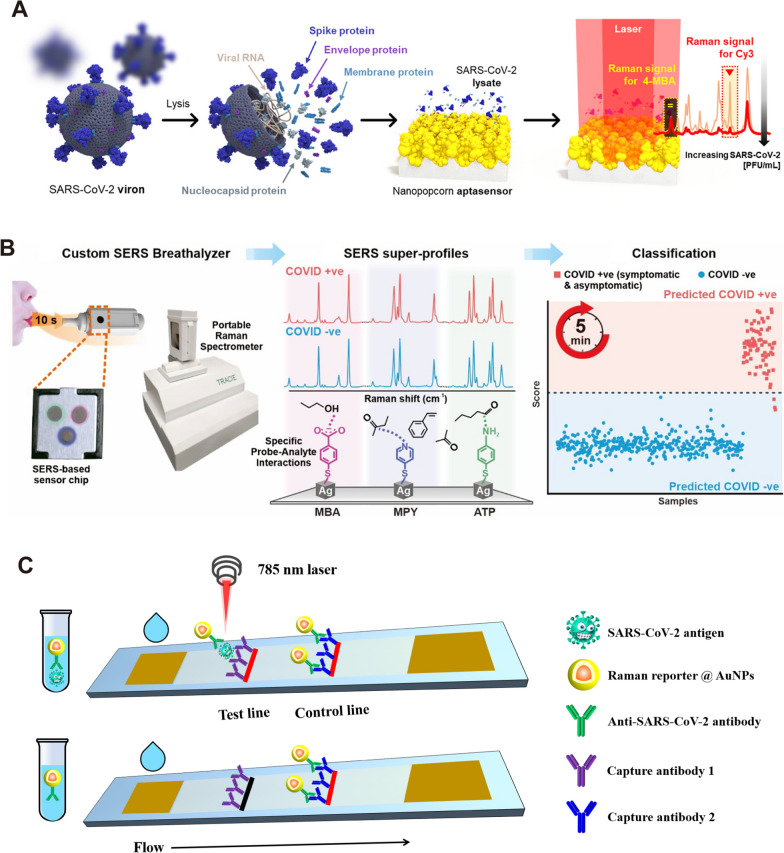
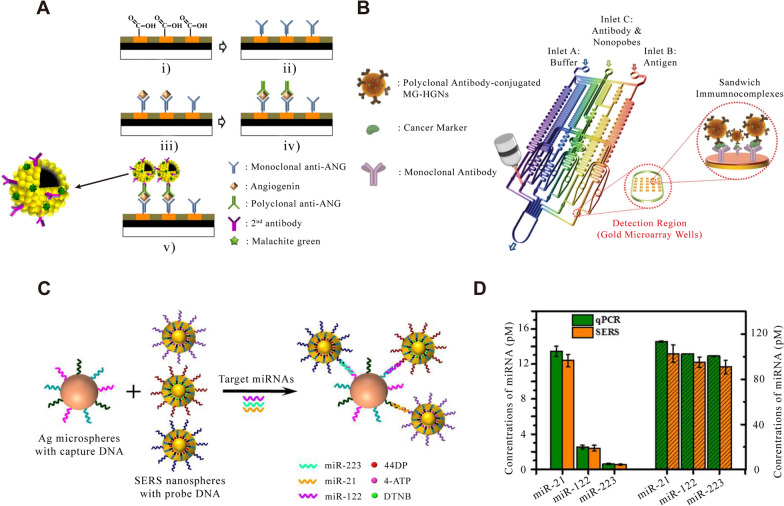
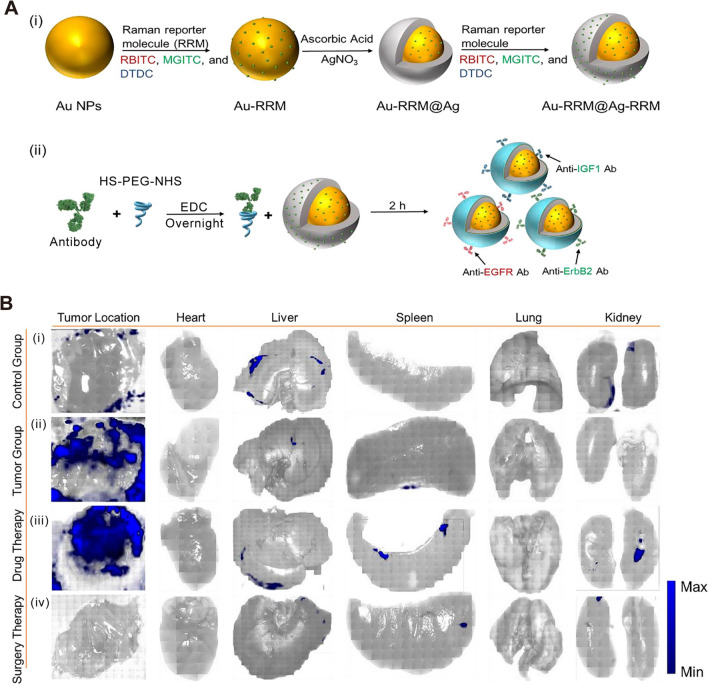
Surface-Enhanced Raman Scattering (SERS) technology, as a powerful tool to identify molecular species by collecting molecular spectral signals at the single-molecule level, has achieved substantial progresses in the fields of environmental science, medical diagnosis, food safety, and biological analysis. As deepening research is delved into SERS sensing, more and more high-performance or multifunctional SERS substrate materials emerge, which are expected to push Raman sensing into more application fields. Especially in the field of biological analysis, intrinsic and extrinsic SERS sensing schemes have been widely used and explored due to their fast, sensitive and reliable advantages. Herein, recent developments of SERS substrates and their applications in biomolecular detection (SARS-CoV-2 virus, tumor etc.), biological imaging and pesticide detection are summarized. The SERS concepts (including its basic theory and sensing mechanism) and the important strategies (extending from nanomaterials with tunable shapes and nanostructures to surface bio-functionalization by modifying affinity groups or specific biomolecules) for improving SERS biosensing performance are comprehensively discussed. For data analysis and identification, the applications of machine learning methods and software acquisition sources in SERS biosensing and diagnosing are discussed in detail. In conclusion, the challenges and perspectives of SERS biosensing in the future are presented.

Keywords: Biological imaging; Biomolecular; Machine learning; SARS-CoV-2; SERS; Tumor.


Conflict of interest statement

The authors declare that they have no competing interests.

Figures

Fig. 1
Fig. 1
Schematic illustration for various SERS-based applications in biomolecular detection
Fig. 2
Fig. 2
SERS biosensor based on antibody/antigen. A Sequential SERS-based assay process for the simultaneous detection of f-PSA and c-PSA. [63] B Schematic illustration of MANC preparation for J1 peptide detection. In the presence of J1, MANC-on-nanoplate structures are constructed and SERS signals of MGITC are observed. [67] C Mechanical deformation in an anti-H1/4-ATP sensor. (i) A pure 4-ATP SAM, (ii) Conjugation of anti-H1 leads to stretching of the 4-ATP molecule, (iii) Binding of H1 leads to reductions in the center-to-center distance between antibody molecules, thereby leading to mechanical relaxation in 4-ATP. [68] D Average SERS spectra at different antigen concentrations, showing shifts at (i) 865 and (ii) 1000 cm−1. [68] A reprinted with permission from Ref. 63, © 2017, American Chemical Society. B reprinted with permission from Ref. 67, © 2018, American Chemical Society. C and D reprinted with permission from Ref. 68, © 2012, American Chemical Society
Fig. 3
Fig. 3
SERS biosensor based on aptamer. A Schematic representation of SERS aptasensor for S. Sonnei determination utilizing dual-functional metal complex-ligated gold nanoparticles dimer. [74] B (i) Sequential procedure for fabricating two types of aptamer-modified NP SERS tags. (ii) Procedure for fabricating a dual MC sensor for MC-LR and MC-RR. [75] C Schematic diagram for the preparation and analytical principle of the aptameric sensor for cocaine. [76] D Schematic representation of aptasensor setup. Aptamer-functionalized AgNP were mixed with a labeled aptamer in buffered saline providing AgNP aggregates (ii). The aggregates were mixed with target viruses (iii) resulting in weaker SERS signals or with off-target biologicals (iv) losing SERS effect due to the elimination of the labeled aptamer from AgNP aggregates. [77] A reprinted with permission from Ref. 74, © 2020, Elsevier. B reprinted with permission from Ref. 75, © 2021, American Chemical Society. C reprinted with permission from Ref. 76, © 2008, John Wiley and Sons. D reprinted with permission from Ref. 77, © 2021, International Journal of Molecular Sciences
Fig. 4
Fig. 4
SERS biosensor based on peptide. A Schematic diagram of “virus traps” nanostructure SERS sensor for capturing SARS-CoV-2. [6] B Intensity of Raman bands (1027 cm−1) of SARS-CoV-2 S protein with different concentration detected with ACE2 functionalized GNAs and without ACE2 functionalized GNAs. The value marked on the line represents the number of S proteins in one Raman focused window. η represents enrichment multiple by ACE2. [6] C Schematic illustration of the fabrication of Ag NP-t-PLL film. (i) The amine groups of PLL chains of the t-PLL brush exposed positive charges in Ag NPs solution. The negatively charged Ag NPs were conjugated onto the film via strong electrostatic interaction and thus the (ii) Ag NP-t-PLL film in solution was formed. The film was removed from Ag NPs solution and then washed by deionized water. After the film was dried, (iii) the Ag NP-t-PLL film was prepared, and the W and D of Ag NP-t-PLL film were also defined. [90] A and B reprinted with permission from Ref. 6, © 2021, Springer Nature. C reprinted with permission from Ref. 90, © 2009, American Chemical Society
Fig. 5
Fig. 5
Label-free SERS for the detection of SARS-CoV-2. A Schematic representation of SARS‑CoV‑2 and spike glycoprotein main structural features. [122] B The framework of the CNN deep learning model for the diagnosis of SARS-CoV-2. [109] C Experimental procedure for diagnosing the infectiousness of SARS-CoV-2 [120]. A reprinted with permission from Ref. 122, © 2021, Springer Nature. B reprinted with permission from Ref. 109, © 2021, American Chemical Society. C reprinted with permission from Ref. 120, © 2022, Elsevier
Fig. 6
Fig. 6
Label-SERS for the detection of SARS-CoV-2. A Schematic illustration of the quantitative evaluation of SARS-CoV-2 using the SERS-based aptasensor. After SARS-CoV-2 lysates release the target spike proteins, they are recognized by the aptamer DNAs on the AuNPs surfaces. The spike protein-bound aptamers move away from the AuNPs surfaces, leading to a decreased Raman peak intensity of Cy3 reporters [107]. B Experimental procedure for diagnosing the infectiousness of SARS-CoV-2 [126]. C Simple illustration of SERS-LFA platform for detecting SARS-CoV-2 antigen. Liquid move via capillary flow on the nitrocellulose membrane. When SARS-CoV-2 antigens are present, they bind to the labeled AuNPs and continue to move until they are captured by the immobilized antibody 1. The labeled control antibodies comigrate until they are captured at the control band. A reprinted with permission from Ref. 107, © 2021, American Chemical Society. Figure B reprinted with permission from Ref. 126, © 2021, American Chemical Society
Fig. 7
Fig. 7
Tumor detection with cancer markers. A Schematics of sandwich immunocomplex formation for SERS imaging-based assay: (i) carboxylic acid modification, (ii) antibody immobilization, (iii) capturing of angiogenin antigens, (iv) polyclonal antibody immobilization, and (v) formation of HGN-binding immunocomplexes. [135] B Layout of a gold array-embedded gradient chip for the SERS-based immunoassay. The illustrations in the enlarged circles represent the formation of sandwich immunocomplexes on the surface of 5 × 5 round gold wells embedded in the gradient channel. [136] C Schematic Illustration of the Multiplex SERS assay for Triple-Target miRNA Detection. D Concentrations of miR-21, miR-122 and miR-223 in HepG2 samples measured by the proposed SERS sensor (orange column) and RT-PCR (green column). The left Y-axis represents the concentrations of singlet miRNA detection in cell sample. The right Y-axis represents the concentrations of multiplex miRNA detection in cell sample. Error bars show the standard deviation of three experiments. [143] A reprinted with permission from Ref. 135, © 2011, Elsevier. B reprinted with permission from Ref. 136, © 2012, Royal Society of Chemistry. C and D reprinted with permission from Ref. 143, © 2017, American Chemical Society
Fig. 8
Fig. 8
Cancer cell targeting and spectroscopic detection by using antibody-conjugated SERS nanoparticles. A Schematic illustrations (i) for the fabrication of three different Raman reporter-adsorbed Au–Ag core–shell nanoparticles and the conjugation of PEGylated antibodies on the surface of the above Au–Ag core–shell nanoparticles. [148] B The evaluation of before and after treatment towards the tumors based on SERS imaging. [148] (i) Control group: SERS imaging of right axilla of healthy nude mice and organs. (ii) Tumor group: SERS imaging of breast tumor and organs without any treatment. (iii) Drug therapy group: SERS imaging of breast tumor and organs after tamoxifen treatment for 15 days. (iv) Surgery therapy group: SERS imaging of breast tumor and organs after surgery. Figure A and Figure (B reprinted with permission from Ref. 148, © 2023, Elsevier
Fig. 9
Fig. 9
Cellular uptake mechanism of the quantum probe. A Schematic representation of the endocytosis mechanism. B Enhanced SERS signal for cancer and non-cancer cells. Magenta, cyan and green represent SERS signal and black spectra for non-SERS response. C Cell TEM reveal time-dependent cellular uptake of the quantum probes. Scale bar =10μm. [196] Figure (AC) reprinted with permission from Ref. 196, © 2018, Springer Nature
Fig. 10
Fig. 10
Imaging of cancer with microscopic precision using SERS nanoparticles. A Schematic synthesis process of GERTs, including (i) Au cores, (ii) 4-nitrobenzenethiol (4-NBT) modified Au cores, (iii) gap-enhanced Raman tags with a petal-like shell (P-GERTs), (iv) IR-780 modified P-GERTs and (v) GERTs. [207] B MPRs are injected intravenously into a mouse bearing an orthotopic brain tumor. As the nanoparticles circulate in the bloodstream, they diffuse through the disrupted blood–brain barrier and are then sequestered and retained by the tumor. The MPRs are too large to cross the intact blood–brain barrier and, therefore, cannot accumulate in healthy brain. [215] C SERS image of resection bed was acquired after surgical excision of tumor bulk (left). Resection was guided by white light only, with surgeon blinded to SERS images. Immunohistochemistry staining for human vimentin confirmed that SERS-positive signal (arrows 1 and 2) represented microscopic residual cancer at margins of resection bed (middle). Immunohistochemistry images on right are magnified views of areas indicated with arrows 1 and 2. D SERS image of locoregional tumor micrometastases. The multiple small foci of Raman signal (arrows 1 to 5) were found approximately 10 mm away from the margins of the bulk tumor. As confirmed by immunohistochemistry (middle), each of these 5 foci correlated with a separate tumor cluster (vimentin +) as small as 100 μm (micrometastases). Images on far right are magnified views of the metastases labeled 4 and 5. [216] A reprinted with permission from Ref. 207, © 2020, Royal Society of Chemistry. B reprinted with permission from Ref. 215, © 2012, Springer Nature. C, D reprinted with permission from Ref. 216, © 2017, American Chemical Society
Fig. 11
Fig. 11
In-situ inspection of pesticide residues on food. A Schematic of the SERS experiment (right) and the corresponding Raman spectra on fresh citrus fruits (left). Spectrum I, with clean pericarps; spectrum II, contaminated by parathion. Spectrum III, spectrum of contaminated orange modified by Au/SiO2 nanoparticles. Spectrum IV, Raman spectrum of solid methyl parathion. [12] B Schematic demonstration of preparation of SERS substrate and SERS Measurement. [225] On-site detection of MG on C a living fish scale and corresponding D Raman spectra. [229] E The sensitivity to various concentrations of thriam based on Au@Ag nanocuboids. [231] A reprinted with permission from Ref. 12, © 2021, Springer Nature. Figure B reprinted with permission from Ref. 225, © 2017, American Chemical Society. C and D reprinted with permission from Ref. 229, © 2018, Royal Society of Chemistry. E reprinted with permission from Ref. 231, © 2015, Royal Society of Chemistry

Similar articles

Cited by

References

    1. Fleischmann M, Hendra PJ, McQuillan AJ. Raman spectra of pyridine adsorbed at a silver electrode. Chem Phys Lett. 1974;26:163–166. doi: 10.1016/0009-2614(74)85388-1. - DOI
    1. Albrecht MG, Creighton JA. anomalously intense raman spectra of pyridine at a silver electrod. J Am Chem Soc. 1977;99:5215–5217. doi: 10.1021/ja00457a071. - DOI
    1. Jeanmaire DL, Vanduyne R. Surface raman spectroelectrochemistry: part I. heterocyclic, aromatic, and aliphatic amines adsorbed on the anodized silver electrode. J Electroanal Chem. 1977;84:1–20. doi: 10.1016/S0022-0728(77)80224-6. - DOI
    1. Halvorson RA, Vikesland PJ. Surface-enhanced raman spectroscopy (SERS) for environmental analyses. Environ Sci Technol. 2010;40:7749–7755. doi: 10.1021/es101228z. - DOI - PubMed
    1. Han Z, Liu H, Meng J, Yang L, Liu J, Liu J. Portable kit for identification and detection of drugs in human urine using surface-enhanced Raman spectroscopy. Anal Chem. 2015;87:9500–9506. doi: 10.1021/acs.analchem.5b02899. - DOI - PubMed