

doi: 10.1038/s41467-023-38291-1.
Roles of adenine methylation in the physiology of Lacticaseibacillus paracasei
Affiliations
- PMID: 37149616
- PMCID: PMC10164179
- DOI: 10.1038/s41467-023-38291-1
Item in Clipboard
Roles of adenine methylation in the physiology of Lacticaseibacillus paracasei
Nat Commun.
.
Abstract
Lacticaseibacillus paracasei is an economically important bacterial species, used in the food industry and as a probiotic. Here, we investigate the roles of N6-methyladenine (6mA) modification in L. paracasei using multi-omics and high-throughput chromosome conformation capture (Hi-C) analyses. The distribution of 6mA-modified sites varies across the genomes of 28 strains, and appears to be enriched near genes involved in carbohydrate metabolism. A pglX mutant, defective in 6mA modification, shows transcriptomic alterations but only modest changes in growth and genomic spatial organization.
© 2023. The Author(s).
Conflict of interest statement
The authors declare no competing interests.
Figures
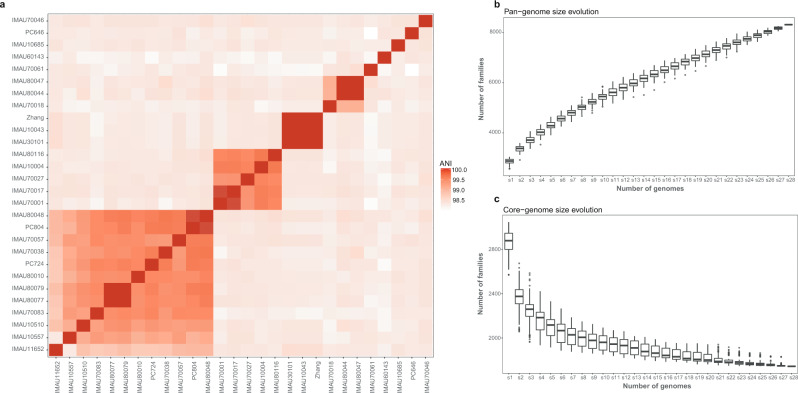
Heatmap displaying whole-genome level average nucleotide identity (ANI) across 27 L. paracasei isolates and L. paracasei Zhang (a); and their pan- (b) and core-genome (c) size evolution. The color scale next to the heatmap represents pairwise ANI values. The boxes in the boxplots represent the interquartile range of each group’s distribution of values; the lines inside the boxes represent the median values; the whiskers denote the lowest and highest values within 1.5 times the interquartile range of each group; the dots above/below the upper/lower line are the outliers.
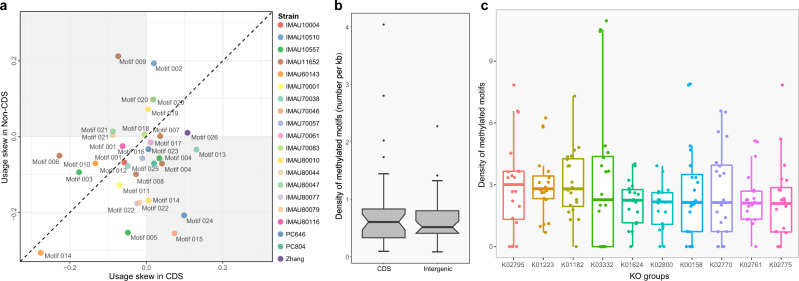
Motif usage bias revealed by the Markov chain approach based on the analysis of 26 motifs identified in this study. The data of each strain/isolate are represented by a data dot of different color, and each motif is assigned to a specific motif number. The distance between a data dot and its projection on the diagonal line measures the extent of motif usage biases between coding sequences (CDSs) and intergenic regions. Data dots below and above the diagonal line represent skewing toward CDSs and the intergenic regions, respectively (a). Notched boxplots of the average frequency of 6mA methylation of the 26 motifs in the CDSs and the intergenic regions (b); distribution of methylation sites across CDSs of the top 10 Kyoto Encyclopedia of Genes and Genomes (KEGG) Orthology (KOs) of 20 Lacticaseibacillus paracasei isolates (c). The x- and y-axes represent the KO groups and methylation density, respectively. X-axis is sorted according to the median methylation density of the KO group. KO groups: K02795, mannose PTS system EIIC component; K01223, 6-phospho-beta-glucosidase; K01182, oligo-1,6-glucosidase; K03332, fructan beta-fructosidase; K01624, fructose-bisphosphate aldolase, class II; K02800, mannitol PTS system EIICBA or EIICB component; K00158, pyruvate oxidase; K02770, fructose PTS system EIIBC or EIIC component; K02761, cellobiose PTS system EIIC component; K02775, galactitol-PTS system EIIC component. The length of the box represents the range between the 25th and 75th percentile; the lines inside the boxes represent the median values; the whiskers denote the lowest and highest values within 1.5 times the interquartile range of each group; the dots above/below the upper/lower line are the outliers.
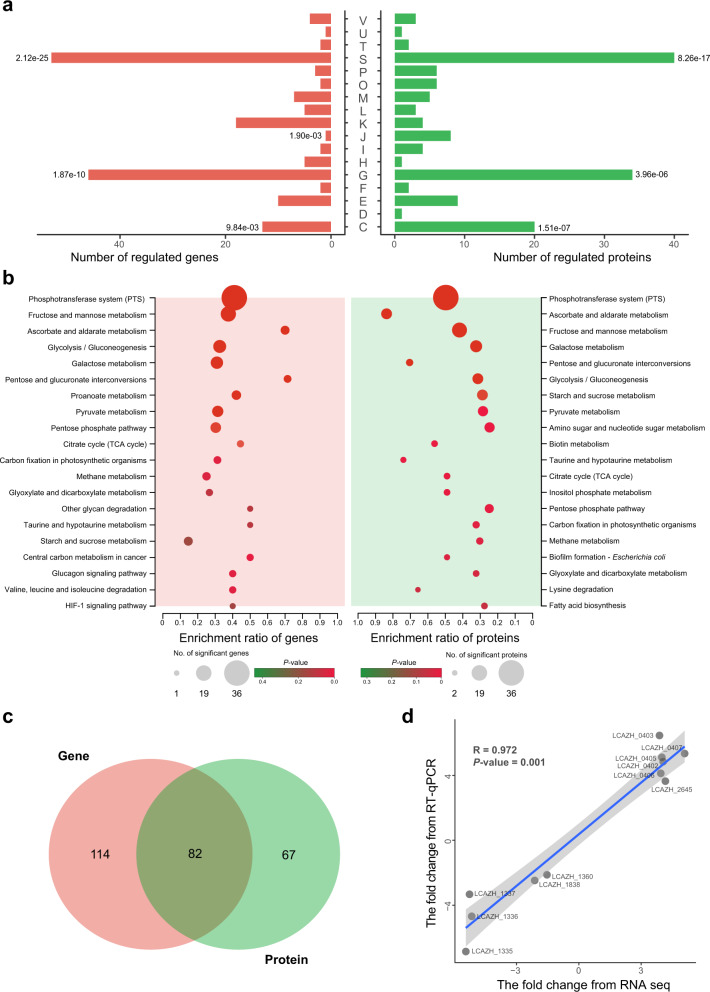
Distribution and enrichment analysis of DEGs and DEPs (left and right panels, respectively) across different Cluster of Orthologous Group of proteins (COG) functional categories. The DEGs and DEPs were identified by transcriptomics and proteomics, respectively. Significant enrichment is indicated by a single asterisk (the P values less than 0.05 are labeled; two-sided Fisher’s exact test). All exact P values are provided in the data source file (a). COG functional categories: [C], Energy production and conversion; [D], Cell cycle control, cell division, chromosome partitioning; [E], Amino acid transport and metabolism; [F], Nucleotide transport and metabolism; [G], Carbohydrate transport and metabolism; [H], Coenzyme transport and metabolism; [I], Lipid transport and metabolism; [J], Translation, ribosomal structure and biogenesis; [K], Transcription; [L], Replication, recombination and repair; [M], Cell wall/membrane/envelope biogenesis; [O], Posttranslational modification, protein turnover, chaperones; [P], Inorganic ion transport and metabolism; [S], Function unknown; [T], Signal transduction mechanisms; [U], Intracellular secretion, trafficking, and vesicular transport; [V], Defense mechanisms. Kyoto Encyclopedia of Genes and Genomes (KEGG) pathway enrichment analysis of DEGs and DEPs, shown in the left and the right panels, respectively. Statistical difference was tested by two-sided Fisher’s exact test; and the color scale represents the P values. P values with correction by the Benjamini–Hochberg procedure are shown in the data source file (b). Venn diagram showing common differentially regulated genes between transcriptomics and proteomics (c). Pearson correlation analysis of data generated by real-time quantitative polymerase chain reaction (RT-qPCR) and RNA-seq. X- and y-axes show the data of fold-change found by RNA-seq and RT-qPCR, respectively. The gray-shaded area represents the error band of Standard Deviation (SD) (d).
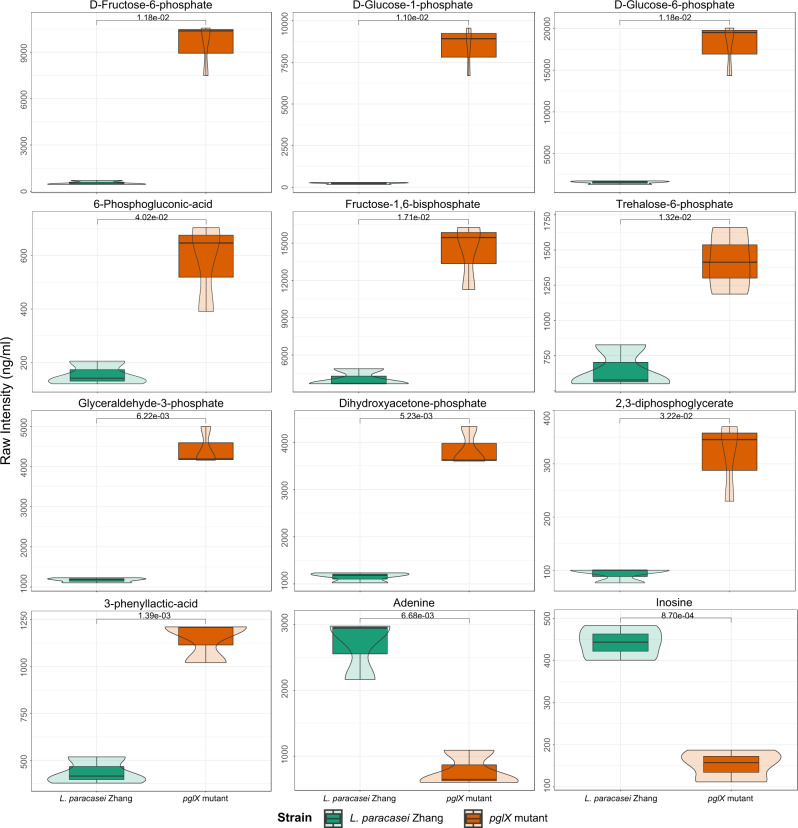
In each violin graph, the x-axis indicates the bacterial strain; and the y-axis indicates the raw signal intensity of detected metabolites. The width of the violin plot is proportional to the estimated density of the observed data. The bottom and top of the box show the 25th and 75th percentile; and the horizontal line in the box indicates the median value. Statistical difference was evaluated by t-test (two-sided). The P values less than 0.05 are labeled, and all exact P values are provided in the data source file.
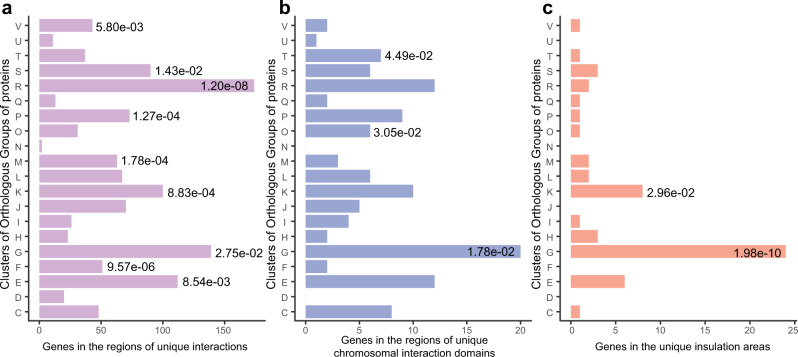
X-axis indicates the number of genes in the regions of unique interactions (a), unique chromosomal interaction domains (b), and unique insulation areas (c) were analyzed. Significant gene enrichment in a specific functional category is indicated by a single asterisk (the P values less than 0.05 are labeled; two-sided Fisher’s exact test). All P values are provided in the data source file. COG functional categories: [C], Energy production and conversion; [D], Cell cycle control, cell division, chromosome partitioning; [E], Amino acid transport and metabolism; [F], Nucleotide transport and metabolism; [G], Carbohydrate transport and metabolism; [H], Coenzyme transport and metabolism; [I], Lipid transport and metabolism; [J], Translation, ribosomal structure and biogenesis; [K], Transcription; [L], Replication, recombination and repair; [M], Cell wall/membrane/envelope biogenesis; [N], Cell motility; [O], Posttranslational modification, protein turnover, chaperones; [P], Inorganic ion transport and metabolism; [Q], Secondary metabolites biosynthesis, transport and catabolism; [R], General function prediction only; [S], Function unknown; [T], Signal transduction mechanisms; [U], Intracellular secretion, trafficking, and vesicular transport; [V], Defense mechanisms.
References
-
- Vandenbussche, I. et al. Detection of cytosine methylation in Burkholderia cenocepacia by single-molecule real-time sequencing and whole-genome bisulfite sequencing. Microbiology (Reading) 167 (2021). - PubMed
Publication types
MeSH terms
Substances
LinkOut - more resources
Full Text Sources
