. 2023 May 6;12(1):47.
doi: 10.1186/s40249-023-01091-2.

Transmission risk of Oropouche fever across the Americas

Affiliations

Transmission risk of Oropouche fever across the Americas

Daniel Romero-Alvarez et al. Infect Dis Poverty. .

Abstract

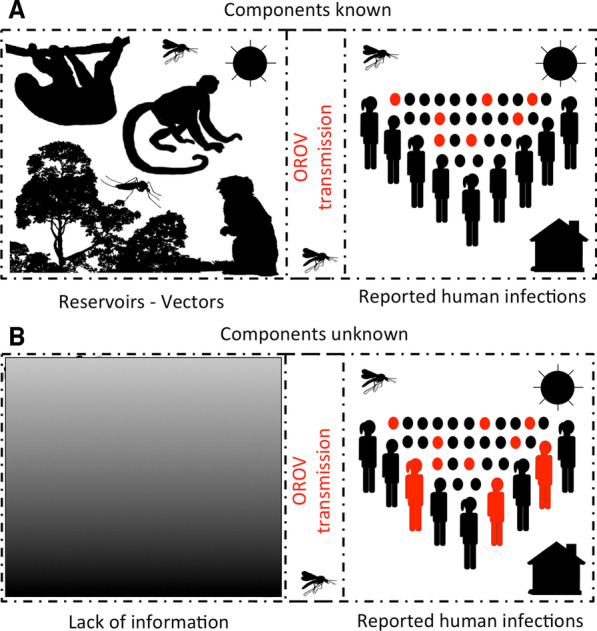
Background: Vector-borne diseases (VBDs) are important contributors to the global burden of infectious diseases due to their epidemic potential, which can result in significant population and economic impacts. Oropouche fever, caused by Oropouche virus (OROV), is an understudied zoonotic VBD febrile illness reported in Central and South America. The epidemic potential and areas of likely OROV spread remain unexplored, limiting capacities to improve epidemiological surveillance.

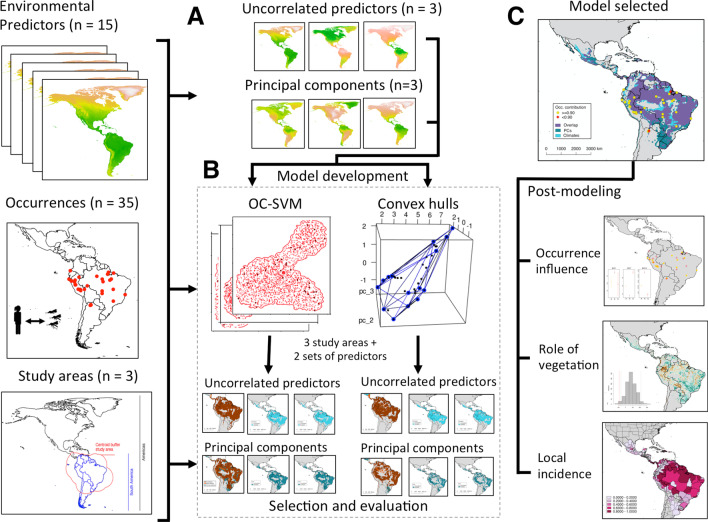
Methods: To better understand the capacity for spread of OROV, we developed spatial epidemiology models using human outbreaks as OROV transmission-locality data, coupled with high-resolution satellite-derived vegetation phenology. Data were integrated using hypervolume modeling to infer likely areas of OROV transmission and emergence across the Americas.

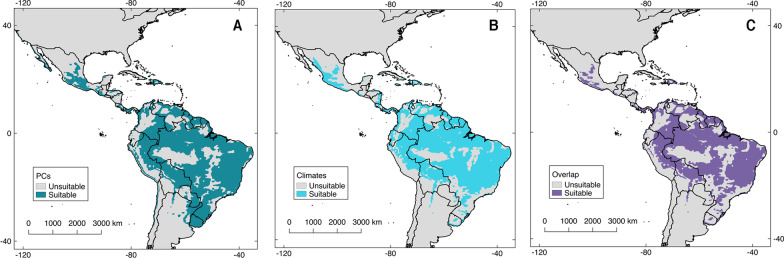
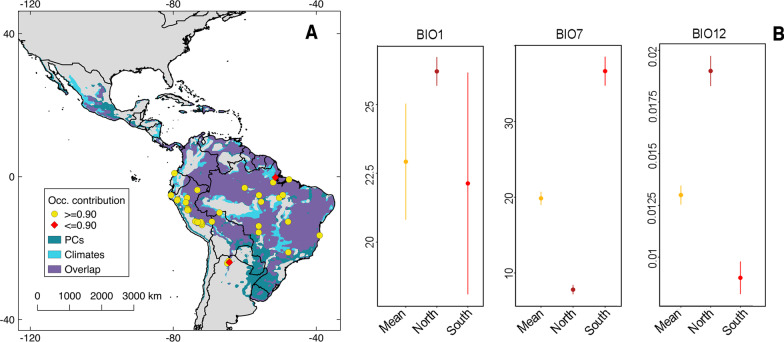
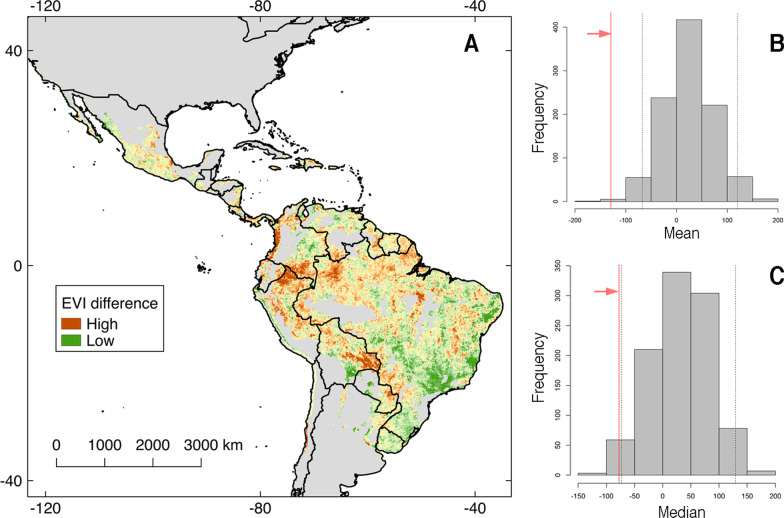
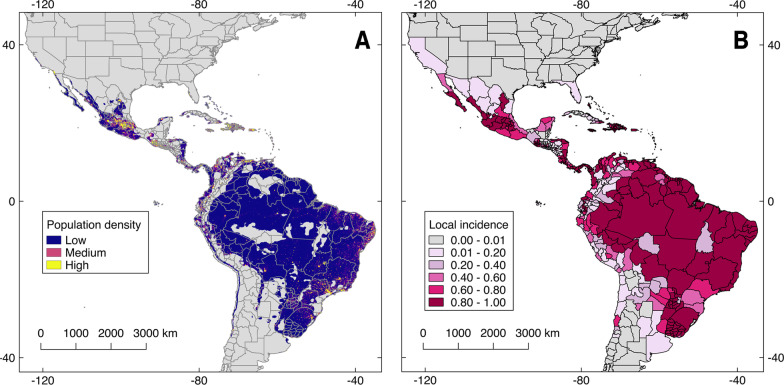
Results: Models based on one-support vector machine hypervolumes consistently predicted risk areas for OROV transmission across the tropics of Latin America despite the inclusion of different parameters such as different study areas and environmental predictors. Models estimate that up to 5 million people are at risk of exposure to OROV. Nevertheless, the limited epidemiological data available generates uncertainty in projections. For example, some outbreaks have occurred under climatic conditions outside those where most transmission events occur. The distribution models also revealed that landscape variation, expressed as vegetation loss, is linked to OROV outbreaks.

Conclusions: Hotspots of OROV transmission risk were detected along the tropics of South America. Vegetation loss might be a driver of Oropouche fever emergence. Modeling based on hypervolumes in spatial epidemiology might be considered an exploratory tool for analyzing data-limited emerging infectious diseases for which little understanding exists on their sylvatic cycles. OROV transmission risk maps can be used to improve surveillance, investigate OROV ecology and epidemiology, and inform early detection.

Keywords: Convex-hulls; Distribution modeling; Hypervolumes; One-class support vector machines; Oropouche fever; Oropouche virus; Risk mapping; Spatial modeling.


Conflict of interest statement

The authors declare that they have no competing interests.

Figures

Fig. 1
Fig. 1
Summary of the modeling and post-modeling steps followed for this research. We coupled 35 curated occurrence records of human Oropouche fever outbreaks with 15 environmental predictors for model development (A). Environmental multicollinearity was treated via a correlation matrix to select three environmental predictors (i.e., BIO1, BIO7 and BIO12), and an independent principal component analysis (PCA) over the 15 original variables for a total of two sets of predictors for model development over three different model calibration regions (A). We used one-class support vector machines (OC-SVM) and convex hull hypervolumes as algorithms to explore the environmental and geographical space defined by the occurrences and environments processed (B). After model selection and evaluation, we examined (i) the influence of each occurrence in the geographic space, (ii) the role of vegetation difference on recorded outbreaks, and (iii) calculated the human population overlapping with the Oropouche virus (OROV) transmission risk map (C)
Fig. 2
Fig. 2
Schematic representation of component or black box-based strategies for infectious disease species distribution modeling. In well-known systems, disease models should aim to model each component driving the life cycle of the pathogen to better characterize its distribution (A; [11, 12]). However, for Oropouche virus (OROV), there are multiple gaps in knowledge to actually make assumptions about its sylvatic cycle, specifically, reservoirs and vectors driving epizootics are poorly represented in the scientific literature (B; [4]). For these cases, the presence of human outbreaks allows a black box modeling where we assume that detected human cases represent the manifestation of the entire virus cycle despite the unknowns surrounding its components. Silhouettes developed with Adobe Photoshop Elements
Fig. 3
Fig. 3
Potential distribution of Oropouche virus (OROV) based on one-class support vector machines (OC-SVM) hypervolumes. Models based on one-class support vector machines hypervolumes and calibrated in the Americas had the best performance metrics, the larger geographical prediction, and the best agreement between suitability of principal components (PCs; A) and climatic predictors (B). The map in panel C shows areas of overlap between the suitability of both environmental predictors. Shapefile of the Americas obtained from NaturalEarth (https://www.naturalearthdata.com/) and maps developed with QGIS 2.18 ‘Las Palmas’ and Adobe Photoshop Elements
Fig. 4
Fig. 4
Occurrence contribution to the Oropouche virus (OROV) transmission risk map. Two occurrences (red; A) decreased the percentage of prediction in more than 10%. The localities identified differed climatically from the average of the rest of the points especially for BIO7 and BIO12 (B). BIO1: Annual mean temperature; BIO7: Temperature annual range; BIO12: Annual mean specific humidity. Shapefile of the Americas obtained from NaturalEarth (https://www.naturalearthdata.com/) and maps developed with QGIS 2.18 ‘Las Palmas’ and Adobe Photoshop Elements
Fig. 5
Fig. 5
Enhanced vegetation index (EVI) values across Oropouche virus (OROV) transmission risk map. Vegetation difference between 2019 and 2003 from the MOD13A2 version six products from the MODIS sensor from the TERRA satellite. A Regions with low (green) and high (brown) EVI difference are depicted inside the OROV transmission risk map. B Results of a randomization test using the mean of EVI values from the 35 OROV occurrences (red line) in comparison with 1000 replicates of 35 random draws across the OROV transmission risk map. Note that observations (arrow) fall outside the non-significant region (dashed lines) C Same as B but using the median as observed statistic. Shapefile of the Americas obtained from NaturalEarth (https://www.naturalearthdata.com/) and maps developed with QGIS 2.18 ‘Las Palmas’ and Adobe Photoshop Elements
Fig. 6
Fig. 6
Population at risk of Oropouche virus (OROV) transmission. We estimated the population at risk of OROV transmission using the population for 2020 via the WorldPop unconstrained data for the Americas (https://www.worldpop.org/geodata/summary?id=24777; A and the OROV distribution obtained through one-class support vector machines (OC-SVM) hypervolumes (Fig. 3 and 4). Our analysis suggests that 4,920,600 million people overlap with OROV transmission risk map. The right map depicts local incidence, as the proportion of population pixels suitable according to our model, divided by the total population pixels available in each province/state (B). Data for developing this map is available at the Additional file 4. Shapefile of the Americas obtained from NaturalEarth (https://www.naturalearthdata.com/) and maps developed with QGIS 2.18 ‘Las Palmas’ and Adobe Photoshop Elements

References

    1. Wilson AL, Courtenay O, Kelly-Hope LA, Scott TW, Takken W, Torr SJ, et al. The importance of vector control for the control and elimination of vector-borne diseases. PLoS Negl Trop Dis. 2020;14:e0007831. doi: 10.1371/journal.pntd.0007831. - DOI - PMC - PubMed
    1. Macdonald AJ, Mordecai EA. Amazon deforestation drives malaria transmission, and malaria burden reduces forest clearing. Proc Natl Acad Sci USA. 2020;116:22212–22218. doi: 10.1073/pnas.1905315116. - DOI - PMC - PubMed
    1. Vasconcelos PFC, Calisher CH. Emergence of human arboviral diseases in the Americas, 2000–2016. Vector-Borne Zoonotic Dis. 2016;16:295–301. doi: 10.1089/vbz.2016.1952. - DOI - PubMed
    1. Romero-Alvarez D, Escobar LE. Oropouche fever, an emergent disease from the Americas. Microbes Infect. 2017;20:135–146. doi: 10.1016/j.micinf.2017.11.013. - DOI - PubMed
    1. Durango-Chavez HV, Toro-Huamanchumo CJ, Silva-Caso W, Martins-Luna J, Aguilar-Luis MA, del Valle-Mendoza J, et al. Oropouche virus infection in patients with acute febrile syndrome: is a predictive model based solely on signs and symptoms useful? PLoS ONE. 2022;17:e0270294. doi: 10.1371/journal.pone.0270294. - DOI - PMC - PubMed

Supplementary concepts

LinkOut - more resources