. 2023 May 6;13(1):152.
doi: 10.1038/s41398-023-02448-9.

NAPE-PLD deletion in stress-TRAPed neurons results in an anxiogenic phenotype

Affiliations

NAPE-PLD deletion in stress-TRAPed neurons results in an anxiogenic phenotype

Margaryta Tevosian et al. Transl Psychiatry. .

Abstract

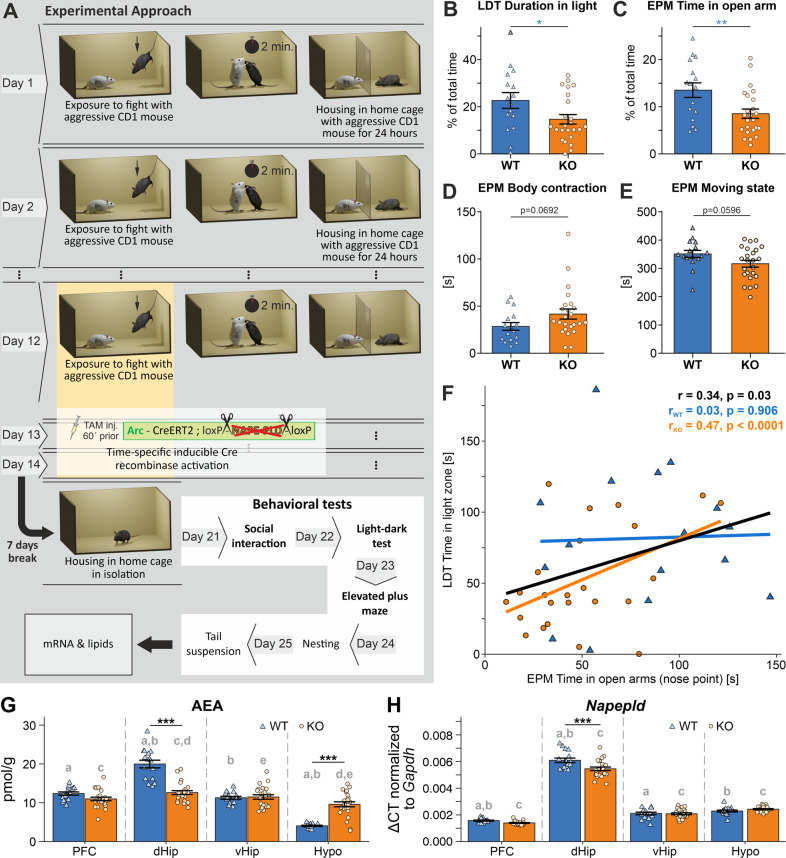
Anandamide (AEA) is an endogenous ligand of the cannabinoid CB1 and CB2 receptors, being a component of the endocannabinoid signaling system, which supports the maintenance or regaining of neural homeostasis upon internal and external challenges. AEA is thought to play a protective role against the development of pathological states after prolonged stress exposure, including depression and generalized anxiety disorder. Here, we used the chronic social defeat (CSD) stress as an ethologically valid model of chronic stress in male mice. We characterized a genetically modified mouse line where AEA signaling was reduced by deletion of the gene encoding the AEA synthesizing enzyme N-acyl-phosphatidylethanolamine-hydrolyzing phospholipase D (NAPE-PLD) specifically in neurons activated at the time of CSD stress. One week after the stress, the phenotype was assessed in behavioral tests and by molecular analyses. We found that NAPE-PLD deficiency in neurons activated during the last three days of CSD stress led to an increased anxiety-like behavior. Investigating the molecular mechanisms underlying this phenotype may suggest three main altered pathways to be affected: (i) desensitization of the negative feedback loop of the hypothalamic-pituitary-adrenal axis, (ii) disinhibition of the amygdala by the prefrontal cortex, and (iii) altered neuroplasticity in the hippocampus and prefrontal cortex.


Conflict of interest statement

The authors declare no competing interests.

Figures

Fig. 1
Fig. 1. Anxiety-like phenotype of Arc-NAPE-PLD KO mice.
A Scheme of experimental approach. CSD stress lasted for 14 days, TAM injections were performed on the last three days prior to CSD. The genetic manipulation in TRAPed neurons is illustrated: in Arc-expressing neurons, upon TAM application, the TAM-inducible CreERT2 recombinase excises NAPE-PLD gene sequences that are flanked by loxP sites. After seven days of housing in the home cage, behavioral tests were performed on day 21 to 25, followed by sacrifice, and mRNA and lipids extraction. B–E Group comparisons of Arc-NAPE-PLD WT and KO in standard behavioral tests. LDT: light-dark test (LDT), and elevated plus maze (EPM). Unpaired t test was used to identify significant differences, *p<0.05, **p<0.01. Data are represented as mean ± SEM. F Regression lines were drawn irrespective of genotype (black) as well as separately for WT (blue; n = 16) and KO (orange; n = 24) animals. The overall Pearson correlation coefficient as well as the correlation coefficients for each genotype and the respective p-value are shown on the plots. G, H AEA and Napepld mRNA levels in brain regions of stressed Arc-NAPE-PLD WT and KO mice. G AEA levels were measured using LC/MS. H Napepld mRNA levels were normalized to Gapdh. Genotype and brain region differences were assessed using linear mixed effects models. Genotype and brain region were included as fixed effects in the model and animal as random effect. Pairwise comparisons were based on estimated model means with Tukey p value adjustment in case of multiple comparisons. Asterisks indicate significant differences between genotypes in a specific region: *** p < 0.001. Letters indicate the significance of pairwise comparisons of different brain regions within the same genotype. Groups sharing the same letter are significantly different from each other at p < 0.05. Data are represented as mean ± SEM and individual values; WT/KO n = 16/24. PFC prefrontal cortex, dHip dorsal hippocampus, vHip ventral hippocampus, Hypo hypothalamus, Gapdh glyceraldehyde-3-phosphate-dehydrogenase, LC/MS liquid chromatography/mass spectrometry.
Fig. 2
Fig. 2. Principal component analysis (PCA) of endocannabinoids, arachidonic acid and analysed transcripts in different brain regions of stressed Arc-NAPE-PLD WT and KO mice.
The PCA model was calculated using all data from WT and KO mice. After the ordination procedure, WT (A) and KO (B) animals were visualized separately to investigate differences between brain regions within each genotype. The percentage of variance explained by each dimension is indicated on the respective axis in A and B. Confidence ellipses around each brain region were drawn at the 95% level. Loadings of the original variables on the first (PC1) and second principal component (PC2) are shown in C and D, respectively. Variables with an absolute loading greater than 0.4 were considered to significantly contribute to the observed multivariate pattern. E–H Multivariate differences in endocannabinoids, arachidonic acid and mRNA levels between stressed Arc-NAPE-PLD WT and KO mice. The effect of genotype for all brain regions was investigated using PCA or RDA. G The impact of genotype on the RDA ordination was examined statistically using permutational analysis of variance. Multivariate differences between WT and KO mice in the PFC were evaluated additionally using sPLS-DA. The percentage of variance explained by each dimension is indicated on the respective axis in E–G. Confidence ellipses for each genotype were drawn at the 95% level. H Correlations of the original variables with the first multivariate dimension (sPLS-DA1).
Fig. 3
Fig. 3. mRNA levels of selected molecular targets in brain regions of stressed Arc-NAPE-PLD WT and KO mice.
A Npy mRNA levels, B Arc mRNA levels, C Egr1 mRNA levels, D Cnr1 mRNA levels, E Faah mRNA levels, F Bdnf mRNA levels; mRNA levels were normalized to Gapdh. Genotype and brain region differences were assessed using linear mixed-effects models. Genotype and brain region were included as fixed effects in the model and animal as random effect. Pairwise comparisons were based on estimated model means with Tukey p-value adjustment in case of multiple comparisons. Asterisks indicate significant differences between genotypes in a specific region: *p < 0.05; **p < 0.01; ***p < 0.001. Letters indicate the significance of pairwise comparisons of different brain regions within the same genotype. Groups sharing the same letter are significantly different from each other at p ≤ 0.05. Data are represented as mean ± SEM and individual values; WT/KO n = 16/24. Npy neuropeptide Y, Erg1 early growth response factor 1, Cnr1 cannabinoid CB1 receptor, Faah fatty acid hydrolase, Bdnf brain-derived neurotrophic factor.
Fig. 4
Fig. 4. Correlation between selected behavioral response measurements and molecular markers in selected brain regions of Arc-NAPE-PLD WT and KO mice.
A, B Correlation between AEA and AA levels in dHip and the time mice spent in the open arms of the EPM. C, D Correlation between Cnr1 and Napepld mRNA levels in the PFC and the time mice spent in the light compartment of the LDT. E Correlation between Fkbp5 mRNA levels in vHip and the time spent interacting with the CD1 mouse in the SI test. Regression lines were drawn irrespective of genotype (black) as well as separately for WT (blue; n = 16) and KO (orange; n = 24) animals. The overall Pearson correlation coefficient as well as the correlation coefficients for each genotype and the respective p-value are shown on the plots. Fkbp5 FK506 binding protein 5.
Fig. 5
Fig. 5. Large-scale network activity in prelimbic cortex of Arc-NAPE-PLD WT and KO mice.
A Coronal slice of the prelimbic region of the mPFC on a MEA; scale bar 100 µm. B Representative traces of two typical LFP events, raw traces (top) and low-pass filtered (bottom). C Representative raster plots (top) and frequency bar plots (bottom) of spontaneous LFP events in WT and KO animal. D Comparison of number of active channels (top) and mean LFP event rates (bottom) in slices from WT and KO mice. Statistical significance was evaluated using Mann–Whitney´s U test, *p < 0.05. MEA microelectrode array, LFP local field potential.
Fig. 6
Fig. 6. Miniature postsynaptic currents and evoked inhibitory postsynaptic currents in prelimbic cortical neurons of Arc-NAPE-PLD WT and KO mice.
A Representative traces of miniature excitatory postsynaptic currents (mEPSCs) in neurons from WT and KO mice and analysis of mean frequency, amplitude, rise time and decay time in neurons from WT (n = 8) and KO (n = 9) mice. B Representative traces of miniatures inhibitory postsynaptic currents (mIPSCs) in neurons from WT (n = 14) and KO (n = 15) mice. The mean frequency of mIPSCs was significantly lower in KO animals than in WT (Student´s t test, ***p < 0.001). C Representative traces of evoked inhibitory postsynaptic currents at interstimulus interval (ISI) of 50 ms (left) and 1000 ms (center). Scaled events superimposed (right). Each trace is the average of 10 repetitions. D Statistical analysis demonstrated reduced amplitude of the mean first event as well as longer decay time in neurons from KO mice compared to WT. The paired-pulse ratio (PPR) was significantly increased in KO mice for ISI up to 250 ms (ANOVA, Bonferroni´s multiple comparisons test). Statistical significance was evaluated using Mann-Whitney´s U test for amplitude of first event and Student´s t test for decay time. *p < 0.05, **p < 0.005.

Similar articles

Cited by

References

    1. Kano M, Ohno-Shosaku T, Hashimotodani Y, Uchigashima M, Watanabe M. Endocannabinoid-mediated control of synaptic transmission. Physiol Rev. 2009;89:309–80. doi: 10.1152/physrev.00019.2008. - DOI - PubMed
    1. Busquets-Garcia A, Bains J, Marsicano G. CB1 Receptor Signaling in the Brain: Extracting Specificity from Ubiquity. Neuropsychopharmacol. 2018;43:4–20. doi: 10.1038/npp.2017.206. - DOI - PMC - PubMed
    1. Hussain Z, Uyama T, Tsuboi K, Ueda N. Mammalian enzymes responsible for the biosynthesis of N-acylethanolamines. Biochim Biophys Acta Mol Cell Biol Lipids. 2017;1862:1546–61. doi: 10.1016/j.bbalip.2017.08.006. - DOI - PubMed
    1. Ahn K, McKinney MK, Cravatt BF. Enzymatic pathways that regulate endocannabinoid signaling in the nervous system. Chem Rev. 2008;108:1687–707. doi: 10.1021/cr0782067. - DOI - PMC - PubMed
    1. Leishman E, Mackie K, Luquet S, Bradshaw HB. Lipidomics profile of a NAPE-PLD KO mouse provides evidence of a broader role of this enzyme in lipid metabolism in the brain. Biochimica Et Biophysica Acta Bba - Mol Cell Biol Lipids. 2016;1861:491–500. - PMC - PubMed

Publication types

LinkOut - more resources