. 2023 May 6;13(1):7401.
doi: 10.1038/s41598-023-34123-w.

Historic evolution of population exposure to heatwaves in Xinjiang Uygur Autonomous Region, China

Affiliations

Historic evolution of population exposure to heatwaves in Xinjiang Uygur Autonomous Region, China

Diwen Dong et al. Sci Rep. .

Erratum in

Abstract

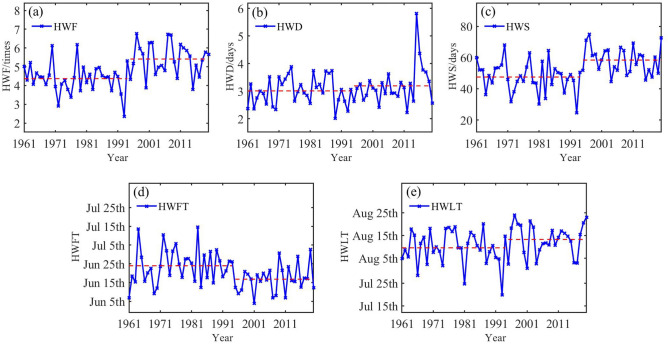
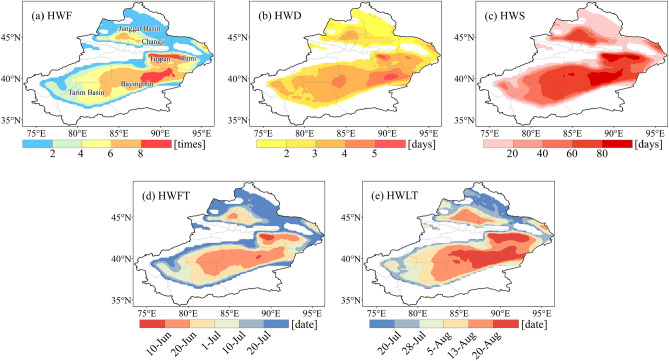
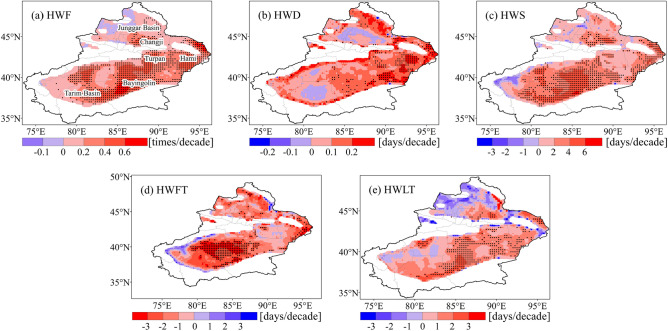
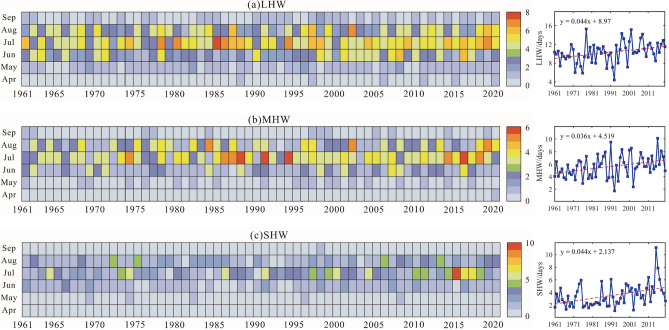
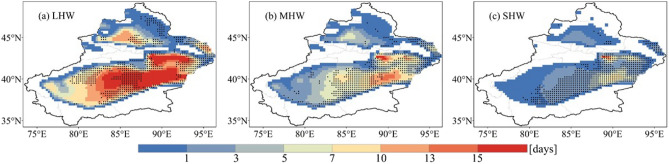
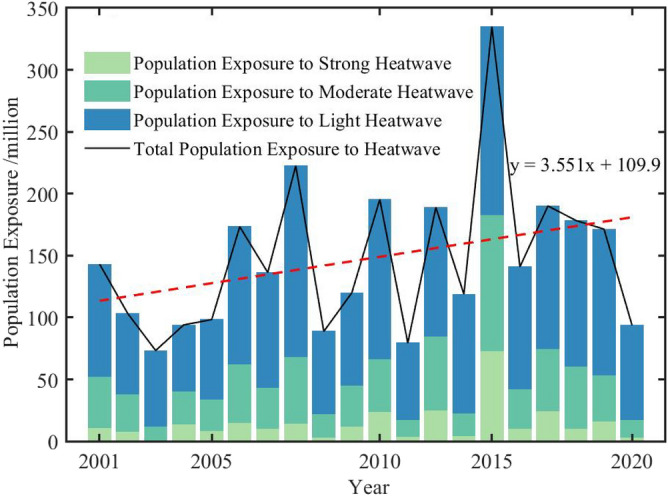
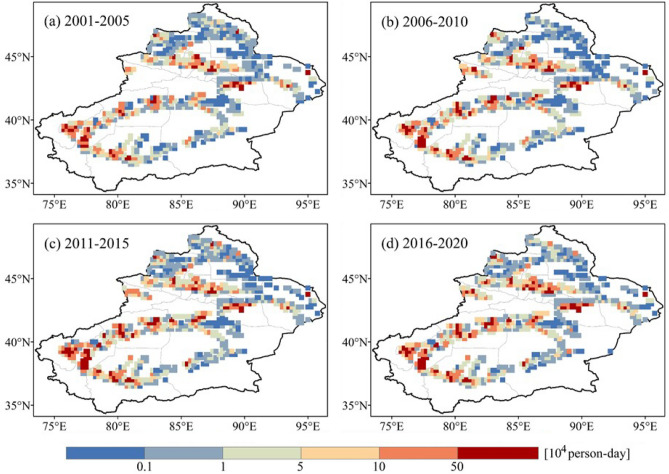
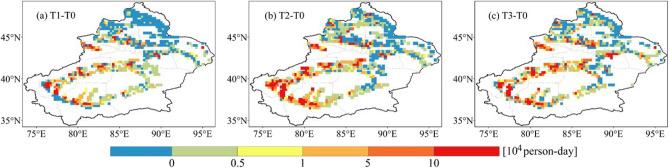
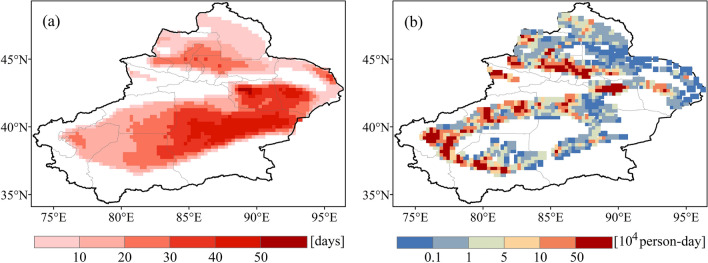
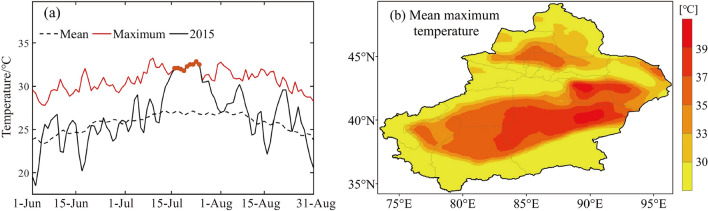
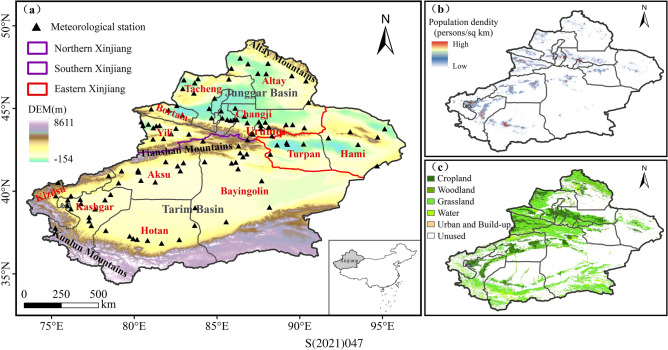
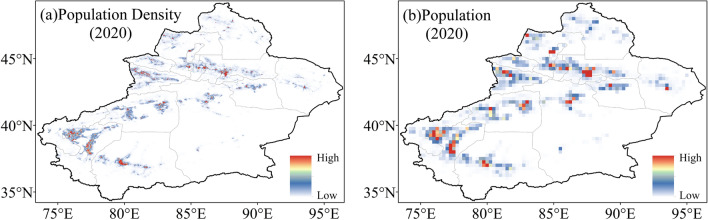
Heatwaves have pronounced impacts on human health and the environment on a global scale. Although the characteristics of heatwaves has been well documented, there still remains a lack of dynamic studies of population exposure to heatwaves (PEH), particularly in the arid regions. In this study, we analyzed the spatio-temporal evolution characteristics of heatwaves and PEH in Xinjiang using the daily maximum temperature (Tmax), relative humidity (RH), and high-resolution gridded population datasets. The results revealed that the heatwaves in Xinjiang occur more continually and intensely from 1961 to 2020. Furthermore, there is substantial spatial heterogeneity of heatwaves with eastern part of the Tarim Basin, Turpan, and Hami been the most prone areas. The PEH in Xinjiang showed an increasing trend with high areas mainly in Kashgar, Aksu, Turpan, and Hotan. The increase in PEH is mainly contributed from population growth, climate change and their interaction. From 2001 to 2020, the climate effect contribution decreased by 8.5%, the contribution rate of population and interaction effects increased by 3.3% and 5.2%, respectively. This work provides a scientific basis for the development of policies to improve the resilience against hazards in arid regions.


Conflict of interest statement

The authors declare no competing interests.

Figures

Figure 1
Figure 1
Times series of (a) heatwave frequency (HWF), (b) heatwave duration (HWD), (c) heatwave season length (HWS), (d) first heatwave timing (HWFT), and (e) last heatwave timing (HWLT) in Xinjiang from 1961 to 2020. Dashed lines indicate their average of the corresponding time period.
Figure 2
Figure 2
Spatial distribution of annual averaged (a) heatwave frequency (HWF), (b) heatwave duration (HWD), (c) heatwave season length (HWS), (d) first heatwave timing (HWFT), and (e) last heatwave timing (HWLT) in Xinjiang from 1961 to 2020.
Figure 3
Figure 3
Trends of (a) heatwave frequency (HWF), (b) heatwave duration (HWD), (c) heatwave season length (HWS), (d) first heatwave timing (HWFT), and (e) last heatwave timing (HWLT) in Xinjiang from 1961 to 2020. Stippling denotes statistically significant trends (p < 0.05).
Figure 4
Figure 4
Times series of (a) light heatwaves (LHW), (b) moderate heatwaves (MHW), and (c) strong heatwaves (SHW) in Xinjiang from 1961 to 2020. Dashed lines indicate corresponding linear trends.
Figure 5
Figure 5
Spatial distribution of (a) light heatwaves (LHW), (b) moderate heatwaves (MHW), and (c) strong heatwaves (SHW) in Xinjiang from 1961 to 2020. Stippling denotes statistically significant trends (p < 0.05).
Figure 6
Figure 6
Population exposure to different grades of heatwaves in Xinjiang from 2001 to 2020. Dashed line indicates corresponding linear trends.
Figure 7
Figure 7
Spatial distribution of population exposure to heatwaves (PEH) in Xinjiang.
Figure 8
Figure 8
Changes in population exposure to heatwaves (PEH) for different periods (a 2006–2010, b 2011–2015, and c 2015–2020) compared with the base period (2001–2005).
Figure 9
Figure 9
(a) Heatwave days in Xinjiang for 2015. (b) Population exposure to heatwaves in Xinjiang for 2015.
Figure 10
Figure 10
(a) Variation of daily maximum temperature (Tmax) in Xinjiang. The red solid line represents the maximum values of Tmax from 1961 to 2020. The black solid line represents the maximum values of Tmax in 2015. Red dots represent the maximum values of Tmax in 2015 that is the maximum from 1961 to 2020. Black dashed line represents Tmax averaged from 1961 to 2020. (b) Spatial distribution of the Tmax in Xinjiang for July 2015.
Figure 11
Figure 11
The geopotential height fields in (a) early July, (b) mid-July, (c) late July, and (e) early August for 2015.
Figure 12
Figure 12
Maps of the study region. (a) Topographic features of Xinjiang and subregional divisions: Northern Xinjiang, Southern Xinjiang, and Eastern Xinjiang. (b) Population density. (c) Vegetation types.
Figure 13
Figure 13
(a) Spatial patterns of population density in 2020. (b) Spatial patterns of population in 2020.

Similar articles

References

    1. Perkins SE. A review on the scientific understanding of heatwaves—Their measurement, driving mechanisms, and changes at the global scale. Atmos. Res. 2015;164:242–267. doi: 10.1016/j.atmosres.2015.05.014. - DOI
    1. Wang J, Meng B, Pei T, Du Y, Zhang J, Chen S, Tian B, Zhi G. Mapping the exposure and sensitivity to heat wave events in China's megacities. Sci. Total Environ. 2021 doi: 10.1016/j.scitotenv.2020.142734. - DOI - PubMed
    1. Yang Q, Zheng J, Zhu H. Influence of spatiotemporal change of temperature and rainfall on major grain yields in southern Jiangsu Province, China. Glob. Ecol. Conserv. 2020 doi: 10.1016/j.gecco.2019.e00818. - DOI
    1. Robine J-M, Cheung SLK, Le Roy S, Van Oyen H, Griffiths C, Michel J-P, Herrmann FR. Death toll exceeded 70,000 in Europe during the summer of 2003. C.R. Biol. 2008;331:171–U175. doi: 10.1016/j.crvi.2007.12.001. - DOI - PubMed
    1. McEvoy D, Ahmed I, Mullett J. The impact of the 2009 heat wave on Melbourne's critical infrastructure. Local Environ. 2012;17:783–796. doi: 10.1080/13549839.2012.678320. - DOI

Publication types