. 2023 May 6;13(1):7408.
doi: 10.1038/s41598-023-34433-z.

Fickian yet non-Gaussian diffusion of a quasi-2D colloidal system in an optical speckle field: experiment and simulations

Affiliations

Fickian yet non-Gaussian diffusion of a quasi-2D colloidal system in an optical speckle field: experiment and simulations

Antonio Ciarlo et al. Sci Rep. .

Abstract

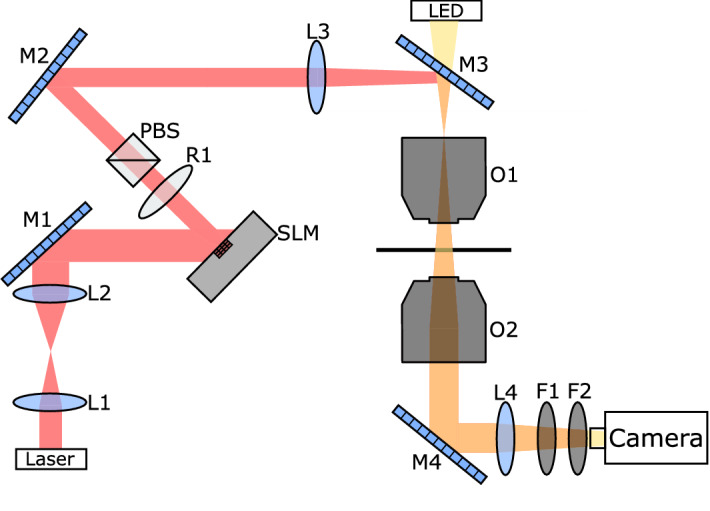
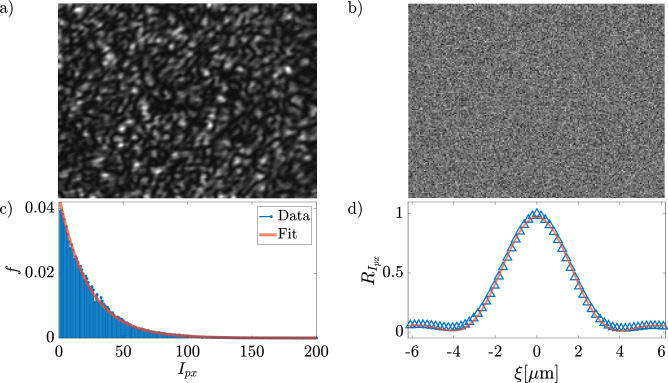
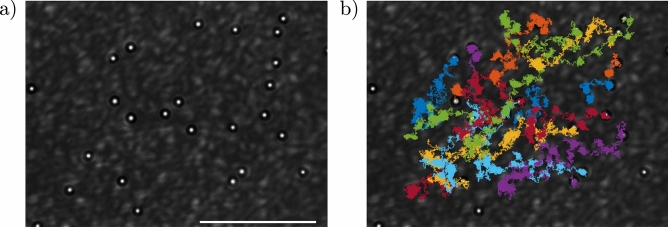
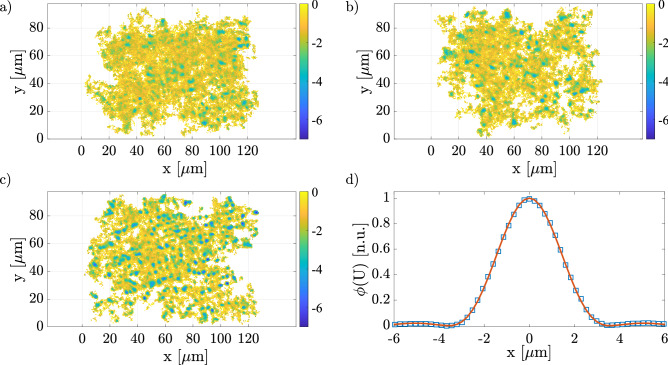
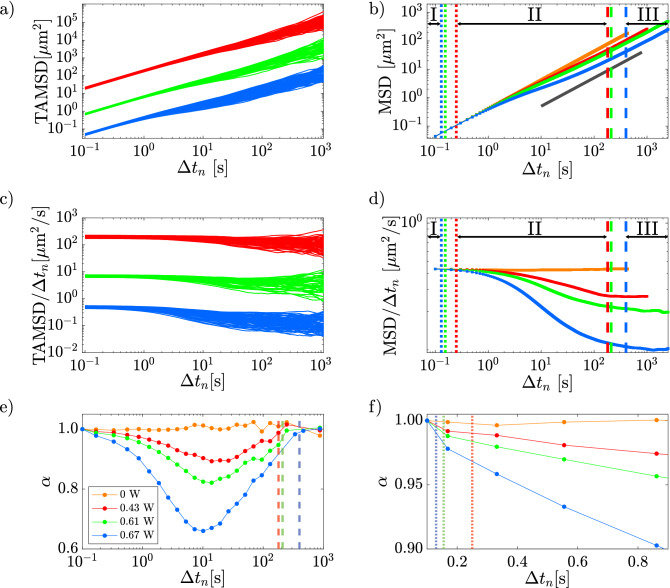
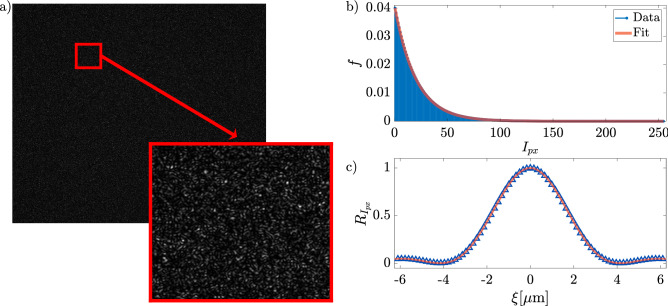
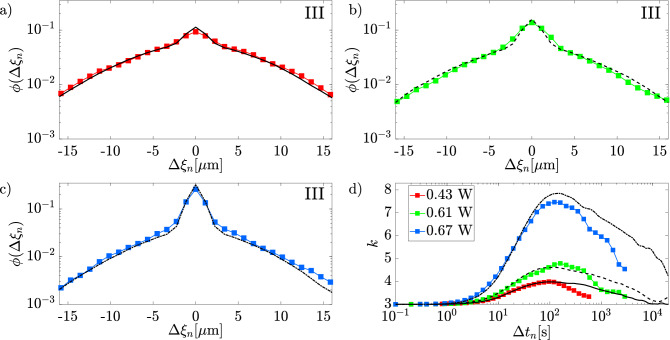
We investigate a quasi-2D suspension of Brownian particles in an optical speckle field produced by holographic manipulation of a laser wavefront. This system was developed to study, in a systematic and controllable way, a distinctive instance of diffusion, called Fickian yet Non Gaussian diffusion (FnGD), observed, during the last decade, for colloidal particles in a variety of complex and biological fluids. Our setup generates an optical speckle field that behaves like a disordered set of optical traps. First, we describe the experimental setup and the dynamics of the particles, focusing on mean square displacements, displacement distributions and kurtosis. Then, we present Brownian Dynamics simulations of point-like particles in a complex energy landscape, mimicking that generated by the optical speckle field. We show that our simulations can capture the salient features of the experimental results, including the emergence of FnGD, also covering times longer than the ones so far achieved in experiments. Some deviations are observed at long time only, with the Gaussian restoring being slower in simulations than in experiments. Overall, the introduced numerical model might be exploited to guide the design of upcoming experiments targeted, for example, to fully monitor the recovery of Gaussianity.


Conflict of interest statement

The authors declare no competing interests.

Figures

Figure 1
Figure 1
Schematic representation of experimental setup. In figure M1, M2, M3 and M4 are dichroic mirrors, O1 and O2 objectives, L1, L2, L3 and L4 lenses, R1 a polarizer, PBS a polarized beam splitter, and F1 and F2 infrared filters.
Figure 2
Figure 2
(a) a typical image of the optical speckle field with a power of 0.67 W acquired in the sample plane, and (b) the corresponding SLM mask. (c) histogram of pixel intensity and (d) the radial average of the auto-correlation function of the optical speckle field in (a). The solid lines are the fitting curves obtained with Eqs. (1) and (2).
Figure 3
Figure 3
Optical speckle fields for different laser power on the sample (a) 0.15 W, (b) 0.43 W, (c) 0.61 W, and (d) 0.67 W. The white line in panel (a) has a length of 50 μm.
Figure 4
Figure 4
Sample image acquired without one of the two IR filters (a) and including the recorded particle trajectories (b). The scale bar is 50 μm.
Figure 5
Figure 5
(ac) Optical potential landscapes obtained from the trajectories recorded at laser power P = 0.43 W, 0.61 W, and 0.67 W respectively. The colorbars are in unit of kBT; (d) auto-correlation function radial mean of the potential field at power 0.67 W.
Figure 6
Figure 6
(a) TAMSD for laser power 0.43 W (red lines), 0.61 W (green lines) and 0.67 W (blue lines); (b) MSD versus Δtn, where the gray solid line with slope 1 is a guide for the eye; (c) TAMSD/Δtn and (d) MSD/Δtn as a function of Δtn; (e) α versus Δtn; (f) zoom of  the panel (e) to show the transition between region I and II. In all panels, the dotted lines indicate τI/II, and the dashed lines τII/III.  Data in panel (a) and (c) have been shifted for clarity.
Figure 7
Figure 7
DDs in semi-logarithmic scale for (a) Δtn=0.1s, (b) Δtn=50s, and (c) Δtn=410s at different optical powers. Black curves in panel (c) are guides to the eyes corresponding to exponential decay,  with a slope close to the one of the DD at P=0.67W (blue); Panel (d) represents the kurtosis k values of the DDs as a function of the lag time Δtn.
Figure 8
Figure 8
(a) simulated optical speckle field of 2000μm×2000μm and zoom of a region of 78μm×78μm (inset), (b) histogram of pixel intensity, and (c) auto-correlation function along x and y direction.
Figure 9
Figure 9
(a) force field (red arrows) of simulated optical speckle field around a few grains; (b) a typical simulated trajectory; (c) simulated and experimental MSD for the lowest optical power P=0.43W, in the inset χrid2 as a function of C; (d) simulated (black lines) and experimental (colored lines) for different optical powers, as indicated.
Figure 10
Figure 10
Comparison between the experimental (colored line) and the simulated (black line) DD at Δt=410s at optical power P=0.43W (a), P=0.61W (b),and P=0.67W (c); (d) comparison between the experimental (colored lines) and the simulated kurtosis (black lines).

References

    1. Jang SP, Choi SUS. Role of Brownian motion in the enhanced thermal conductivity of nanofluids. Appl. Phys. Lett. 2004;84(21):4316–4318. doi: 10.1063/1.1756684. - DOI
    1. Hänggi P, Marchesoni F. Artificial Brownian motors: Controlling transport on the nanoscale. Rev. Modern Phys. 2009;81(1):387. doi: 10.1103/RevModPhys.81.387. - DOI
    1. Gray A, Greenhalgh D, Liangjian H, Mao X, Pan J. A stochastic differential equation sis epidemic model. SIAM J. Appl. Math. 2011;71(3):876–902. doi: 10.1137/10081856X. - DOI
    1. Einstein A. Über die von der molekularkinetischen theorie der wärme geforderte bewegung von in ruhenden flüssigkeiten suspendierten teilchen. Ann. Phys. 1905;4:10.
    1. Bouchaud J-P, Georges A. Anomalous diffusion in disordered media: Statistical mechanisms, models and physical applications. Phys. Rep. 1990;195(4–5):127–293. doi: 10.1016/0370-1573(90)90099-N. - DOI