. 2023 May 6;14(1):2628.
doi: 10.1038/s41467-023-38273-3.

Mapping PTBP2 binding in human brain identifies SYNGAP1 as a target for therapeutic splice switching

Affiliations

Mapping PTBP2 binding in human brain identifies SYNGAP1 as a target for therapeutic splice switching

Jennine M Dawicki-McKenna et al. Nat Commun. .

Abstract

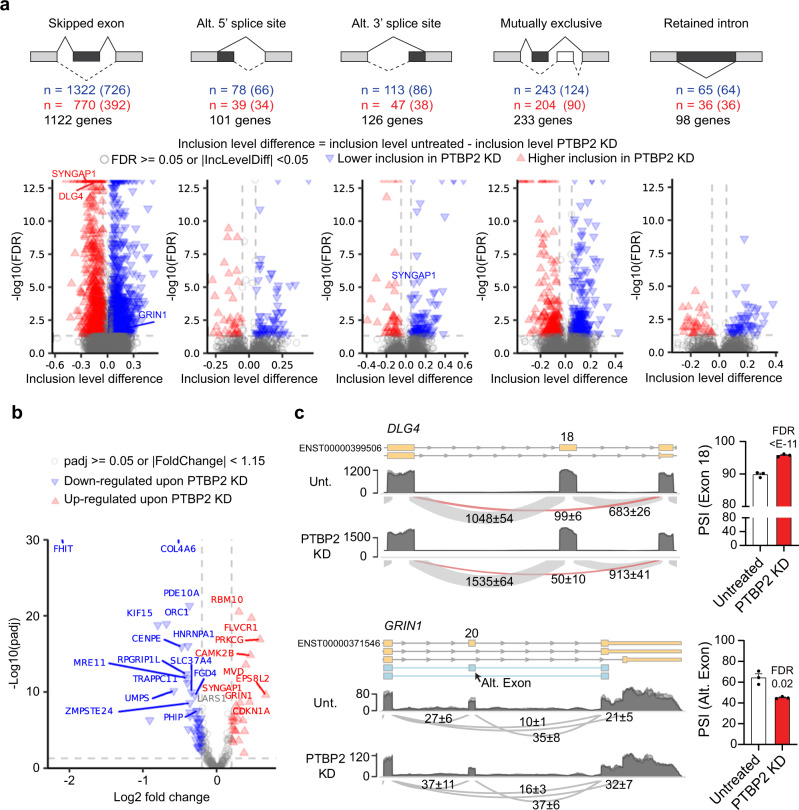
Alternative splicing of neuronal genes is controlled partly by the coordinated action of polypyrimidine tract binding proteins (PTBPs). While PTBP1 is ubiquitously expressed, PTBP2 is predominantly neuronal. Here, we define the PTBP2 footprint in the human transcriptome using brain tissue and human induced pluripotent stem cell-derived neurons (iPSC-neurons). We map PTBP2 binding sites, characterize PTBP2-dependent alternative splicing events, and identify novel PTBP2 targets including SYNGAP1, a synaptic gene whose loss-of-function leads to a complex neurodevelopmental disorder. We find that PTBP2 binding to SYNGAP1 mRNA promotes alternative splicing and nonsense-mediated decay, and that antisense oligonucleotides (ASOs) that disrupt PTBP binding redirect splicing and increase SYNGAP1 mRNA and protein expression. In SYNGAP1 haploinsufficient iPSC-neurons generated from two patients, we show that PTBP2-targeting ASOs partially restore SYNGAP1 expression. Our data comprehensively map PTBP2-dependent alternative splicing in human neurons and cerebral cortex, guiding development of novel therapeutic tools to benefit neurodevelopmental disorders.


Conflict of interest statement

Provisional patent 22-9943, “Compositions for treating SYNGAP-1 neurodevelopmental disorders”, which covers certain antisense oligonucleotides described herein, has been filed on behalf of J.M.D-M., A.J.F., B.L.D., B.L.P. and assigned to the University of Pennsylvania and Children’s Hospital of Philadelphia. The authors declare no additional competing interests.

Figures

Fig. 1
Fig. 1. Differential gene expression upon PTBP2 depletion in iPSC-neurons.
a Cartoon schematic of experimental design. Created with BioRender.com. b Western blot of PTBP protein levels at different stages of neuronal maturation. c Validation of PTBP2 depletion using “gapmer” ASOs in iPSC-neurons. (Left) qPCR and (Top and bottom right) Western blot of PTBP2. NegA, negative control gapmer. d Volcano plot of differential gene expression comparing untreated and PTBP2 KD iPSC-neurons. e SynGO enrichment analysis of curated synaptic genes differentially expressed upon PTBP2 KD (padj <0.05, |fold-change|>= 1.15) relative to a background set of brain-expressed genes represented as a sunburst plot. (Top) Biological Process, 224 genes. (Bottom) Cellular Component, 271 genes. f Category netplot (clusterProfiler) of the top synapse-associated GO terms overrepresented upon PTBP2 KD (Biological Process, PTBP2 KD vs. untreated iPSC-neurons) relative to a background of all genes evaluated. Color indicates fold-changes of differentially expressed synapse-associated genes (padj <0.05, |fold-change|> = 1.15). Size indicates number of genes in term. n = 3 biological replicates for iPSC-neurons RNA-seq data sets. b, c Data are represented as mean values ± SEM. All data points represent independent biological replicates. b, c (n = 3). b One-way ANOVA with Dunnett’s multiple comparison test vs. iPSCs. c, one-way ANOVA with Dunnett’s multiple comparison test vs. mock-treated cells (−). Source data are provided as a Source Data file. DGE differential gene expression, KD knock-down, FC fold change, PSD postsynaptic density, SV synaptic vesicle.
Fig. 2
Fig. 2. Differential splicing analysis following PTBP2 depletion in iPSC-neurons.
a (Top) Types of alternative splicing (AS) events, number of alternative events detected (number of nonoverlapping events in parentheses), and number of genes having at least one AS event for each type in PTBP2 KD vs. untreated iPSC-neurons. Fractional inclusion level difference is inclusion level untreated minus inclusion level PTBP2 KD and refers to inclusion of the darkly shaded element. (Bottom) Volcano plot for each alternative splicing type. See Supplementary Data 3 for inclusion level difference, and FDR of differentially spliced Orphanet genes. b Volcano plot of differential gene expression for the subset of Orphanet genes that are differentially spliced in PTBP2 KD vs. untreated iPSC-neurons (FDR < 0.05, |inclusion level difference|> = 0.05). c Representative AS events for DLG4 (top, encoding PSD-95) and GRIN1 (bottom) shown as sashimi plots (left; numbers indicate the number of reads spanning junctions ± SD) with replicates overlaid; at right is the percent spliced in (PSI) for the AS event detected by rMATS. Statistical significance determined in rMATS by a likelihood-ratio test at a cutoff of 1% difference. n = 3 biological replicates for iPSC-neurons RNA-seq data sets. Source data are provided as a Source Data file. FDR false discovery rate, IncLevelDiff inclusion level difference, KD knock-down, Alt. Exon alternative exon.
Fig. 3
Fig. 3. PTBP2 CLIP-seq in iPSC-neurons and human cortex.
a Representative PTBP2 eCLIP read density relative to size-matched input (replicates overlaid) on DLG4 (encoding PSD-95) showing called PTBP2 binding peaks (light blue arrows) at similar locations in human cortex (top) and iPSC-neurons (bottom) in the intronic region upstream of Exon 18, a known PTBP2 splicing target. b Top, fraction of PTBP2 CLIP-seq peaks by genomic feature for iPSC-neurons and human cortex. Bottom, fold-enrichment of each genomic feature with respect to size-matched input. c Motif enrichment analysis for PTBP2 CLIP-seq. Top-ranked motifs are shown for human cortex (p val 1e-2761, 28.6% of targets) and iPSC-neurons (p val 1e-677, 19.3% of targets). d Dotplot (clusterProfiler) showing the top 30 categories from GO enrichment analysis (Biological Process) of PTBP2 CLIP-seq peaks in human cortex. Gene ratio is number of genes with peak calls relative to total genes in GO group (count). Synapse-related terms are highlighted in blue. e SynGO enrichment analysis of PTBP2 CLIP-seq peaks in human cortex relative to a background set of brain-expressed genes represented as a sunburst plot. (Top) Biological Process, 623 genes. (Bottom) Cellular Component, 755 genes. f RBP-Maps-mediated positional analysis of PTBP2 peak calls relative to AS events identified as differentially spliced by rMATS upon PTBP2 KD in iPSC-neurons. Red indicates a higher inclusion level of the darkly shaded element upon PTBP2 KD; hence it suggests that endogenous PTBP2 promotes exclusion of the darkly shaded element (n = 1217, 203, 245, 553, and 127 for SE, A5SS, A3SS, MXE, and RI events, respectively). Blue indicates the opposite (n = 1806, 286, 342, 657, and 196 for SE, A5SS, A3SS, MXE, and RI events, respectively). n = 3 biological replicates for PTBP2 CLIP-seq and size-matched input controls. Source data are provided as a Source Data file. PSD postsynaptic density, SV synaptic vesicle.
Fig. 4
Fig. 4. PTBP2 binds and promotes differential splicing and nonsense-mediated decay of SYNGAP1.
a Zoom in for three regions of interest on SYNGAP1 showing (top) gene model of alternative splicing event (ENST00000418600 is the dominant isoform in brain), followed by (middle) human cortex CLIP-seq (peaks, PTBP2 eCLIP read coverage, size-matched input read coverage), then iPSC-neurons CLIP-seq (as for cortex). Bottom two rows depict RNA-seq read coverage and sashimi plots for untreated control and PTBP2 KD. n = 3 biological replicates (overlaid) for human cortex CLIP-seq and iPSC-neurons RNA-seq and CLIP-seq data sets. b Quantification of changes in AS at each of the three above regions of interest (aligned in column) upon PTBP2 KD by rMATS (left, 5 µM, statistical significance determined in rMATS by a likelihood-ratio test at a cutoff of 1% difference) and RT-PCR splicing assays (right). Light shaded rectangles denote constitutive exons and red rectangles denote NMD-inducing AS events. c RT-PCR splicing assays of each region of interest upon CHX treatment to inhibit NMD. d Quantification (qPCR) of SYNGAP1 mRNA fold change upon CHX treatment as measured across exon 16, 17. e Quantification of SYNGAP1 mRNA fold change upon PTBP2 KD. f SYNGAP1 protein expression by Western blot upon PTBP2 KD. bf Data are represented as mean values ± SEM. All data points represent independent biological replicates. b, e (n = 3). c, d, f (n = 6). b One-way ANOVA with Dunnett’s multiple comparison test vs. mock-treated cells (−). cf Student’s t test. Source data are provided as a Source Data file. FDR false discovery rate, CHX cycloheximide, FC fold change.
Fig. 5
Fig. 5. Disrupting PTBP binding in SYNGAP1 intron 10 site upregulates SYNGAP1.
a Western blot from HEK293T cells transfected for 48 h with siRNA against PTBP1 or PTBP2. siSC is a non-targeting control siRNA. b Top and left panel: RT-PCR from HEK293T cells transfected for 48 h with siRNA against PTBP1 or PTBP2 alone or in combination. Right panel: qPCR showing SYNGAP1 mRNA levels. c Top and left panel: RT-PCR from HEK293T cells transfected with 5 µM of PTBP decoy oligo for 48 h, including a non-targeting decoy (D_SCRM) as negative control. Right panel: qPCR showing SYNGAP1 mRNA levels. d Visualization of PTBP2 eCLIP-seq data from human cortex highlighting two highly enriched PTBP binding regions near SYNGAP1 exon 11: site 1 (green, intronic site) and site 2 (blue, NMD-inducing Exon 11x). Zoom-ins for both sites are provided including information about the nucleotide content (CU rich regions in red) and the location of the ASO walks. Light blue arrows indicate called peaks. e Scheme depicting 1-nt resolution ASO walk on SYNGAP1 site 1. The target region spans 33 nt of intronic sequence. Black lines denote introns, white rectangles denote constitutive exons and red rectangle denotes non-productive alternative exon (exon 11x). f RT-PCR from HEK293T cells transfected with 200 nM of ASO for 24 h, including a non-targeting ASO control (ET-SC) and no ASO control (Mock, −). g Top and left panel: RT-PCR from HEK293T cells transfected with increasing concentrations of lead ASO ET-019 and negative controls for 48 h. Right panel: qPCR showing SYNGAP1 mRNA levels. h Western blot from HEK293T cells transfected as in g. Data are represented as mean values ± SEM. All data points represent independent biological replicates. a, g, h (n = 3). b (n = 3 except n = 2 for siPTBP1 + siPTBP2). c (n = 4). f (n = 2). In a and b, one-way ANOVA with Dunnett’s multiple comparison test vs. siSC. c Student’s t test. g, h One-way ANOVA with Dunnett’s multiple comparison test vs. mock-treated cells (-). Source data are provided as a Source Data file. FC fold change.
Fig. 6
Fig. 6. Disrupting PTBP binding in SYNGAP1 exon 11x upregulates SYNGAP1.
a Top, Scheme depicting the initial 5-nt resolution ASO walk. The target region spans 93 nt of non-productive 3’ss in SYNGAP1. Bottom, RT-PCR from HEK293T cells transfected with 100 nM of ASO for 24 h, including a positive control ASO targeting SYNGAP1 site 1 (ET-019), a non-targeting ASO control (ET-SC) and no ASO control (Mock, -). b Top, Scheme depicting a combined 2-nt and 1-nt resolution ASO walk. The target region spans 38 nt of non-productive 3’ss in SYNGAP1. Bottom, RT-PCR from HEK293T cells transfected with 100 nM of ASO for 24 h, including the same controls as in a. c qPCR quantification of SYNGAP1 transcript levels from samples in b. d Non-productive and productive transcript levels calculated from densitometric analysis of RT-PCR products from b and represented as log2FC values relative to Mock. Arrows indicate ASOs that increase SYNGAP1 productive transcript and mRNA levels. Black line indicates ASOs that lead to no-go decay. e Top and left panel: RT-PCR from HEK293T cells transfected with increasing concentrations of STK-071, ET-085, and ET-SC for 48 h. Right panel: qPCR showing SYNGAP1 mRNA levels. f Western blot from HEK293T cells transfected as in e. Data are represented as mean values ± SEM. All data points represent independent biological replicates. ad (n = 2). e, f (n = 3). e, f One-way ANOVA with Dunnett’s multiple comparison test vs. mock-treated cells (–). Source data are provided as a Source Data file. FC fold change.
Fig. 7
Fig. 7. Disrupting PTBP2 binding in Site 1 and Site 2 upregulates SYNGAP1 mRNA in SYNGAP1 haploinsufficient patient cell lines.
a Schematic of SYNGAP1 mRNA showing the location of the heterozygous mutations present in the two independent SYNGAP1 patient iPSC lines. b Schematic depicting the generation of the SYNGAP1 R1240X patient-derived iPSC line and the corresponding isogenic control line in which the heterozygous mutation has been reverted using CRISPR/Cas9 technology. PBMCs peripheral blood mononuclear cells. Created with BioRender.com. c Top and right panels: SYNGAP1 Western blot from corrected (isogenic control) and patient SYNGAP1 R1240X iPSC-neurons. d Top and right panels: SYNGAP1 Western blot from WT and patient SYNGAP1 K1185X iPSC-neurons. c, d Left panel: qPCR showing SYNGAP1 mRNA levels. e Top and right panels: PTBP2 Western blot from K1185X NPCs treated for 3 d with PTBP2 gapmer. Left panel: PTBP2 mRNA fold change quantification (qPCR). f Top and left panels: SYNGAP1 RT-PCR from K1185X NPCs treated for 3 d with PTBP2 gapmer. Right panel: qPCR showing SYNGAP1 mRNA levels. g SYNGAP1 Western blot from samples in e. eg a non-targeting gapmer (NegA) was used as negative control. h Top and left panels: RT-PCR from R1240X iPSC-neurons treated for 7 d with ET-019 at 10 µM. Right panel: qPCR showing SYNGAP1 mRNA levels. i Top and left panels: RT-PCR from K1185X iPSC-neurons treated for 7 d with Site 1 and Site 2 targeting ASOs at 10 µM. Right panel: qPCR showing SYNGAP1 mRNA levels. White color data points represent an independent experiment. h, i Non-targeting ET-SC or ET-MM ASOs were included as negative controls. Data are represented as mean values ± SEM. All data points represent independent biological replicates. c, d (n = 3). eh (n = 6). i (n = 3 except n = 5 for Mock and n = 6 for ET-019 and ET-020). c, d Student’s t test. In eg, one-way ANOVA with Dunnett’s multiple comparison test vs. NegA-treated cells. h, i One-way ANOVA with Dunnett’s multiple comparison test vs. mock-treated cells. Source data are provided as a Source Data file. FC fold change.

References

    1. Raj B, Blencowe BJ. Alternative splicing in the mammalian nervous system: recent insights into mechanisms and functional roles. Neuron. 2015;87:14–27. doi: 10.1016/j.neuron.2015.05.004. - DOI - PubMed
    1. Vuong CK, Black DL, Zheng S. The neurogenetics of alternative splicing. Nat. Rev. Neurosci. 2016;17:265–281. doi: 10.1038/nrn.2016.27. - DOI - PMC - PubMed
    1. Su CH, Dhananjaya D, Tarn WY. Alternative splicing in neurogenesis and brain development. Front Mol. Biosci. 2018;5:12. doi: 10.3389/fmolb.2018.00012. - DOI - PMC - PubMed
    1. Khorkova O, Wahlestedt C. Oligonucleotide therapies for disorders of the nervous system. Nat. Biotechnol. 2017;35:249–263. doi: 10.1038/nbt.3784. - DOI - PMC - PubMed
    1. Crooke ST, Liang XH, Baker BF, Crooke RM. Antisense technology: a review. J. Biol. Chem. 2021;296:100416–100417. doi: 10.1016/j.jbc.2021.100416. - DOI - PMC - PubMed

Publication types

MeSH terms

Substances