. 2023 May 30;42(5):112486.
doi: 10.1016/j.celrep.2023.112486. Epub 2023 May 6.

Glial progenitor heterogeneity and key regulators revealed by single-cell RNA sequencing provide insight to regeneration in spinal cord injury

Affiliations

Glial progenitor heterogeneity and key regulators revealed by single-cell RNA sequencing provide insight to regeneration in spinal cord injury

Haichao Wei et al. Cell Rep. .

Abstract

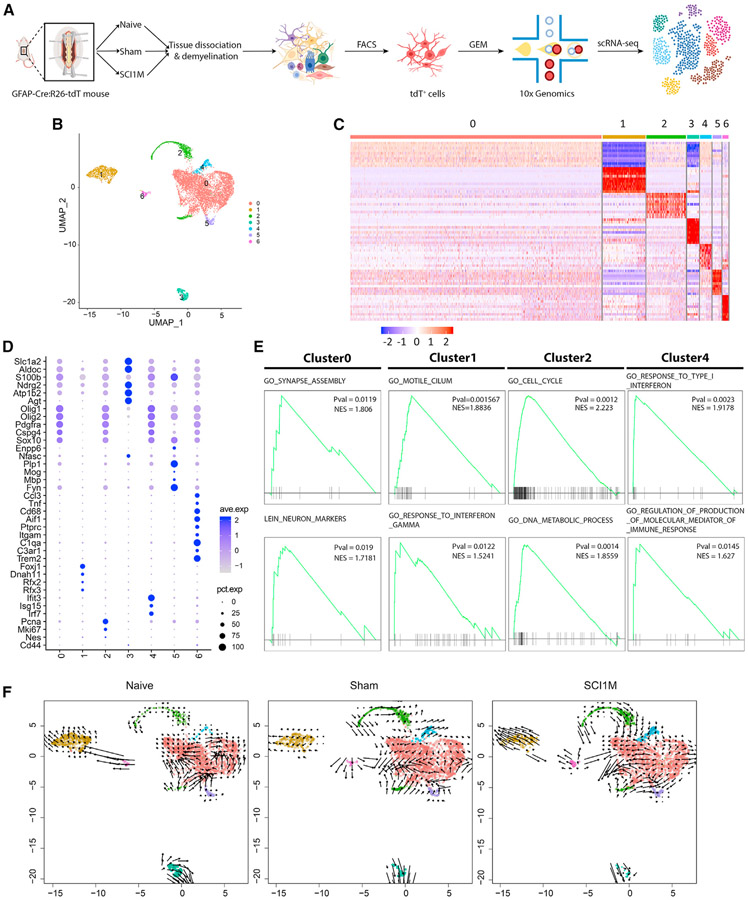
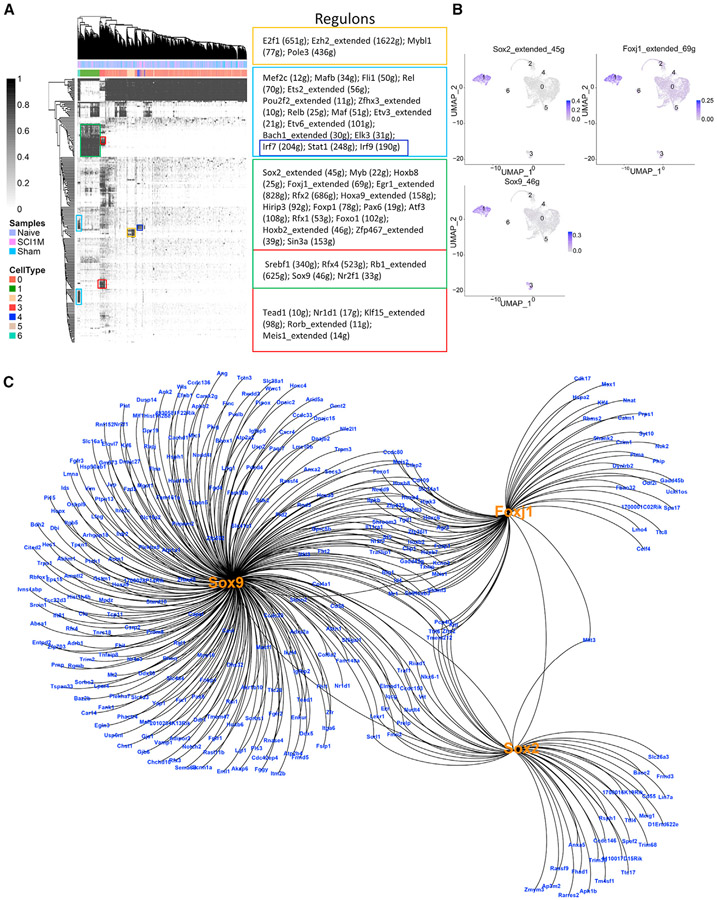
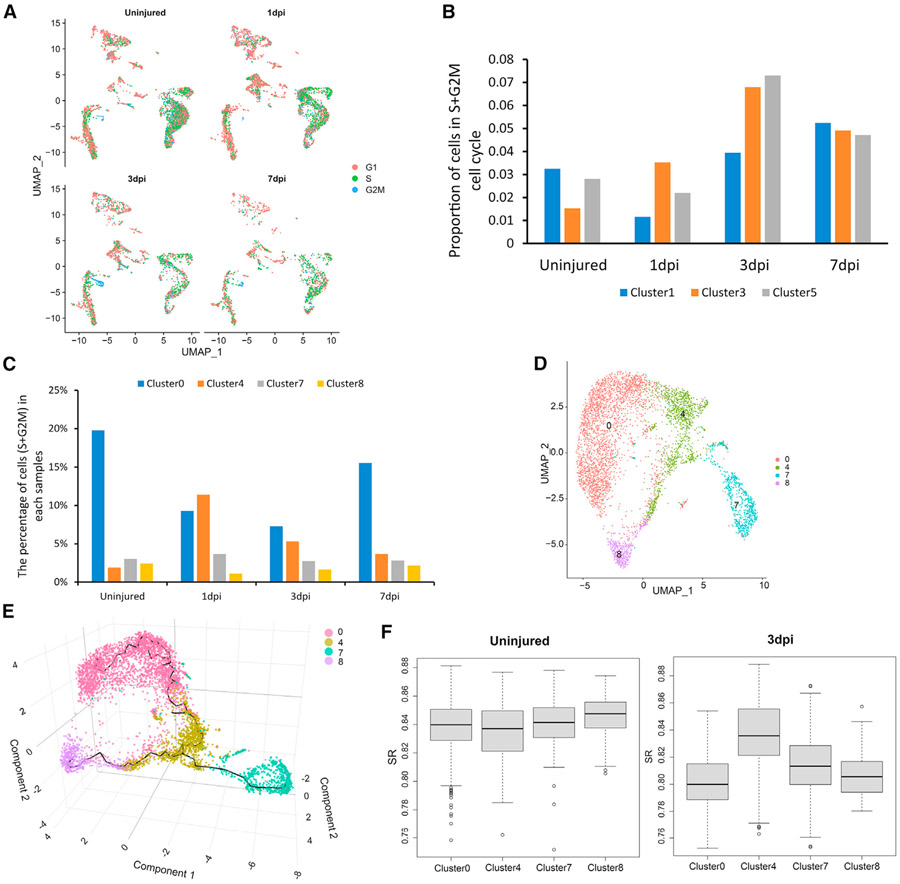
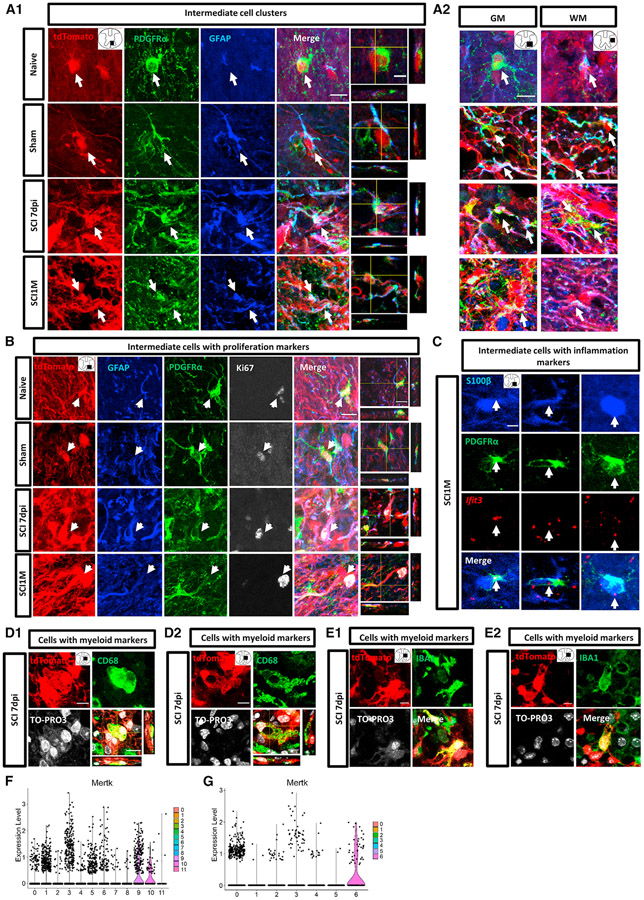
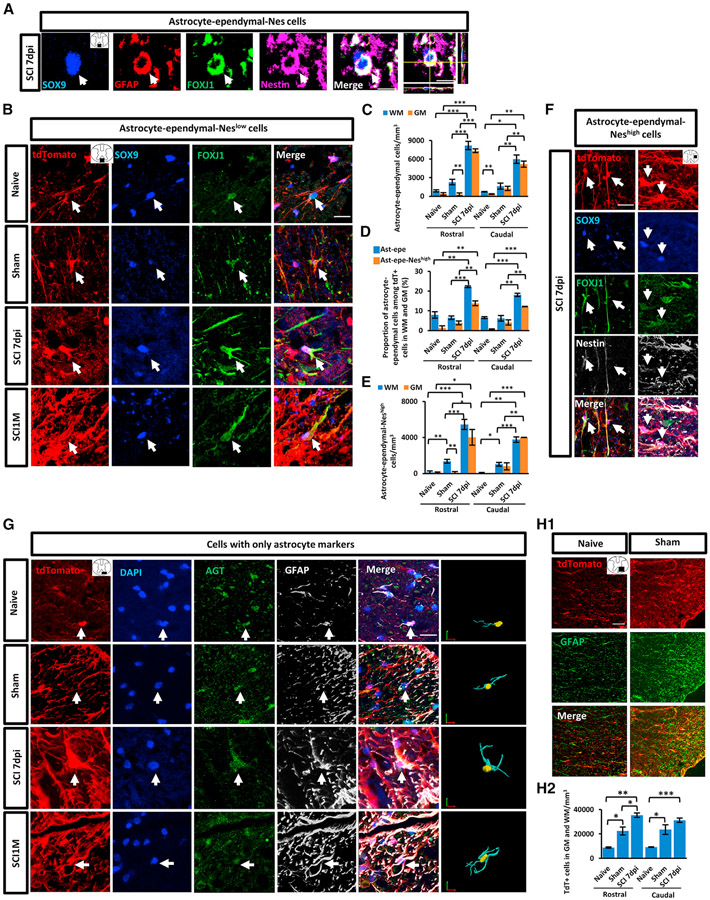
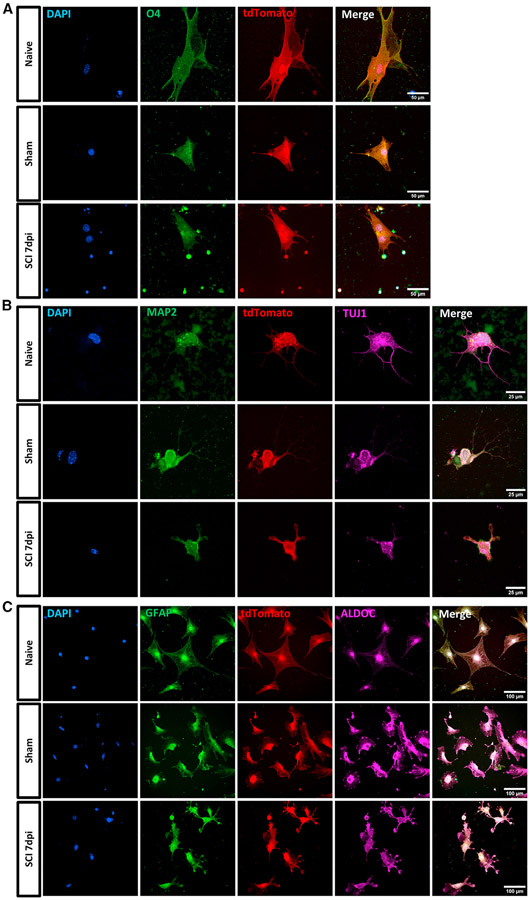
Recent studies have revealed the heterogeneous nature of astrocytes; however, how diverse constituents of astrocyte-lineage cells are regulated in adult spinal cord after injury and contribute to regeneration remains elusive. We perform single-cell RNA sequencing of GFAP-expressing cells from sub-chronic spinal cord injury models and identify and compare with the subpopulations in acute-stage data. We find subpopulations with distinct functional enrichment and their identities defined by subpopulation-specific transcription factors and regulons. Immunohistochemistry, RNAscope experiments, and quantification by stereology verify the molecular signature, location, and morphology of potential resident neural progenitors or neural stem cells in the adult spinal cord before and after injury and uncover the populations of the intermediate cells enriched in neuronal genes that could potentially transition into other subpopulations. This study has expanded the knowledge of the heterogeneity and cell state transition of glial progenitors in adult spinal cord before and after injury.

Keywords: CP: Neuroscience; CP: Stem cell research; GFAP-expressing cells; astrocyte lineage; glial progenitor heterogeneity; key regulators; spinal cord injury.


Conflict of interest statement

Declaration of interests The authors declare no competing interests.

Figures

Figure 1.
Figure 1.. scRNA-seq of GFAP-expressing cells from naive, sham, and SCI1M samples
(A) Scheme of the experimental workflow. (B) UMAP visualization showing clustering of astrocyte-lineage cells. Colors depict different clusters identified. (C) Heatmap representing the gene expression of the top 10 DEGs in each cluster. Gene expression levels are color coded, ranging from dark blue (low expression levels) to red (high expression levels). (D) Dot plot displaying the average expression levels of marker genes identified in each cluster. (E) GSEA depicting p value and normalized enrichment scores (NES) of some examples of significantly enriched functions in cluster 0/1/2/4. (F) Visualization of the RNA-velocity analysis overlaid on the UMAP embedding of GFAP-expressing cells. Colors correspond to clusters identified in each of the three conditions. Arrows represent the velocity vectors (speed and direction) of gene expression changes.
Figure 2.
Figure 2.. GRN of astrocyte-lineage-cell subpopulations predicted subpopulation-specific master regulons
(A) Clustered binary regulon activity matrix depicting subpopulation-specific master regulons. Important regulons are shown for the various subpopulations (right). (B) Representation of area under the curve (AUC) scores of selected key regulons (Sox9/Foxj1/Sox2) in the astrocyte-ependymal cluster. Scores are depicted in the UMAP representation of clusters. The intensity of blue depicts high AUCell scores. (C) Regulon network for the astrocyte-ependymal cluster.
Figure 3.
Figure 3.. The diversity of astrocyte-ependymal cells at acute stages
(A) Phases of the cell cycle based on expression patterns of selected cell-cycle-specific genes, shown on the UMAP embedment (astrocyte-lineage cells). (B and C) Proportion of cells in the S+G2M phase. Barplots represent proportions of cells with astrocyte markers only and intermediate cells (cluster 1/3/5) (B) and astrocyte-ependymal clusters (cluster 0/4/7/8) (C) from acute stage. (D) UMAP representation of astrocyte-ependymal cells obtained from acute stage. (E) Trajectory analysis of astrocyte-ependymal cells by Monocle3 on Seurat object in a 3D UMAP space. Colors represent clusters. (F) SR scores calculated for astrocyte-ependymal cells in uninjured and at 3 dpi. Boxplots show the density distribution of SR values at each subpopulation of astrocyte-ependymal cells.
Figure 4.
Figure 4.. Histological validation of intermediate cell subpopulations and cells with myeloid markers
(A) Intermediate cells (arrows) assessed by the colocalization of tdT, GFAP (blue), and PDGFRα (green) in all the groups. Images were captured (A1) in the ventral column at 600–800 μm from epicenter in sham, 7 dpi, and SCI1M, and (A2) in ventral horn (GM) and lateral column (WM). (B) Intermediate cells with proliferation markers (arrows) identified by the colocalization of tdT (red), GFAP (blue), PDGFRα (green), and proliferative marker Ki67 (white) in ventral horn or ventral column at 600 μm (7 dpi) and 1,000 μm (SCI1M) caudal from epicenter. (C) Combined RNAscope and immunofluorescence of Ifit3 (red), S100b (blue), and PDGFRα (green) expression in intermediate cells with inflammation markers (arrows) in ventral horn at the segment adjacent to the injury site. (D and E) Cells with myeloid marker assessed by CD68 (green, D) or IBA1 (green, E) expression in tdT+ GFAP-expressing cells (red) at lateral horn or lateral column at 7 dpi (D1, at 200 μm rostral from the epicenter; D2, at the epicenter; E1, at 800 μm caudal from the epicenter; E2, at 400 μm caudal from the epicenter). (F and G) The expression pattern of phagocytosis gene Mertk at acute (F) and sub-chronic (G) stages. Scale bar, 10 μm (A, B, D, and E); scale bar (orthogonal views in A, and C), 5 μm.
Figure 5.
Figure 5.. Histological validation of astrocyte-ependymal cell subtypes and cells with only astrocyte markers, and the demonstration of cell activation induced by laminectomy in mouse spinal cord
(A) Astrocyte-ependymal-Nes cells (arrow) co-expressed GFAP+ (red), SOX9+ (blue), FOXJ1+ (green), and Nestin+ (violet) in lateral column from 7 dpi (at 1,200 μm rostral from epicenter) samples. (B) Astrocyte-ependymal-Neslow cells (arrows) co-expressed SOX9 (blue) and FOXJ1 (green) in the ventral column from naive, sham, 7 dpi (at 1,200 μm rostral from epicenter), and SCI1M (at epicenter) samples. (C–E) Histological analysis illustrating the number of astrocyte-ependymal cells (C), the proportion of astrocyte-ependymal and astrocyte-ependymal-Neshigh subpopulations among tdT+ cells (D), and the number of astrocyte-ependymal-Neshigh cells (E) in naive, sham, and 7 dpi groups at 800–1,200 μm rostral and caudal from the epicenter. (F) Astrocyte-ependymal-Neshigh cells (arrows) co-expressed SOX9 (blue), FOXJ1 (green), and NES (white) in the lateral column. (G) Confocal images and 3D reconstruction of the cells with only astrocyte markers (arrows) by staining with DAPI (blue), AGT (green), and GFAP (white) in ventral column from all groups (7 dpi, at epicenter; SCI1M, at 800 μm rostral from epicenter). (H) (H1) GFAP (green) and tdT (red) expression in ventral column from naive and sham groups (at 600 μm rostral from the epicenter). (H2) Histological analysis demonstrated the number of tdT+ cells in naive, sham, and 7 dpi groups at 800–1,200 μm rostral and caudal from the epicenter. N = 3–4 mice per group. Barplots represent mean ± SEM. Independent t tests. *p < 0.05; **p < 0.01, ***p < 0.001 compared with other group; GM, gray matter; WM, white matter; Ast-Epe, astrocyte-ependymal cell; Ast-Epe-Neshigh, astrocyte-ependymal-Neshigh cell. Scale bar, 20 μm.
Figure 6.
Figure 6.. Immunocytochemistry of FACS-sorted tdT+ cells from naive, sham, and 7 dpi mouse spinal cords differentiated under oligodendrocyte, neuron, and astrocyte differentiation conditions
(A–C) tdT+ cells (A) differentiated in the oligodendrocyte differentiation medium were stained with progenitor marker O4 (green) (scale bar, 50 μm); (B) in the neuron differentiation medium were stained with neuron marker TUJ1 (violet) and MAP2 (green) (scale bar, 25 μm); (C) in the astrocyte differentiation medium were stained with astrocyte marker aldolase C (ALDOC) (violet) and GFAP (green) (scale bar, 100 μm).

References

    1. Hachem LD, and Fehlings MG (2021). Pathophysiology of spinal cord injury. Neurosurg. Clin 32, 305–313. 10.1016/j.nec.2021.03.002. - DOI - PubMed
    1. Okada S, Hara M, Kobayakawa K, Matsumoto Y, and Nakashima Y (2018). Astrocyte reactivity and astrogliosis after spinal cord injury. Neurosci. Res 126, 39–43. 10.1016/j.neures.2017.10.004. - DOI - PubMed
    1. Silva NA, Sousa N, Reis RL, and Salgado AJ (2014). From basics to clinical: a comprehensive review on spinal cord injury. Prog. Neurobiol 114, 25–57. 10.1016/j.pneurobio.2013.11.002. - DOI - PubMed
    1. Ding S. (2014). Dynamic reactive astrocytes after focal ischemia. Neural Regen. Res 9, 2048–2052. 10.4103/1673-5374.147929. - DOI - PMC - PubMed
    1. Filous AR, and Silver J (2016). Targeting astrocytes in CNS injury and disease: a translational research approach. Prog. Neurobiol 144, 173–187. 10.1016/j.pneurobio.2016.03.009. - DOI - PMC - PubMed

Publication types