Review
. 2023 Jun 26;381(2249):20220070.
doi: 10.1098/rsta.2022.0070. Epub 2023 May 8.

Finale: impact of the ORCHESTRA/ENCORE programmes on Southern Ocean heat and carbon understanding

Affiliations
Review

Finale: impact of the ORCHESTRA/ENCORE programmes on Southern Ocean heat and carbon understanding

Andrew J S Meijers et al. Philos Trans A Math Phys Eng Sci. .

Abstract

The 5-year Ocean Regulation of Climate by Heat and Carbon Sequestration and Transports (ORCHESTRA) programme and its 1-year extension ENCORE (ENCORE is the National Capability ORCHESTRA Extension) was an approximately 11-million-pound programme involving seven UK research centres that finished in March 2022. The project sought to radically improve our ability to measure, understand and predict the exchange, storage and export of heat and carbon by the Southern Ocean. It achieved this through a series of milestone observational campaigns in combination with model development and analysis. Twelve cruises in the Weddell Sea and South Atlantic were undertaken, along with mooring, glider and profiler deployments and aircraft missions, all contributing to measurements of internal ocean and air-sea heat and carbon fluxes. Numerous forward and adjoint numerical experiments were developed and supported by the analysis of coupled climate models. The programme has resulted in over 100 peer-reviewed publications to date as well as significant impacts on climate assessments and policy and science coordination groups. Here, we summarize the research highlights of the programme and assess the progress achieved by ORCHESTRA/ENCORE and the questions it raises for the future. This article is part of a discussion meeting issue 'Heat and carbon uptake in the Southern Ocean: the state of the art and future priorities'.

Keywords: Southern Ocean; climate; ocean carbon; ocean circulation; ocean heat; ocean–atmosphere fluxes.


Conflict of interest statement

The authors declare that they have no competing interests.

Figures

Figure 1.
Figure 1.
Schematic demonstrating primary regions of O/E fieldwork, overlaid with approximate pathways of the major regional ocean circulation features. Red lines indicate ship hydrographic sections (see electronic supplementary material, table S1), pink shading approximate areas of operation for MASIN flights. Yellow circles indicate the locations of the two major processes studies and red circle the location of the mooring array. WSDW indicates the approximate export pathway of Weddell Sea Deep Water through Orkney Passage. Graphic design by Ralph Percival. (Online version in colour.)
Figure 2.
Figure 2.
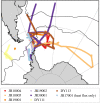
Location of air–sea heat and carbon flux measurements obtained using eddy covariance instrumentation during O/E. Ship tracks labelled by voyage number (see electronic supplementary material, table S1 for details). (Online version in colour.)
Figure 3.
Figure 3.
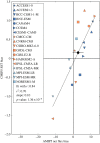
Linear regression of CMIP5 SST historical biases (relative to ERA-interim) onto AMIP5 net flux biases averaged over 40–60°S. The multi-model mean values are plotted with a solid black circle with a cross indicating their estimated observational uncertainties. Reproduced from Hyder et al. [33]. (Online version in colour.)
Figure 4.
Figure 4.
(a) Ship track, aircraft track, WaveGlider track and glider track, coloured by day for the first 8 days of the deployment in 2017. GEBCO bathymetry is contoured in metres, alongside mean sea surface height (in dyn.m) at the time of the coordinated glider/ship/aircraft experiment. (b) Upper 250 m conservative temperature (°C). (c) Comparison of wind speeds observed by ship (U10), WaveGlider (2 m) and ERA5 (U10). (d) Sensible and latent heat fluxes (positive into ocean) from the ship measurements, aircraft and daily ERA5 estimates. Strong positive sensible and latent heat fluxes occur around the time of the high wind event on 2 December. (e) ML shoaling and increase in ML heat content are driven by the strong positive radiative flux, which dominates the surface heat budget (ERA5 daily, ship and air-derived terms shown). (Online version in colour.)
Figure 5.
Figure 5.
Schematic illustrating the main kinematic and dynamic sensitivities up to approximately 5 years lag for mode water formation regions (MWFRs) mixed layer properties in all three basins: Indian (yellow), Pacific (cyan) and Atlantic (pink). Thick black contours show the median location MWFRs and grey contours the −17, 0 and 30 Sv mean barotropic streamlines. Arrows indicate paths of kinematic sensitivities, with thinner lines indicating paths only found at depth and dashed lines showing relatively weaker paths. The circles connected by lines indicate where dynamic sensitivities resemble dipoles, where a change in isopycnal gradient will affect the MWFRs (the exact location of the symbols is not meaningful). Groups of curves indicate where wave-like patterns are found (from Boland et al. [48]). (Online version in colour.)
Figure 6.
Figure 6.
Approximately decadal (2017/2018–2008/2010) difference between O/E hydrographic ‘box’ boundary sections (figure 1) of potential temperature (°C, (a–c)) and DIC (µmol kg−1, (d–f)) for 24°S (a,d), SR1b (b,e) and ANDREX (c,f) sections. Voyages and dates as labelled (see electronic supplementary material, table S1). Previous decade observations detailed in [7,9]. (Online version in colour.)
Figure 7.
Figure 7.
Reduction in WSBW, blue (LWSDW, red) areas on the A23 hydrographic section (see insert) south (north) of the South Scotia Ridge between 1995 and 2021. Shaded areas indicate the uncertainty from instrumentation and varying sampling locations between cruises. Figure adapted and extended from Abrahamsen et al. [13]. (Online version in colour.)
Figure 8.
Figure 8.
Linear trend in sea ice formation rate showing reduction in front of the Ronne Ice Shelf from 1992 to 2020, estimated for austral autumn/winter (April to October), driven by northerly wind trends over the same period (vectors from ERA5). Statistical significance of over 90%, 95% and 99% in sea ice formation rate trend is highlighted with grey, black and magenta contours, respectively. Vectors with over 90% confidence in either zonal or meridional component trend are in black. Reproduced from Zhou et al. [63] (Online version in colour.)
Figure 9.
Figure 9.
Difference (JRA55TAU–JRA55IAF) in September mean equatorward Ekman heat transport between the perturbed wind stress and control model experiments showing asymmetric heat transport across the Southern Ocean basins. Units W per model grid cell. (Online version in colour.)
Figure 10.
Figure 10.
Adjoint model sensitivity to zonal wind stress of the mean temperature of the O/E box (grey box) in °C/(N m−2). The time-average 0.25 m SSH contour (black line) and 300 m mixed layer depth contour (dashed green line) in August highlight the relative positions of the northern ACC edge and mode water pools. The blue and red lines are where zonal wind (stress) anomalies are applied to produce a change in the mean temperature of the O/E box. (Online version in colour.)
Figure 11.
Figure 11.
Time series of temperature as an anomaly from the relevant control. Heavy lines: NEMO 1/12° as an anomaly from JRA55IAF. Medium lines: ECCOv4r3 forward runs as an anomaly from the standard ECCOv4r3 forward run. Light lines: convolution of ECCOv4r3 adjoint sensitivities with the wind stress anomalies used for the forward perturbation experiments as a function of lag. Lag is measured from the end of the adjoint run. This time series has been inverted to provide a better visual comparison. (Online version in colour.)
Figure 12.
Figure 12.
Density (σ2, kgm−3) biases after 20 years of model integration along a meridional section at 180°W, through the Ross Sea. Left (right) panel shows biases in the ZPS (σ-z) simulation. (Online version in colour.)

References

    1. Levitus S et al. 2012. World ocean heat content and thermosteric sea level change (0–2000m), 1955–2010. Geophys. Res. Lett. 39, 1-5. ( 10.1029/2012GL051106) - DOI
    1. Rathore S, Bindoff NL, Phillips HE, Feng M. 2020. Recent hemispheric asymmetry in global ocean warming induced by climate change and internal variability. Nat. Commun. 11, 2008. ( 10.1038/s41467-020-15754-3) - DOI - PMC - PubMed
    1. Intergovernmental Panel on Climate Change (ed.). 2014. Observations: ocean pages. In Climate change 2013 – the physical science basis, pp. 255-316, 1st ed. Cambridge, UK: Cambridge University Press. See https://www.cambridge.org/core/product/identifier/CBO9781107415324A018/t... [cited 17 Aug 2022].
    1. Khatiwala S et al. 2013. Global ocean storage of anthropogenic carbon. Biogeosciences 10, 2169-2191. ( 10.5194/bg-10-2169-2013) - DOI
    1. Frölicher TL, Sarmiento JL, Paynter DJ, Dunne JP, Krasting JP, Winton M. 2015. Dominance of the Southern Ocean in anthropogenic carbon and heat uptake in CMIP5 models. J. Clim. 28, 862-886. ( 10.1175/JCLI-D-14-00117.1) - DOI

LinkOut - more resources