. 2023 Apr 17;8(17):14965-14984.
doi: 10.1021/acsomega.2c07546. eCollection 2023 May 2.

Photocatalytic Degradation of Methylene Blue Using N-Doped ZnO/Carbon Dot (N-ZnO/CD) Nanocomposites Derived from Organic Soybean

Affiliations

Photocatalytic Degradation of Methylene Blue Using N-Doped ZnO/Carbon Dot (N-ZnO/CD) Nanocomposites Derived from Organic Soybean

Dinda Gusti Ayu et al. ACS Omega. .

Abstract

This study reports on successful synthesis of carbon dots (CDs), nitrogen-doped zinc oxide (N-ZnO), and N-ZnO/CD nanocomposites as photocatalysts for degradation of methylene blue. The first part was the synthesis of CDs utilizing a precursor from soybean and ethylenediamine as a dopant by a hydrothermal method. The second part was the synthesis of N-ZnO with urea as the nitrogen dopant carried out by a calcination method in a furnace at 500 °C for 2 h in an N2 atmosphere (5 °C min-1). The third part was the synthesis of N-ZnO/CD nanocomposites. The characteristics of CDs, N-ZnO, and N-ZnO/CD nanocomposites were analyzed through Fourier transform infrared (FTIR), UV-vis absorbance, photoluminescence (PL), high-resolution transmission electron microscopy (HR-TEM), X-ray diffraction (XRD), thermal gravimetry analysis (TGA), field-emission scanning electron microscopy energy-dispersive spectroscopy (FESEM EDS), X-ray photoelectron spectroscopy (XPS), and Brunauer-Emmett-Teller (BET) analysis. Based on the HR-TEM analysis, the CDs had a spherical shape with an average particle size of 4.249 nm. Meanwhile, based on the XRD and HR-TEM characterization, the N-ZnO and N-ZnO/CD nanocomposites have wurtzite hexagonal structures. The materials of N-ZnO and N-ZnO/CD show increased adsorption in the visible light region and low energy gap E g. The E g values of N-ZnO and N-ZnO/CDs were found to be 2.95 and 2.81 eV, respectively, whereas the surface area (S BET) values 3.827 m2 g-1 (N-ZnO) and 3.757 m2 g-1(N-ZnO/CDs) belonged to the microporous structure. In the last part, the photocatalysts of CDs, N-ZnO, and N-ZnO/CD nanocomposites were used for degradation of MB (10 ppm) under UV-B light irradiation pH = 7.04 (neutral) for 60 min at room temperature. The N-ZnO/CD nanocomposites showed a photodegradation efficiency of 83.4% with a kinetic rate of 0.0299 min-1 higher than N-ZnO and CDs. The XRD analysis and FESEM EDS of the N-ZnO/CDs before and after three cycles confirm the stability of the photocatalyst with an MB degradation of 58.2%. These results have clearly shown that the N-ZnO/CD nanocomposites could be used as an ideal photocatalytic material for the decolorization of organic compounds in wastewater.


Conflict of interest statement

The authors declare no competing financial interest.

Figures

Figure 1
Figure 1
Schematic of the preparation of the photocatalyst material of CDs (a), N-ZnO nanoparticles (b), and N-ZnO/CD nanocomposites (c).
Figure 2
Figure 2
Analysis result characteristic of CDs, FTIR (a), UV–vis (b) (photograph of fluorescent CDs under UV lamp 365 nm, courtesy of Dinda Gusti Ayu. Copyright 2022), energy gap (c), quantum yield vs emission (d), photoluminescence (e), and XRD (f).
Figure 3
Figure 3
TEM images of CDs 15%EDA (a), HR-TEM images (b), lattice distance (c), and particle size distribution (d).
Figure 4
Figure 4
XPS spectrum of CDs 15% EDA (a), XPS high-resolution spectra of C 1s (b), O 1s (c), and N 1s (d), and summary of atomic concentration of each element (e).
Figure 5
Figure 5
TGA spectrum of N-ZnO.
Figure 6
Figure 6
XRD patterns of ZnO, N-ZnO, and N-ZnO/CDs (a), XRD patterns of the samples in the 2θ value range of 15–30° (b), and XRD patterns of the samples peak (101) ZnO in the 2θ range = 35–37° (c).
Figure 7
Figure 7
Analysis result characteristic of ZnO, N-ZnO, and N-ZnO/CDs. FTIR (a), UV–vis (b) (photograph fluorescents ZnO, N-ZnO, and N-ZnO/CD nanocomposites under UV lamp 365 nm courtesy of Dinda Gusti Ayu. Copyright 2022), photoluminescence (c), energy gap (d–f).
Figure 8
Figure 8
Bandgap structure of ZnO, N-ZnO, and N-ZnO/CD nanocomposites.
Figure 9
Figure 9
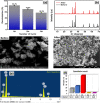
FESEM images of N-ZnO (inset (a) particle size distribution graph) (a, b), N-ZnO/CDs nanocomposite (inset (c) particle size distribution graph) (c, d), EDS spectrum of N-ZnO/CDs and quantitative result of presented elements in the N-ZnO/CDs nanocomposite (e, f).
Figure 10
Figure 10
HR-TEM images of N-ZnO (inset (b, c) lattice distance and pore size graph) (a–c), and N-ZnO/CD nanocomposites and (inset (e)) values of lattice distance (d, e).
Figure 11
Figure 11
XPS full survey of N-ZnO (a), high-resolution XPS spectrum of Zn 2p (b), C 1s (c), O 1s (d), and N 1s (e), and summary of atomic concentration of each element (f).
Figure 12
Figure 12
XPS full survey of N-ZnO/CDs (a), high-resolution XPS spectrum of Zn 2p (b), C 1s (c), O 1s (d), N 1s (e), and summary of atomic concentration of each element (f).
Figure 13
Figure 13
BET plot of the surface area of N-ZnO and N-ZnO/CD nanocomposites with the N2 adsorption–desorption isotherm (inset specific desorption of the samples) (a), BET plot of distribution pore size of samples (b), and BJH plot of specific distribution pore size of N-ZnO and N-ZnO/CD nanocomposites (c, d).
Figure 14
Figure 14
Decolorization percentage of MB (a) (photograph of decolorization of MB with different photocatalyst, courtesy of Dinda Gusti Ayu. Copyright 2022), absorbance peak of MB centered at 670 nm and MB concentration before and after irradiation with different photocatalyst (b, c), decolorization kinetics according to pseudo-first-order kinetics for different photocatalysts (d).
Figure 15
Figure 15
Mechanism of the charge electrons transfer in the photocatalytic degradation of N-ZnO/CD nanocomposites.
Figure 16
Figure 16
Electrical energy consumption values (kWh min–3 order–1) and reaction rate constant (min–1) (a) and the photocatalytic activity of N-ZnO/CDs photocatalyst at pH 3, 7, and 11 (b).
Figure 17
Figure 17
Photostability graph for decolorization of MB at tree cycling runs over N-ZnO/CD nanocomposites (a), XRD diffractogram, FESEM images, EDX analysis and quantitative result element weight percent of N-ZnO/CD nanocomposites before and after tree cycling of the photolysis experiments (b–f).

References

    1. Bandekar G.; Rajurkar N. S.; Mulla I. S.; Mulik U. P.; Amalnerkar D. P.; Adhyapak P. V. Synthesis, Characterization and Photocatalytic Activity of PVP Stabilized ZnO and Modified ZnO Nanostructures. Appl. Nanosci. 2014, 4, 199.10.1007/s13204-012-0189-2. - DOI
    1. Shao Y.; Wang X.; Kang Y.; Shu Y.; Sun Q.; Li L. Application of Mn/MCM-41 as an Adsorbent to Remove Methyl Blue from Aqueous Solution. J. Colloid Interface Sci. 2014, 429, 25.10.1016/j.jcis.2014.05.004. - DOI - PubMed
    1. Phillips K. A.; Yau A.; Favela K. A.; Isaacs K. K.; McEachran A.; Grulke C.; Richard A. M.; Williams A. J.; Sobus J. R.; Thomas R. S.; Wambaugh J. F. Suspect Screening Analysis of Chemicals in Consumer Products. Environ. Sci. Technol. 2018, 52, 3125–3135. 10.1021/acs.est.7b04781. - DOI - PMC - PubMed
    1. Iqbal M. Vicia Faba Bioassay for Environmental Toxicity Monitoring: A Review. Chemosphere 2016, 144, 785.10.1016/j.chemosphere.2015.09.048. - DOI - PubMed
    1. Senthil Kumar M.; Arunagiri C. Efficient Photocatalytic Degradation of Organic Dyes Using Fe-Doped ZnO Nanoparticles. J. Mater. Sci.: Mater. Electron. 2021, 32, 17925–17935. 10.1007/s10854-021-06328-0. - DOI