Genomic analysis of the population structure of Paenibacillus larvae in New Zealand
- PMID: 37152741
- PMCID: PMC10157257
- DOI: 10.3389/fmicb.2023.1161926
Genomic analysis of the population structure of Paenibacillus larvae in New Zealand
Abstract
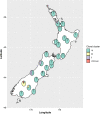
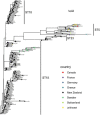
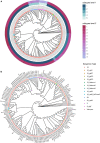
New Zealand is a remote country in the South Pacific Ocean. The isolation and relatively late arrival of humans into New Zealand has meant there is a recorded history of the introduction of domestic species. Honey bees (Apis mellifera) were introduced to New Zealand in 1839, and the disease American foulbrood was subsequently found in the 1870s. Paenibacillus larvae, the causative agent of American foulbrood, has been genome sequenced in other countries. We sequenced the genomes of P. larvae obtained from 164 New Zealand apiaries where American foulbrood was identified in symptomatic hives during visual inspection. Multi-locus sequencing typing (MLST) revealed the dominant sequence type to be ST18, with this clonal cluster accounting for 90.2% of isolates. Only two other sequence types (with variants) were identified, ST5 and ST23. ST23 was only observed in the Otago area, whereas ST5 was limited to two geographically non-contiguous areas. The sequence types are all from the enterobacterial repetitive intergenic consensus I (ERIC I) genogroup. The ST18 and ST5 from New Zealand and international P. larvae all clustered by sequence type. Based on core genome MLST and SNP analysis, localized regional clusters were observed within New Zealand, but some closely related genomes were also geographically dispersed, presumably due to hive movements by beekeepers.
Keywords: American foulbrood (AFB); genome; honey bee (Apis mellifera L.); multilocus sequence typing (MLST); sequencing.
Copyright © 2023 Binney, Pragert, Foxwell, Gias, Birrell, Phiri, Quinn, Taylor, Ha and Hall.
Conflict of interest statement
The authors declare that the research was conducted in the absence of any commercial or financial relationships that could be construed as a potential conflict of interest.
Figures


References
-
- Andrews S. (2010). FastQC: A Quality Control Tool for High Throughput Sequence Data [Online]. England: The Babraham Institute.
-
- Beims H., Bunk B., Erler S., Mohr K., Sproer C., Pradella S., et al. (2020). Discovery of Paenibacillus larvae ERIC V: Phenotypic and genomic comparison to genotypes ERIC I-IV reveal different inventories of virulence factors which correlate with epidemiological prevalences of American Foulbrood. Int. J. Med. Microbiol. 310:151394. 10.1016/j.ijmm.2020.151394 - DOI - PubMed
LinkOut - more resources
Full Text Sources
Molecular Biology Databases

