

Field scale biodegradation of total petroleum hydrocarbons and soil restoration by Ecopiles: microbiological analysis of the process
- PMID: 37152743
- PMCID: PMC10160625
- DOI: 10.3389/fmicb.2023.1158130
Field scale biodegradation of total petroleum hydrocarbons and soil restoration by Ecopiles: microbiological analysis of the process
Abstract
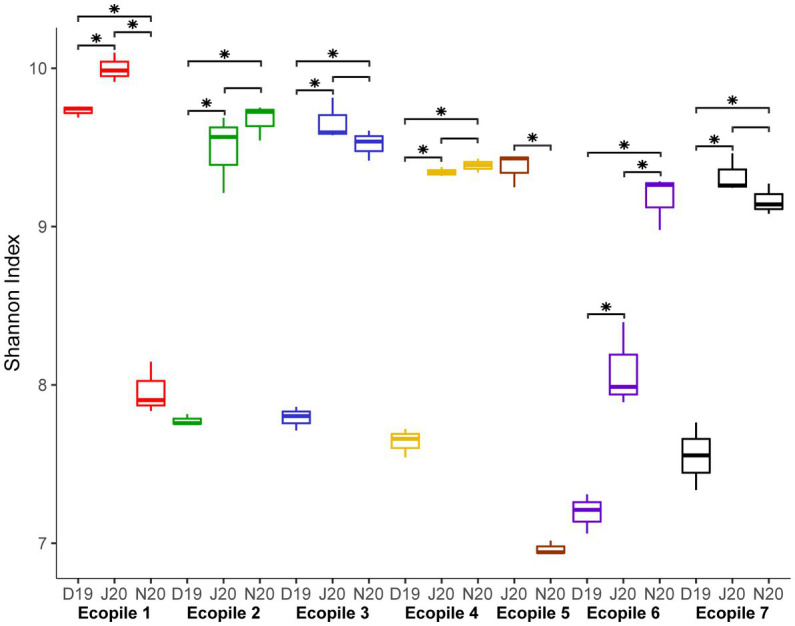
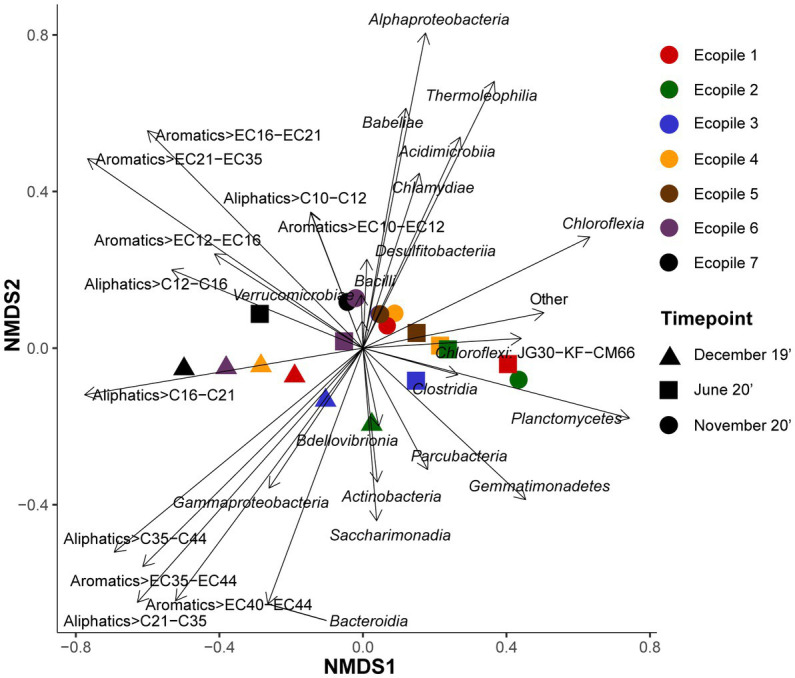
Ecopiling is a method for biodegradation of hydrocarbons in soils. It derives from Biopiles, but phytoremediation is added to biostimulation with nitrogen fertilization and bioaugmentation with local bacteria. We have constructed seven Ecopiles with soil heavily polluted with hydrocarbons in Carlow (Ireland). The aim of the study was to analyze changes in the microbial community during ecopiling. In the course of 18 months of remediation, total petroleum hydrocarbons values decreased in 99 and 88% on average for aliphatics and aromatics, respectively, indicating a successful biodegradation. Community analysis showed that bacterial alfa diversity (Shannon Index), increased with the degradation of hydrocarbons, starting at an average value of 7.59 and ending at an average value of 9.38. Beta-diversity analysis, was performed using Bray-Curtis distances and PCoA ordination, where the two first principal components (PCs) explain the 17 and 14% of the observed variance, respectively. The results show that samples tend to cluster by sampling time instead of by Ecopile. This pattern is supported by the hierarchical clustering analysis, where most samples from the same timepoint clustered together. We used DSeq2 to determine the differential abundance of bacterial populations in Ecopiles at the beginning and the end of the treatment. While TPHs degraders are more abundant at the start of the experiment, these populations are substituted by bacterial populations typical of clean soils by the end of the biodegradation process. Similar results are found for the fungal community, indicating that the microbial community follows a succession along the process. This succession starts with a TPH degraders or tolerant enriched community, and finish with a microbial community typical of clean soils.
Keywords: Ecopile; bioremediation; hydrocarbon; microbial succession; microbiota.
Copyright © 2023 Martínez-Cuesta, Conlon, Wang, Blanco-Romero, Durán, Redondo-Nieto, Dowling, Garrido-Sanz, Martin, Germaine and Rivilla.
Conflict of interest statement
The authors declare that the research was conducted in the absence of any commercial or financial relationships that could be construed as a potential conflict of interest.
Figures


Similar articles
-
Ecopiling: a combined phytoremediation and passive biopiling system for remediating hydrocarbon impacted soils at field scale.Front Plant Sci. 2015 Jan 5;5:756. doi: 10.3389/fpls.2014.00756. eCollection 2014. Front Plant Sci. 2015. PMID: 25601875 Free PMC article.
-
Effect of bioaugmentation and biostimulation on hydrocarbon degradation and microbial community composition in petroleum-contaminated loessal soil.Chemosphere. 2019 Dec;237:124456. doi: 10.1016/j.chemosphere.2019.124456. Epub 2019 Jul 26. Chemosphere. 2019. PMID: 31376701
-
Impacts of Arctic diesel contamination on microbial community composition and degradative gene abundance during hydrocarbon biodegradation with and without nutrients: A case study of seven sub-Arctic soils.Sci Total Environ. 2023 May 1;871:161777. doi: 10.1016/j.scitotenv.2023.161777. Epub 2023 Jan 26. Sci Total Environ. 2023. PMID: 36709895
-
Aerobic composting remediation of petroleum hydrocarbon-contaminated soil. Current and future perspectives.Sci Total Environ. 2021 Jan 20;753:142250. doi: 10.1016/j.scitotenv.2020.142250. Epub 2020 Sep 7. Sci Total Environ. 2021. PMID: 33207468 Review.
-
The co-application of biochar with bioremediation for the removal of petroleum hydrocarbons from contaminated soil.Sci Total Environ. 2022 Nov 25;849:157753. doi: 10.1016/j.scitotenv.2022.157753. Epub 2022 Aug 2. Sci Total Environ. 2022. PMID: 35931161 Review.
Cited by
-
Metagenomic analyses of a consortium for the bioremediation of hydrocarbons polluted soils.AMB Express. 2024 Sep 28;14(1):105. doi: 10.1186/s13568-024-01764-7. AMB Express. 2024. PMID: 39341984 Free PMC article.
-
Bioaugmentation and vermicompost facilitated the hydrocarbon bioremediation: scaling up from lab to field for petroleum-contaminated soils.Environ Sci Pollut Res Int. 2025 Jun;32(28):16601-16616. doi: 10.1007/s11356-024-32916-8. Epub 2024 Mar 22. Environ Sci Pollut Res Int. 2025. PMID: 38517632 Free PMC article.
-
Mitigation strategies for gastrointestinal (GI) immune-related adverse events for patients with solid tumors receiving immunotherapy.Immunotherapy. 2025 Jun;17(8):595-603. doi: 10.1080/1750743X.2025.2516995. Epub 2025 Jun 6. Immunotherapy. 2025. PMID: 40478172 Review.
-
Assessing Microbial Activity and Rhizoremediation in Hydrocarbon and Heavy Metal-Impacted Soil.Microorganisms. 2025 Apr 8;13(4):848. doi: 10.3390/microorganisms13040848. Microorganisms. 2025. PMID: 40284684 Free PMC article.
References
-
- Abdel-Shafy H. I., Mansour M. S. M. (2016). A review on polycyclic aromatic hydrocarbons: source, environmental impact, effect on human health and remediation. Egypt. J. Pet. 25, 107–123. doi: 10.1016/j.ejpe.2015.03.011 - DOI
-
- Beals E. W. (1984). Bray-Curtis ordination: an effective strategy for analysis of multivariate ecological data. Adv. Ecol. Res. 14, 1–55. doi: 10.1016/S0065-2504(08)60168-3 - DOI
-
- Bisanz J. E. (2018). qiime2R: Importing QIIME2 artifacts and associated data into R sessions. Version 0.99, 13.
LinkOut - more resources
Full Text Sources