. 2023 Apr 9;13(7):2210-2225.
doi: 10.7150/thno.81192. eCollection 2023.

A novel NEDD4L-TXNIP-CHOP axis in the pathogenesis of nonalcoholic steatohepatitis

Affiliations

A novel NEDD4L-TXNIP-CHOP axis in the pathogenesis of nonalcoholic steatohepatitis

Qian Guo et al. Theranostics. .

Abstract

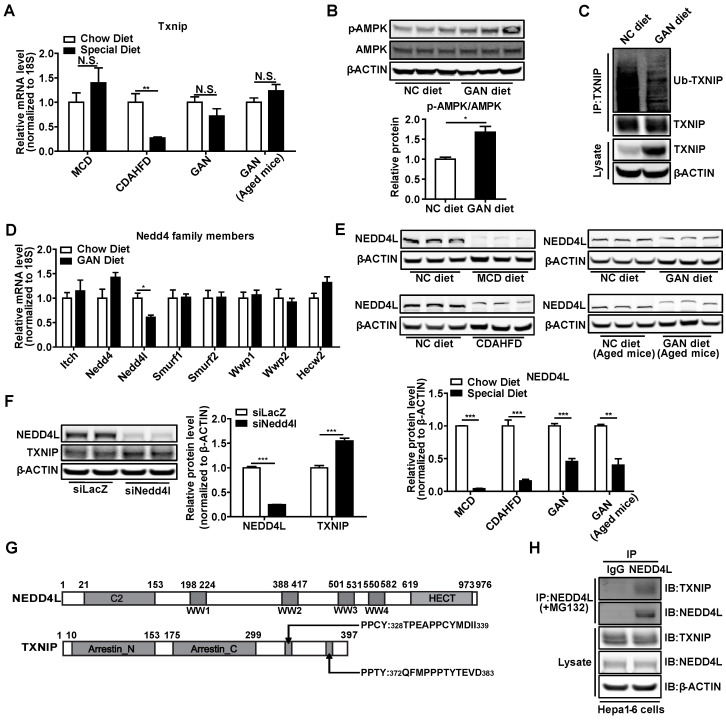
Background: Nonalcoholic steatohepatitis (NASH) is a leading cause of chronic liver diseases worldwide. There is a pressing clinical need to identify potential therapeutic targets for NASH treatment. Thioredoxin interacting protein (Txnip) is a stress responsive gene that has been implicated in the pathogenesis of NASH, but its exact role is not fully understood. Here, we investigated the liver- and gene-specific role of Txnip and its upstream/downstream signaling in the pathogenesis of NASH. Methods and Results: Using four independent NASH mouse models, we found that TXNIP protein abnormally accumulated in NASH mouse livers. A decrease in E3 ubiquitin ligase NEDD4L resulted in impaired TXNIP ubiquitination and its accumulation in the liver. TXNIP protein levels were positively correlated with that of CHOP, a major regulator of ER stress-mediated apoptosis, in NASH mouse liver. Moreover, gain- and loss-of-function studies showed that TXNIP increased protein not mRNA levels of Chop both in vitro and in vivo. Mechanistically, the C-terminus of TXNIP associated with the N-terminus of the α-helix domain of CHOP and decreased CHOP ubiquitination, thus increasing the stability of CHOP protein. Lastly, selective knockdown of Txnip by adenovirus-mediated shRNA (not targets Txnip antisense lncRNA) delivery in the livers of both young and aged NASH mice suppressed the expression of CHOP and its downstream apoptotic pathway, and ameliorated NASH by reducing hepatic apoptosis, inflammation, and fibrosis. Conclusions: Our study revealed a pathogenic role of hepatic TXNIP in NASH and identified a novel NEDD4L-TXNIP-CHOP axis in the pathogenesis of NASH.

Keywords: CHOP; E3 ligase; NASH; TXNIP; Ubiquitination.


Conflict of interest statement

Competing Interests: The authors have declared that no competing interest exists.

Figures

Figure 1
Figure 1
TXNIP and CHOP proteins accumulate in NASH mouse livers. (A-C) Schematic diagram of NASH mouse model establishment (Left). Western blot analysis of TXNIP and CHOP in the livers of different NASH mouse models (middle) and its quantification results (right): MCD (4 weeks feeding) NASH mouse model (A), CDAHFD (12 weeks feeding) NASH mouse model (B), GAN (16 weeks feeding) NASH mouse model (C). n = 5. NC, normal chow. Data shown as mean ± SEM (*P < 0.05, **P < 0.01).
Figure 2
Figure 2
Hepatic TXNIP and CHOP proteins accumulate in a novel age-associated NASH mouse model. (A) Schematic diagram of age-associated NASH mouse model establishment (9 weeks or 1-year-old male C57BL/6J mice fed GAN diet for 4 weeks). (B-J) Biochemical analysis of age-associated NASH mouse model. (K) H&E staining, terminal deoxynucleotidyl transferase-mediated dUTP nick end-labeling (TUNEL) staining, immunohistochemical staining for F4/80, and Sirius Red staining of representative liver sections. Scale bar: 200 µm. Red arrows indicate TUNEL-positive cells (in TUNEL staining image) or crown-like structures (in F4/80 staining image) or positive area (in Sirius Red staining image). The quantification results were shown on the right. (L) RT-PCR analysis of inflammation and fibrosis genes in livers of age-associated NASH mouse model. (M) Western blot analysis of TXNIP and CHOP in the liver of age-associated NASH mouse model and its quantification results (right). Data shown as mean ± SEM (n = 4-5. *P < 0.05, **P < 0.01, ***P < 0.001, #P < 0.05, ##P < 0.01, ###P < 0.001, each group compared to the young mice NC group or as indicated).
Figure 3
Figure 3
NASH leads to the accumulation of TXNIP through impaired ubiquitination. (A) RT-PCR analysis of Txnip mRNA levels in the livers of different NASH mouse models. (n = 5). (B) Western blot and quantification analysis of p-AMPK in GAN-NASH mouse model. (C) Ubiquitin-TXNIP (Ub-TXNIP) was determined by immunoprecipitation (IP) of TXNIP with a subsequent Western blot assay with an anti-Ubiquitin antibody in the liver of the GAN-NASH mouse model. (D) RT-PCR analysis of Nedd4 family members mRNA levels in the liver of GAN-NASH mouse model. (n = 5). (E) Western blot and quantification analysis of NEDD4L in NASH models. (F) Western blot and quantification analysis of TXNIP and NEDD4L in Hepa1-6 cells transfected with siLacZ or siNedd4l for 48 hours. (G) Schematic representation of NEDD4L having 4 WW domains (upper panel) and TXNIP having PPXY motifs (lower panel). (H) Physical interaction between TXNIP and NEDD4L. Hepa1-6 cells were transfected to overexpress Txnip for 24 hours and then incubated with 5 μM MG132 for 4 hours. Equal amounts of Hepa1-6 cell lysates were immunoprecipitated with negative control IgG and NEDD4L antibodies and immunoblotted with the indicated antibodies. Data shown as mean ± SEM (*P < 0.05, **P < 0.01, ***P < 0.001, N.S., not significant).
Figure 4
Figure 4
TXNIP regulates CHOP protein accumulation both in vitro and in vivo. (A-B) RT-PCR (n = 4) and Western Blot analysis of Txnip and Chop in Hepa1-6 and AML12 cells exposed to 0.5 μg/mL Tunicamycin (TM) for 6 hours after transfection with Txnip siRNA or control siRNA for 24 hours. (C-D) RT-PCR (n = 4) and Western Blot analysis of Txnip and Chop in Hepa1-6 and AML12 cells exposed to 0.5 μg /mL Tunicamycin (TM) for 6 hours after transfection with Txnip overexpression vector or control vector for 24 hours. (E and F) RT-PCR (n = 5) and Western Blot analysis of Txnip and Chop in the livers of Txnip liver-specific knockdown mice. (G and H) RT-PCR (n = 5) and Western Blot analysis of Txnip and Chop in the livers of Txnip liver-specific overexpression mice. Data shown as mean ± SEM (*P < 0.05, **P < 0.01, ***P < 0.001, N.S., not significant).
Figure 5
Figure 5
TXNIP inhibits ubiquitin-proteasome degradation of CHOP. (A) Representative western blot image of CHOP protein levels (left) and quantification of CHOP band intensities (right) after Txnip knockdown in presence or absence of proteasome inhibitor MG132 in Hepa1-6 cells under Tunicamycin treatment. (B) Representative western blot image of CHOP protein levels (left) and quantification of CHOP band intensities (right) in the control and Txnip knockdown Hepa1-6 cells in the presence of CHX for the indicated periods under Tunicamycin treatment. (C and D) Ubiquitin-CHOP (Ub-CHOP) was determined by immunoprecipitation (IP) of CHOP followed by western blot in Txnip knockdown (C) or overexpression (D) condition. Data shown as mean ± SEM (*P < 0.05, **P < 0.01).
Figure 6
Figure 6
TXNIP physically binds to CHOP in vitro and in vivo. (A) TXNIP colocalized with CHOP. After Hepa1-6 cells were transiently transfected with Txnip and Chop overexpression vectors for 24 h, the cells were then incubated with 5μM MG132 for 4 hours, followed by an immunofluorescence experiment. Scale bars: 10 µm. (B) Physical interaction of TXNIP and CHOP. Same as in (A) but equal amounts of Hepa1-6 cell lysates were immunoprecipitated with negative control IgG or CHOP antibodies followed by western blot. (C) Schematic representation of WT TXNIP and its C/N-terminal truncations (upper panel), WT CHOP and its ΔN36 (α-helix domain deletion) truncation (lower panel). (D) The α-helix domain of CHOP is critical for TXNIP binding. Hepa1-6 cells were transfected with the WT TXNIP and CHOP ΔN36 truncation construct. Cell lysates were immunoprecipitated with CHOP antibody, followed by western blot with anti-TXNIP or anti-CHOP antibody. (E) The C-terminal end of TXNIP binds to CHOP. Hepa1-6 cells were transfected with the WT CHOP and TXNIP N-terminus or C-terminus constructs. Cell lysates were immunoprecipitated with CHOP antibody, and immunoblotted with anti-V5 (anti-TXNIP) or anti-CHOP antibody. (F) Immunoprecipitation analysis of interaction between the TXNIP and CHOP in GAN diet NASH mouse liver.
Figure 7
Figure 7
Deficiency of Txnip attenuates NASH symptoms in MCD-NASH mice liver. (A) Schematic diagram of experimental design in MCD-NASH model: 10 weeks old mice were fed with an MCD diet for 5 weeks. After 2 weeks of MCD diet feeding, mice were injected with shLacZ or shTxnip adenovirus along with continuous MCD diet feeding. (B) RT-PCR analysis of Txnip, Chop, and Gm15441 levels in the indicated mice liver (n = 5-7). (C) Western blot analysis of TXNIP and CHOP levels as well as CHOP downstream targets in the indicated mouse livers. (D) H&E staining, terminal deoxynucleotidyl transferase-mediated dUTP nick end-labeling (TUNEL) staining, immunohistochemical staining for F4/80, and Sirius Red staining of the liver section. Scale bar: 200 µm. Red arrows indicate TUNEL-positive cells (in TUNEL staining image) or crown-like structures (in F4/80 staining image) or positive area (in Sirius Red staining image). (E) Quantification of various staining in (D) (n = 4). (F) Liver TG level in each group (n = 5-7). Data shown as mean ± SEM (*P < 0.05, **P < 0.01, ***P < 0.001 versus control group).
Figure 8
Figure 8
Deficiency of Txnip attenuates NASH symptoms in age-associated NASH mice liver. (A) Schematic diagram of experimental design in age-associated NASH model: one-year-old mice were fed with GAN diet for 7 weeks. After 4 weeks of GAN diet feeding, mice were injected with shLacZ or shTxnip adenovirus along with continuous GAN diet feeding. (B) RT-PCR analysis of Txnip, Chop, and Gm15441 levels in the indicated mice liver (n = 5). (C) Western blot analysis of TXNIP and CHOP levels as well as CHOP downstream targets in the indicated mouse livers. (D) H&E staining, terminal deoxynucleotidyl transferase-mediated dUTP nick end-labeling (TUNEL) staining, immunohistochemical staining for F4/80, and Sirius Red staining of the liver section. Scale bar: 200 µm. Red arrows indicate TUNEL-positive cells (in TUNEL staining image) or crown-like structures (in F4/80 staining image) or positive area (in Sirius Red staining image). (E) Quantification of various staining in (D) (n = 4). (F) Liver TG level in each group (n = 5). (G) A schematic overview of the role of NEDD4L-TXNIP-CHOP axis during NASH development. In the context of NASH, deficiency of E3 ligase NEDD4L leads to TXNIP protein accumulation, which in turn binds to and promotes CHOP protein accumulation and activates apoptotic pathway. Data shown as mean ± SEM (*P < 0.05, **P < 0.01, ***P < 0.001 versus control group, N.S., not significant).

References

    1. Greenfield V, Cheung O, Sanyal AJ. Recent advances in nonalcholic fatty liver disease. Curr Opin Gastroenterol. 2008;24:320–7. - PubMed
    1. Wree A, Broderick L, Canbay A, Hoffman HM, Feldstein AE. From NAFLD to NASH to cirrhosis-new insights into disease mechanisms. Nat Rev Gastroenterol Hepatol. 2013;10:627–36. - PubMed
    1. Wong RJ, Cheung R, Ahmed A. Nonalcoholic steatohepatitis is the most rapidly growing indication for liver transplantation in patients with hepatocellular carcinoma in the U.S. Hepatology. 2014;59:2188–95. - PubMed
    1. Cusi K. Role of obesity and lipotoxicity in the development of nonalcoholic steatohepatitis: pathophysiology and clinical implications. Gastroenterology. 2012;142:711–25. e6. - PubMed
    1. Tiniakos DG, Vos MB, Brunt EM. Nonalcoholic fatty liver disease: pathology and pathogenesis. Annu Rev Pathol. 2010;5:145–71. - PubMed

Publication types