. 2023 May 2;7(5):e881.
doi: 10.1097/HS9.0000000000000881. eCollection 2023 May.

NK Cell Phenotype Is Associated With Response and Resistance to Daratumumab in Relapsed/Refractory Multiple Myeloma

Affiliations

NK Cell Phenotype Is Associated With Response and Resistance to Daratumumab in Relapsed/Refractory Multiple Myeloma

Christie P M Verkleij et al. Hemasphere. .

Abstract

The CD38-targeting antibody daratumumab has marked activity in multiple myeloma (MM). Natural killer (NK) cells play an important role during daratumumab therapy by mediating antibody-dependent cellular cytotoxicity via their FcγRIII receptor (CD16), but they are also rapidly decreased following initiation of daratumumab treatment. We characterized the NK cell phenotype at baseline and during daratumumab monotherapy by flow cytometry and cytometry by time of flight to assess its impact on response and development of resistance (DARA-ATRA study; NCT02751255). At baseline, nonresponding patients had a significantly lower proportion of CD16+ and granzyme B+ NK cells, and higher frequency of TIM-3+ and HLA-DR+ NK cells, consistent with a more activated/exhausted phenotype. These NK cell characteristics were also predictive of inferior progression-free survival and overall survival. Upon initiation of daratumumab treatment, NK cells were rapidly depleted. Persisting NK cells exhibited an activated and exhausted phenotype with reduced expression of CD16 and granzyme B, and increased expression of TIM-3 and HLA-DR. We observed that addition of healthy donor-derived purified NK cells to BM samples from patients with either primary or acquired daratumumab-resistance improved daratumumab-mediated MM cell killing. In conclusion, NK cell dysfunction plays a role in primary and acquired daratumumab resistance. This study supports the clinical evaluation of daratumumab combined with adoptive transfer of NK cells.


Conflict of interest statement

MCM has a consultancy or advisory role for Gilead Sciences, BMS, Alnylam, Janssen Cilag, Takeda, and Servier; all paid to employer, hospitality from Celgene. MDL serves in advisory boards for Roche, Janssen and Abbvia. AB receives honoraria from Celgene, Janssen, Amgen, Takeda, and Sanofi. MJK has received research support from Kite/Gilead, and honoraria from Kite/Gilead, Novartis, BMS/Celgene, Takeda, Roche, and Miltenyi Biotec (all paid to institution). MK, TC, YA, RIV, TS, GV, DCS, LvS, and ER are employed by Janssen. PS has received honoraria from Amgen, BMS, Celgene, Janssen, Karyopharm, Takeda, and receives research funding from Amgen, Celgene, Janssen, Karyopharm, SkylineDx, Takeda. SZ has received research funding from Celgene, Takeda, Janssen, and serves in advisory boards for Janssen, Takeda, BMS, Oncopeptides and Sanofi, all paid to institution. TM has received research support from Janssen Pharmaceuticals, Takeda, Genmab, Novartis, and ONK Therapeutics. NWCJvdD has received research support from Janssen Pharmaceuticals, AMGEN, Celgene, Novartis, Cellectis, and BMS, and serves in advisory boards for Janssen Pharmaceuticals, AMGEN, Celgene, BMS, Takeda, Roche, Novartis, Bayer, Adaptive, and Servier. All the other authors have no conflicts of interest to disclose.

Figures

Figure 1.
Figure 1.
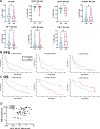
Response to daratumumab monotherapy in DARA-ATRA study and differences in BM-resident NK cells between healthy donors and MM patients. (A) Response rates of 63 patients enrolled in part A of the DARA-ATRA study, treated with daratumumab monotherapy. (B) Frequency of NK cells and NK cell phenotype were assessed by flow cytometry in BM samples obtained from relapsed/refractory MM patients (n = 51) and from HD of comparable age (n = 10). Data are depicted as violin plots, indicating the distribution, including median and interquartile range. Groups were compared using Mann-Whitney test. *P < 0.05; ***P < 0.001; ****P < 0.0001. BM = bone marrow; HD =healthy donors; PD = progressive disease; PR = partial response; MM = multiple myeloma; MR = minimal response; NK = natural killer; ns = not significant; (s)CR = (stringent) complete remission; SD = stable disease; VGPR = very good partial response.
Figure 2.
Figure 2.
High proportions of HLA-DR+ NK cells and TIM-3+ NK cells, as well as a low proportion of CD16+ NK cells in the BM microenvironment were associated with inferior response and inferior survival following initiation of daratumumab monotherapy. (A) Both the frequency of NK cells and NK cell phenotype at baseline were assessed by flow cytometry in BM samples obtained from patients who achieved a PR or better (responder; n = 21) following initiation of daratumumab treatment, and from patients with less than PR (nonresponder; n = 30). Data are depicted as violin plots, indicating the distribution, including median and interquartile range. Groups were compared using Mann-Whitney test. (B) Kaplan-Meier curves representing PFS from start part A to progression, death, or last follow-up in part B (daratumumab + ATRA), according to the median proportion of TIM-3+, HLA-DR+, or CD16+ NK cells. (C) Kaplan-Meier curves representing OS from start part A to death or last follow-up, according to the median proportion of TIM-3+, HLA-DR+, or CD16+ NK cells. Red curve represents the patients with proportion of specific subset of NK cells above the median, and the blue curve represents patients with a proportion of NK cells equal to or below the median. (D) BM-MNCs obtained from 47 daratumumab naive-MM patients were incubated with 10 μg/mL daratumumab in duplicate for 48 h, after which MM cell-specific lysis was assessed by flow cytometry. The correlation between daratumumab-mediated MM cell lysis and the baseline ratio between CD16+ NK cells and MM cells was calculated using Spearman’s correlation coefficient (r). Dots represent individual experiments. ns = not significant; *P < 0.05; **P < 0.01. PFS = progression-free survival; OS = overall survival; BM = bone marrow; NK = natural killer; MM = multiple myeloma; PR = partial response; ATRA = all-trans retinoic acid; MNC = mononuclear cells.
Figure 3.
Figure 3.
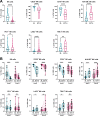
Development of daratumumab resistance is associated with an increased proportion of BM-resident NK cells expressing inhibitory receptors and a decreased proportion of CD16+ NK cells. (A) Proportion of NK cells and NK cell phenotype in BM samples at BL (n = 51) and at EOT-A (disease progression during the first cycle of treatment or after initial response in part A, <MR after the second treatment cycle, or <PR after the third treatment cycle; n = 47) were assessed by flow cytometry and depicted as violin plots, indicating the distribution, including median and interquartile range. (B) Both the proportion of NK cells and NK cell phenotype in BM samples at baseline and at EOT-A were also analyzed separately for patients who developed acquired daratumumab-resistance (Acq-R; patients who achieved a partial response or better before progression) and patients with Prim-R. Dots represent individual samples, with box and whiskers, representing median values, 25th to 75th percentile, and range. Groups were compared using Wilcoxon Matched-pairs signed rank test. *P < 0.05; **P < 0.01, ***P < 0.001; ****P < 0.0001. ns = not significant; MR = minor response; Prim-R = primary resistance; BL = baseline; PFS = progression-free survival; BM = bone marrow; NK = natural killer; PR = partial response; EOT-A, end of treatment part A.
Figure 4.
Figure 4.
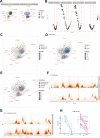
Differential marker expression in NK cells between responders vs nonresponders, and baseline vs time of daratumumab resistance (CyTOF analysis – bone marrow), using a supervised learning approach. CyTOF analysis was performed to explore shifts in NK cell composition in a data-driven way, in a subset of BM samples obtained from 37 patients (baseline, n = 29; EOT-A, n = 23). (A) FreeViz projection of NK cells at baseline from both R (n = 15) and NR patients (n = 22), and at the time of daratumumab resistance (primary or acquired resistance). The position of the different markers was optimized to maximize the difference between conditions of interest; the distance to the center of the projection corresponds to the weight of the markers (the longer, the more important). After projection, density lines were used to visualize the distribution of cells; markers with low weights are filtered out to increase readability. (B) Polyfunctionality analysis of FreeViz projection; volcano plots show a number of significant bins, representing different NK cell states, between all 4 contrasts of interest. (C) At baseline, bins enriched (orange) in responding patients, compared with nonresponding patients, are compatible with granzyme B+ CD56dim NK cells. (D) In responding patients, bins depleted (blue) at the time of acquired daratumumab resistance, compared with baseline, are compatible with granzyme B+ CD56dim NK cells. (E) When comparing baseline samples to those taken at the time of daratumumab resistance, bins compatible with granzyme B+ CD56dim NK cells are depleted (blue), which was more pronounced in patients with acquired resistance compared with primary resistance. (F) At baseline, fan plots confirm that NK cells, corresponding to enriched bins in responders, are granzyme B+ CD56dim (bottom panel). At baseline, CD38+ NK cells with varying levels of HLA-DR expression are enriched in nonresponders (top panel). (G) At the time of daratumumab resistance, granzyme B+ CD56dim NK cells are depleted in patients with acquired and primary resistance, but to a significantly larger extent in patients with acquired resistance, compared with patients with primary resistance (top panel). HLA-DR+ CD56high NK cells are significantly enriched in patients with acquired resistance, compared with patients with primary resistance to daratumumab (bottom panel). (H) Boxplot of the proportion of granzyme B+ NK cells over time in responders (blue) and nonresponders (purple) shows a more pronounced decrease of granzyme B+ NK cells in patients with acquired resistance. MMI = median marker intensity; NK = natural killer; NR = nonresponding; R = responding; CyTOF = cytometry by time of flight; Acq-R = patients with acquired resistance; Prim-R = patients with primary resistance; BL = baseline; EOT-A = disease progression during the first cycle of treatment or after initial response in part A, <MR after the second treatment cycle, or <PR after the third treatment cycle.
Figure 5.
Figure 5.
Immunophenotypic analyses of longitudinal blood samples shows that changes in NK cell phenotype occur rapidly after initiation of daratumumab. (A) Absolute NK cell counts and absolute CD16+ NK cell counts in peripheral blood samples obtained from 61 patients at BL, C2D1, and at EOT-A are depicted as violin plots, indicating the distribution, including median and interquartile range. Left 2 panels for all patients; and right 2 panels for patients who developed Acq-R and those with Prim-R separately. Groups were compared using mixed-effect analysis, with Tukey multiple comparisons posttest. (B) Peripheral blood samples from 20 patients (10 responders and 10 nonresponders) were subjected to in-depth immune profiling using flow cytometry. Dots represent individual samples, with box and whiskers, representing median, 25th–75th percentile, and range. Groups were compared using Friedman test with Dunn multiple comparison posttest (when data did not follow a normal distribution), or with RM 1-way ANOVA with Holm-Šídák multiple comparison posttest (when data followed a normal distribution). Data were analyzed using mixed-effect analysis with Holm-Šídák multiple comparison posttest. *P < 0.05; **P < 0.01, ***P < 0.001; ****P < 0.0001. BL = baseline; NK = natural killer; ns = not significant; Prim-R = primary resistance; EOT-A = end of treatment part A; C2D1 = cycle 2 day 1; Acc-R = acquired resistance.
Figure 6.
Figure 6.
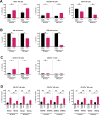
Daratumumab-induced NK cell activation results in downregulation of CD16 and upregulation of TIM-3 and HLA-DR. UM9 cells were incubated with solvent control or 10 μg/mL daratumumab in the presence of PB-MNCs (ratio of 50:1) for 4 or 24 h. (A) The proportion of TIM-3+, HLA-DR+, and CD16+ NK cells was determined by flow cytometric analysis. (B) Survival of NK cells and UM9 cells was determined and calculated as described in the Materials and Methods. Of note, we have previously shown that UM9 cells are not susceptible to daratumumab-dependent phagocytosis, and therefore MM cell elimination in these experiments is mainly by NK cells. (C) Daratumumab-mediated degranulation of NK cells and T cells was assessed by flow cytometric analysis of CD107a cell-surface expression. (D) Frequency of CD107a-positive cells based on the presence or absence of TIM-3, HLA-DR, or CD16 expression on NK cells after the 4-h or 24-h incubation with daratumumab or solvent control. Data represent mean and SEM of 4 (at 4 h) or 3 (at 24 h) independent experiments, performed in duplicate. Paired Student t test was used to evaluate significance between both groups. *P < 0.05; **P < 0.01, ***P < 0.001. PB-MNCs = peripheral blood mononuclear cells; NK = natural killer; ns = not significant; SEM = standard error of mean.
Figure 7.
Figure 7.
Healthy donor-derived NK cell repletion partially restores sensitivity to daratumumab in ex vivo experiments. (A) Expression of CD16, HLA-DR, and TIM-3 on NK cells in peripheral blood samples of 5 HD was compared with expression levels on NK cells in blood samples from daratumumab-naïve (n = 10) and daratumumab-refractory MM patients (n = 10), using Kruskal Wallis test. Dots represent individual samples, with bars indicating mean ± SEM. (B) In ex vivo cytotoxicity assays, 100,000 thawed cryopreserved BM mononuclear cells from nonresponding patients obtained at BL, before daratumumab treatment, were incubated for 48 h with solvent control or daratumumab (DARA; 10 μg/μL), with or without 20,000 healthy donor-derived NK cells. Data represent MM cell lysis of 3 samples, performed in triplicate. The percentage of MM cells ranged from 18% to 55% in these BM samples. Groups were compared using paired t test. (C) Similar experiments were performed with 5 BM samples obtained from previously responding patients at the time of PD (acquired daratumumab resistance). The percentage of MM cells ranged from 7% to 38%. (D) From 3 of the 5 responding patients, ex vivo daratumumab-mediated lysis could also be assessed at BL. The percentage of lysis induced by daratumumab was calculated using the following formula % lysis MM cells = 1 – (absolute number of surviving MM cells in daratumumab-treated wells)/(absolute number of surviving MM cells in solvent control-treated wells) × 100. Negative lysis values indicate that cell numbers are higher when compared with solvent control. *P < 0.05; **P < 0.01, ***P < 0.001. ns = not significant; NK = natural killer; BL = baseline; HD = healthy donors; MM = multiple myeloma; PD = progressive disease; BM = bone marrow; SEM = standard error of mean.

References

    1. van de Donk N, Richardson PG, Malavasi F. CD38 antibodies in multiple myeloma: back to the future. Blood. 2018;131:13–29. - PubMed
    1. Lammerts van Bueren J, Jakobs D, Kaldenhoven N, et al. . Direct in Vitro comparison of daratumumab with surrogate analogs of CD38 antibodies MOR03087, SAR650984 and Ab79. Blood. 2014;124:3474–3474.
    1. Leleu X, Martin T, Weisel K, et al. . Anti-CD38 antibody therapy for patients with relapsed/refractory multiple myeloma: differential mechanisms of action and recent clinical trial outcomes. Ann Hematol. 2022;101:2123–2137. - PMC - PubMed
    1. Krejcik J, Casneuf T, Nijhof IS, et al. . Daratumumab depletes CD38+ immune regulatory cells, promotes T-cell expansion, and skews T-cell repertoire in multiple myeloma. Blood. 2016;128:384–394. - PMC - PubMed
    1. Van De Donk NWCJ, Adams H, Vanhoof G, et al. . Daratumumab in Combination with Lenalidomide Plus Dexamethasone Results in Persistent Natural Killer (NK) Cells with a Distinct Phenotype and Expansion of Effector Memory T-Cells in Pollux, a Phase 3 Randomized Study. Blood. 2017;130(Suppl 1):3124. http://www.bloodjournal.org/content/130/Suppl_1/3124.abstract.