. 2023 May 8;21(5):e3002110.
doi: 10.1371/journal.pbio.3002110. eCollection 2023 May.

MyosinA is a druggable target in the widespread protozoan parasite Toxoplasma gondii

Affiliations

MyosinA is a druggable target in the widespread protozoan parasite Toxoplasma gondii

Anne Kelsen et al. PLoS Biol. .

Abstract

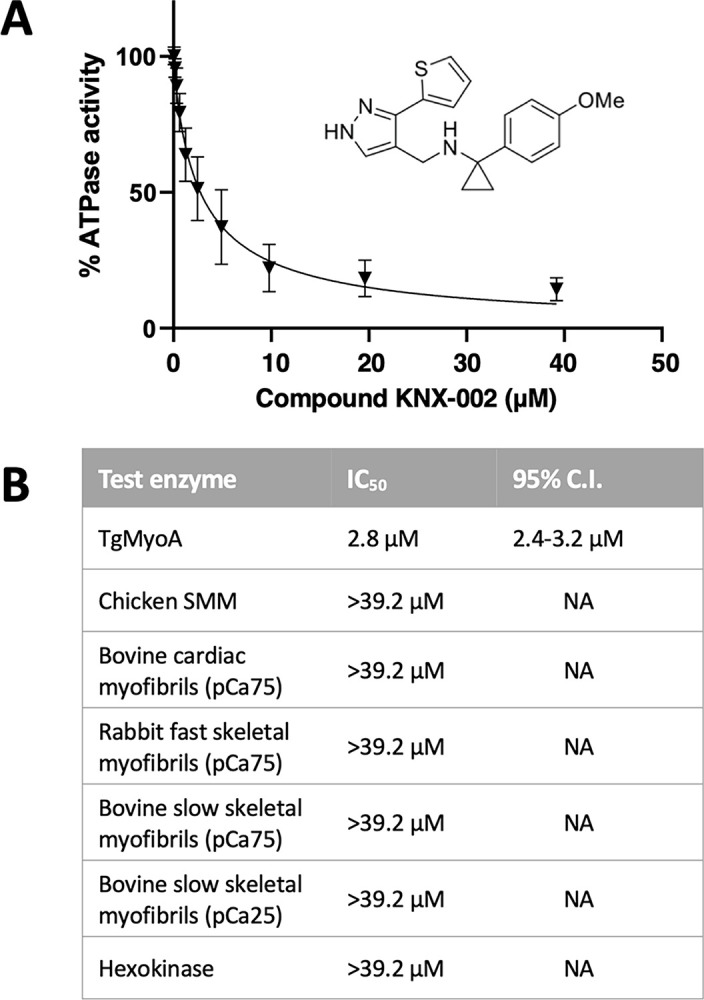
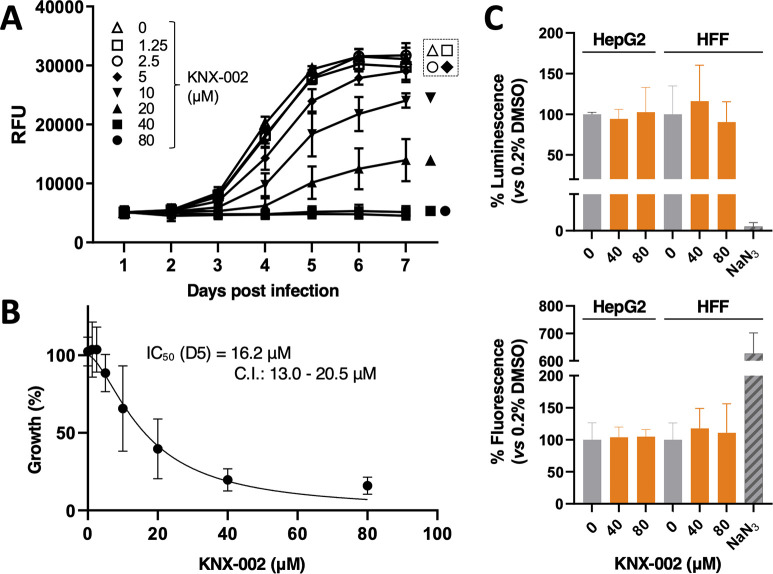
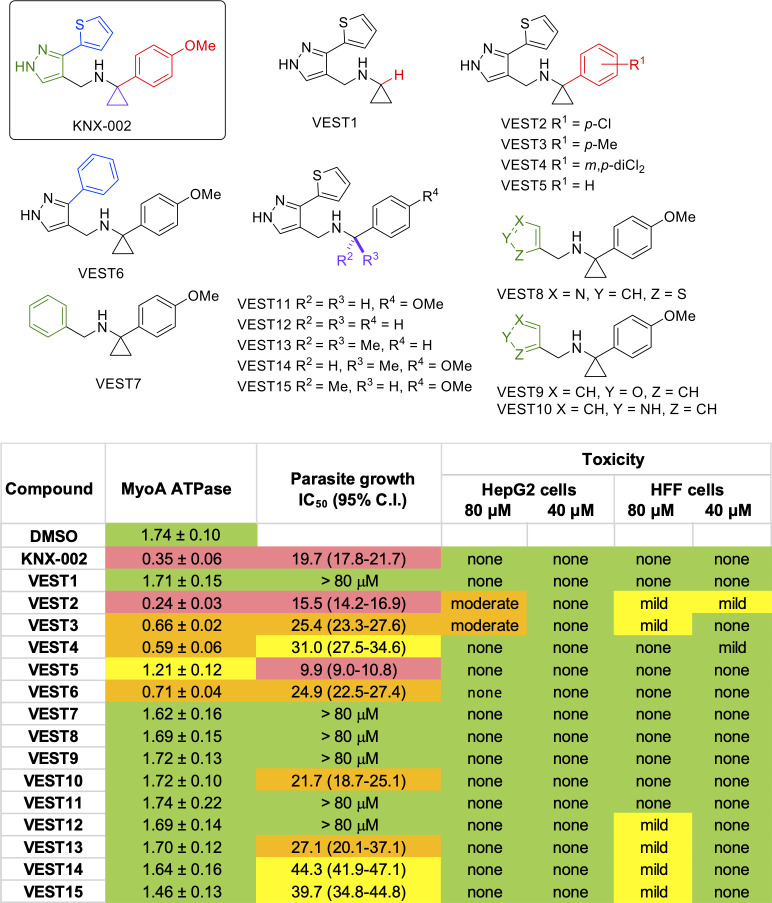
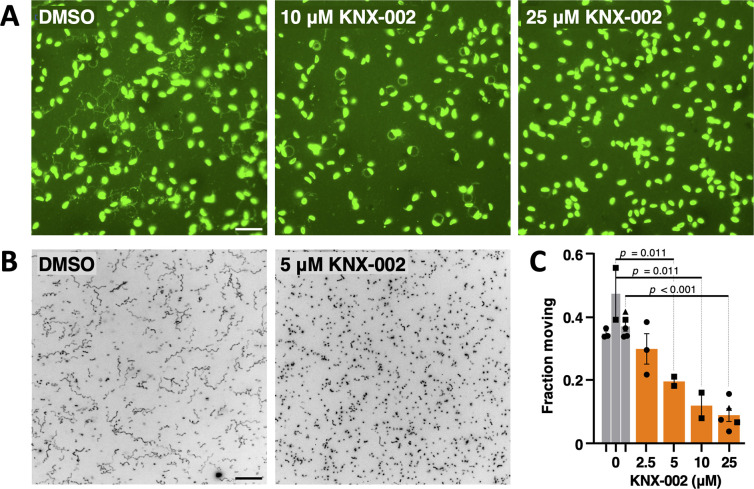
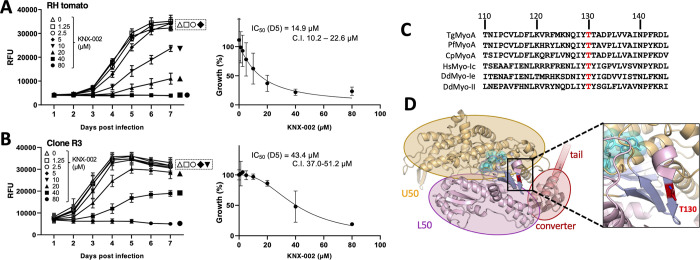
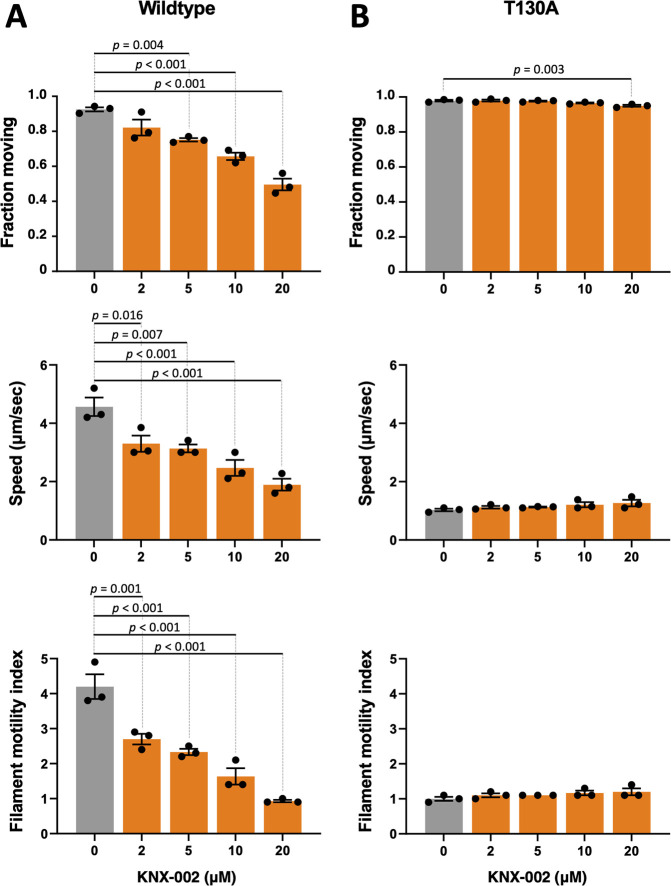
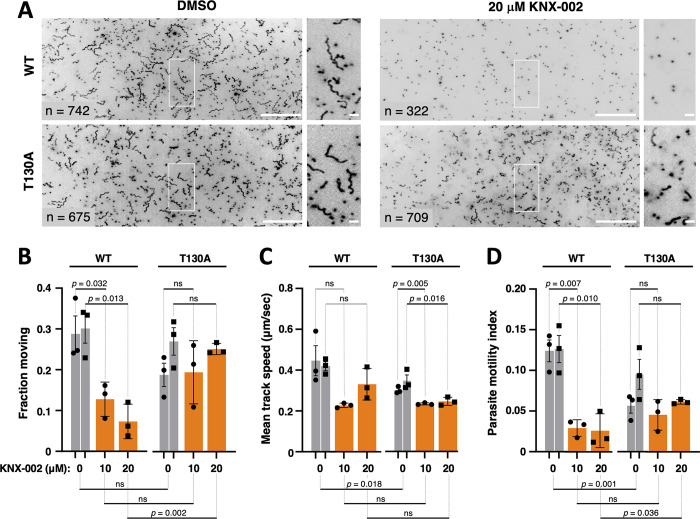
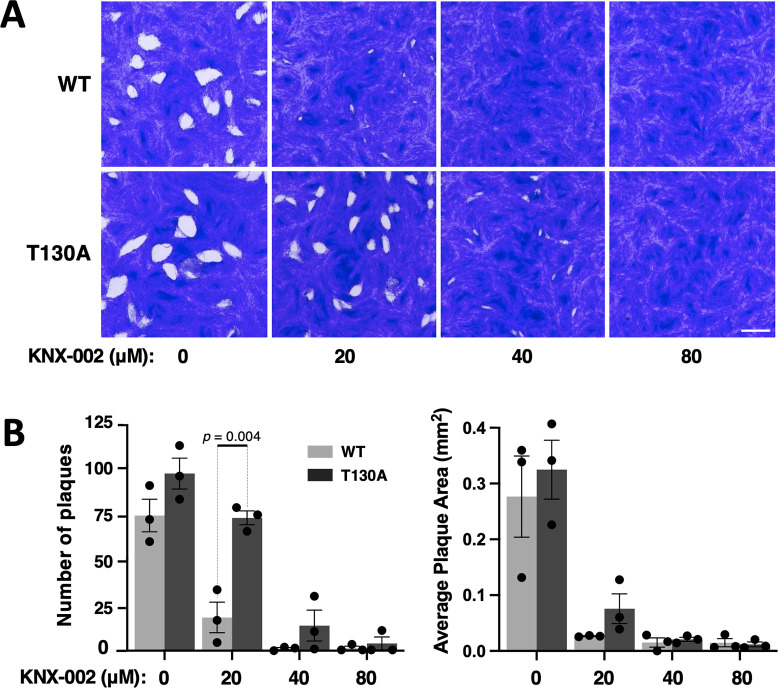
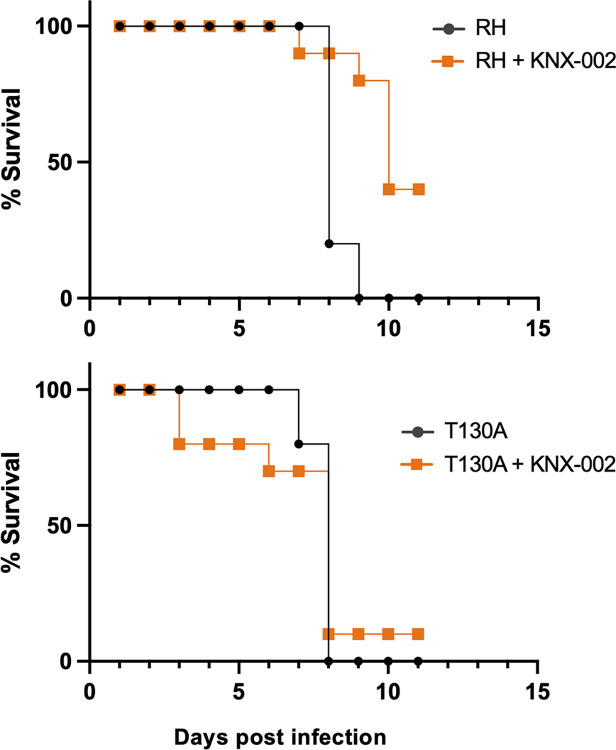
Toxoplasma gondii is a widespread apicomplexan parasite that can cause severe disease in its human hosts. The ability of T. gondii and other apicomplexan parasites to invade into, egress from, and move between cells of the hosts they infect is critical to parasite virulence and disease progression. An unusual and highly conserved parasite myosin motor (TgMyoA) plays a central role in T. gondii motility. The goal of this work was to determine whether the parasite's motility and lytic cycle can be disrupted through pharmacological inhibition of TgMyoA, as an approach to altering disease progression in vivo. To this end, we first sought to identify inhibitors of TgMyoA by screening a collection of 50,000 structurally diverse small molecules for inhibitors of the recombinant motor's actin-activated ATPase activity. The top hit to emerge from the screen, KNX-002, inhibited TgMyoA with little to no effect on any of the vertebrate myosins tested. KNX-002 was also active against parasites, inhibiting parasite motility and growth in culture in a dose-dependent manner. We used chemical mutagenesis, selection in KNX-002, and targeted sequencing to identify a mutation in TgMyoA (T130A) that renders the recombinant motor less sensitive to compound. Compared to wild-type parasites, parasites expressing the T130A mutation showed reduced sensitivity to KNX-002 in motility and growth assays, confirming TgMyoA as a biologically relevant target of KNX-002. Finally, we present evidence that KNX-002 can slow disease progression in mice infected with wild-type parasites, but not parasites expressing the resistance-conferring TgMyoA T130A mutation. Taken together, these data demonstrate the specificity of KNX-002 for TgMyoA, both in vitro and in vivo, and validate TgMyoA as a druggable target in infections with T. gondii. Since TgMyoA is essential for virulence, conserved in apicomplexan parasites, and distinctly different from the myosins found in humans, pharmacological inhibition of MyoA offers a promising new approach to treating the devastating diseases caused by T. gondii and other apicomplexan parasites.


Conflict of interest statement

The authors have declared that no competing interests exist.

Figures

Fig 1
Fig 1. KNX-002 inhibits the actin-activated ATPase activity of TgMyoA but not vertebrate myosins.
(A) The effect of various concentrations of KNX-002 on TgMyoA ATPase activity, normalized to the activity with an equivalent amount of DMSO (vehicle) only. Inset shows the structure of KNX-002. Each data point represents mean ATPase activity of 3 different batches of KNX-002 ± SEM. (B) The inhibitory effect of KNX-002 on TgMyoA and various vertebrate myosins (IC50 and 95% CI). The dose-response curves for the individual vertebrate myosins are shown in S1 Fig and the measurements underlying the data summarized in this figure can be found in S1 Data. CI, confidence interval.
Fig 2
Fig 2. KNX-002 inhibits the growth of T. gondii in culture, with no detectable host cell toxicity.
(A) tdTomato-expressing parasites were preincubated with various concentrations of KNX-002 for 5 min (0 = DMSO vehicle only) and then added to HFF cells on a 384-well plate. Fluorescence was measured daily to quantify parasite growth, in the continued presence of compound, over the next 7 days. RFU = relative fluorescence units. The data shown are the mean ± SEM from 2 independent biological replicates, each consisting of 3 technical replicates at all time points. (B) The data from day 5 (D5) of the growth assay shown in panel (A) were used to calculate the IC50 of KNX-002 for parasite growth (16.2 μM, 95% CI = 13.0 to 20.5). See Fig 5A for a repeat of these growth assays and IC50 calculations. (C) Subconfluent HepG2 and HFF cells were cultured in the presence of 0 (DMSO vehicle only), 40, or 80 μM KNX-002 for 72 h. Cell viability/growth was measured using Promega CellTiter-Glo (top panel) and toxicity was measured using Promega CellTox green (bottom panel), and 0.1% w/v NaN3 served as a positive control for cytotoxicity. Results are plotted relative to the DMSO controls. Bars show the mean of 3 independent experiments ± SEM. KNX-002 shows no evidence of growth inhibition or cytotoxicity in either cell type at either 40 or 80 μM. The measurements underlying the data plotted in this figure can be found in S2 Data. HFF, human foreskin fibroblast.
Fig 3
Fig 3. Preliminary SAR analysis.
The structures of KNX-002 and 15 analogs (VEST1-15) are shown at the top. The table summarizes the activity of each of the compounds in assays measuring recombinant TgMyoA ATPase activity, parasite growth, and mammalian cell toxicity; the data on which the table is based are shown in S3–S5 Figs. ATPase assay data correspond to relative luminescence units × 10−6 (mean from 3 independent replicates +/-SEM) in the presence of 20 μM compound (S3 Fig). Green = less than 20% inhibition, yellow = 20%–40% inhibition; orange = 45%–70% inhibition; red = greater than 70% inhibition compared to vehicle (DMSO) controls. Growth assay data correspond to calculated IC50 and 95% CI from a 5 to 6 day growth assay (S4 Fig). Red = IC50 less than 20 μM; orange = IC50 of 20–35 μM; yellow = IC50 of 35–50 μM; green = no detectable growth inhibition relative to vehicle (DMSO) controls. Toxicity assay entries summarize the results from 72-h CellTox green toxicity and CellTiter-Glo viability assays on both human foreskin fibroblasts and HepG2 cells. Thresholds for mild and moderate toxicity and loss of viability compared to vehicle (DMSO) controls are indicated by the colored bars on the right-hand side of S5 Fig. CI, confidence interval; SAR, structure-activity relationship.
Fig 4
Fig 4. KNX-002 inhibits the motility of T. gondii tachyzoites.
(A) Representative images from a 2D trail assay of parasites treated with DMSO (vehicle) only, 10 μM KNX-002, or 25 μM KNX-002. The parasites and trails were visualized by indirect immunofluorescence using an antibody against TgSAG1 after 15 min of gliding on the coverslip. Scale bar = 20 μm. (B) Representative maximum intensity projections showing parasite trajectories during 60 s of motility in Matrigel in the absence (DMSO) or presence of 5 μM KNX-002. Scale bar = 40 μm. The grayscale images were inverted to provide clearer visualization of the trajectories. (C) Fraction of the parasite population moving during a 60-s assay in the presence of the indicated concentrations of KNX-002 (IC50 = 6.2 μM, 95% CI = 4.1–9.4 μM). Each data point represents a single biological replicate consisting of 3 technical replicates. Sets of data captured on the same days, indicated by similar symbol shapes, were compared by Student’s one-tailed paired t tests. The measurements underlying the data plotted in panel C can be found in S9 and S10 Data. CI, confidence interval.
Fig 5
Fig 5. Identification of a mutant parasite showing reduced sensitivity to KNX-002 in growth assays.
(A, B) Left panels: tdTomato-expressing wild-type parasites (A) or clone R3 (B), which was generated by mutagenesis and selection in KNX-002, were preincubated with various concentrations of KNX-002 for 5 min and then added to HFF cells on a 384-well plate. Fluorescence was measured daily over the next 7 days to quantify parasite growth in the continuing presence of compound. RFU = relative fluorescence units. The data shown are from 3 independent biological replicates, each consisting of 2 to 3 technical replicates at all time points. Right panels: the data from day 5 (D5) of the growth assays were used to calculate the IC50 and 95% CI of KNX-002 for parasite growth. Vertical bars indicate SEM (left panels) or 95% CI (right panels). (C) Multiple sequence alignment showing the high degree of conservation of T130 in apicomplexan MyoAs (Tg = T. gondii, Pf = Plasmodium falciparum, Cp = Cryptosporidium parvum) and MyoIc, Ie and II from Homo sapiens (Hs) and Dictyostelium discoideum (Dd). (D) Structure of the TgMyoA (PDB ID [6DUE]) motor domain, showing the position of T130 (red) relative to the converter, U50 and L50 subdomains. The measurements underlying the data plotted in panels A and B can be found in S11 and S12 Data. CI, confidence interval; HFF, human foreskin fibroblast.
Fig 6
Fig 6. KNX-002 inhibits in vitro motility driven by wild type but not T130A TgMyoA.
In vitro motility assays, showing the fraction of actin filaments moving, their sliding speed, and the corresponding filament motility index (fraction moving × mean speed) of TgMyoA treated with various concentrations of KNX-002, as indicated (0 = DMSO vehicle only). (A) Wild-type TgMyoA, (B) T130A TgMyoA. Bars show the mean of 3 independent experiments ± SEM. For each motility parameter, compound treatments were compared to DMSO by one-way ANOVA with Dunnett’s test for multiple comparisons. Only the statistically significant differences (p < 0.05) are indicated. The measurements underlying the data plotted in this figure can be found in S13 Data.
Fig 7
Fig 7. The TgMyoA T130A mutation reduces parasite sensitivity to KNX-002 in 3D motility assays.
(A) Large panels: representative maximum intensity projections showing the trajectories of wild-type (WT) and T130A mutant parasites during 80 s of motility in Matrigel, in the presence of DMSO (vehicle control) or 20 μM KNX-002. The grayscale images were inverted to provide clearer visualization of the trajectories; scale bar = 100 μm. The boxed area in each large panel is magnified and shown to the right; scale bar = 10 μm. (B) Percent of WT and T130A mutant parasites moving in the presence of DMSO (vehicle), 10 μM KNX-002, or 20 μM KNX-002. (C) The mean speeds of the parasites analyzed in panel B. (D) The corresponding parasite motility index (fraction of parasites moving × mean speed). Each data point in panels B–D represents a single biological replicate composed of 3 technical replicates. Three of the biological replicates were collected on the same 3 days (circles), and 3 of the biological replicates were collected on a different 3 days (squares). Bars show the mean of the biological replicates ± SEM. Sets of biological replicates using the same parasite line and collected on the same days were compared by Student’s one-tailed paired t tests (significance indicated above the graphs). Sets of biological replicates comparing different parasite lines were analyzed by Student’s two-tailed unpaired t tests (significance indicated below the graphs). ns = not significant (p > 0.05). The measurements underlying the data plotted in Panels B–D can be found in S18 and S19 Data. WT, wild-type.
Fig 8
Fig 8. The TgMyoA T130A mutation reduces parasite sensitivity to KNX-002 in growth assays.
(A) Representative images of plaque assays using wild-type (WT; top row) and T130A mutant (bottom row) parasites in the presence of 0 (DMSO vehicle only), 20, 40, and 80 μM KNX-002, 7 days after inoculating confluent HFF monolayers with 200 parasites/well. An 11.3 × 11.3 mm area from the middle of the well is shown; scale bar = 2 mm. (B) Total number of plaques per well and average plaque area of HFF monolayers inoculated with 200 parasites/well (WT or T130A) and grown for 7 days in the presence of 0 (DMSO), 20, 40, or 80 μM KNX-002. Bars show the mean of 3 biological replicates ± SEM. Treatments were compared by Student’s two-tailed unpaired t test; only the statistically significant differences (p < 0.05) are indicated. The measurements underlying the data plotted in panel B can be found in S20 Data. HFF, human foreskin fibroblast; WT, wild-type.
Fig 9
Fig 9. KNX-002 slows disease progression in mice infected with wild-type but not T130A mutant parasites.
Four groups of mice were injected intraperitoneally on day 0 with either KNX-002 (20 mg/kg) or the equivalent volume of DMSO (vehicle). Thirty minutes later, the mice were infected with 500 wild-type parasites (RH; top panel) or 500 parasites expressing T130A mutant myosin (bottom panel). On day 2, the mice were treated again either with compound or DMSO. Differences between the survival curves were analyzed using a log-rank Mantel–Cox test (p = 0.004 for RH vs. RH + KNX-002 [top panel]; p = 0.922 for T130A vs. T130A + KNX-002 [bottom panel]) and p = 0.008 for RH + KNX-002 vs. T130A + KNX-002 (orange curves). The measurements underlying the data plotted in this figure can be found in S21 Data.

Comment in

  • Stopping a parasite in its tracks.
    Du Toit A. Du Toit A. Nat Rev Microbiol. 2023 Jul;21(7):413. doi: 10.1038/s41579-023-00915-0. Nat Rev Microbiol. 2023. PMID: 37208460 No abstract available.

Similar articles

Cited by

References

    1. Dubey JP, Murata FHA, Cerqueira-Cézar CK, Kwok OCH, Villena I. Congenital toxoplasmosis in humans: an update of worldwide rate of congenital infections. Parasitology. 2021:1–11. Epub 2021/07/14. doi: 10.1017/s0031182021001013 . - DOI - PMC - PubMed
    1. El Bissati K, Levigne P, Lykins J, Adlaoui EB, Barkat A, Berraho A, et al.. Global initiative for congenital toxoplasmosis: an observational and international comparative clinical analysis. Emerg Microbes Infect. 2018;7(1):165. Epub 2018/09/29. doi: 10.1038/s41426-018-0164-4 ; PubMed Central PMCID: PMC6160433. - DOI - PMC - PubMed
    1. Vidal JE, Hernandez AV, de Oliveira AC, Dauar RF, Barbosa SP Jr., Focaccia R. Cerebral toxoplasmosis in HIV-positive patients in Brazil: clinical features and predictors of treatment response in the HAART era. AIDS Patient Care STDS. 2005;19(10):626–34. Epub 2005/10/20. doi: 10.1089/apc.2005.19.626 . - DOI - PubMed
    1. Porter SB, Sande MA. Toxoplasmosis of the central nervous system in the acquired immunodeficiency syndrome. N Engl J Med. 1992;327(23):1643–8. Epub 1992/12/03. doi: 10.1056/NEJM199212033272306 . - DOI - PubMed
    1. de Oliveira GB, da Silva MA, Wanderley LB, da Cunha CC, Ferreira EC, de Medeiros ZM, et al.. Cerebral toxoplasmosis in patients with acquired immune deficiency syndrome in the neurological emergency department of a tertiary hospital. Clin Neurol Neurosurg. 2016;150:23–26. doi: 10.1016/j.clineuro.2016.08.014 . - DOI - PubMed

Publication types