. 2023 May 16;120(20):e2219699120.
doi: 10.1073/pnas.2219699120. Epub 2023 May 8.

A single-cell multiomic analysis of kidney organoid differentiation

Affiliations

A single-cell multiomic analysis of kidney organoid differentiation

Yasuhiro Yoshimura et al. Proc Natl Acad Sci U S A. .

Abstract

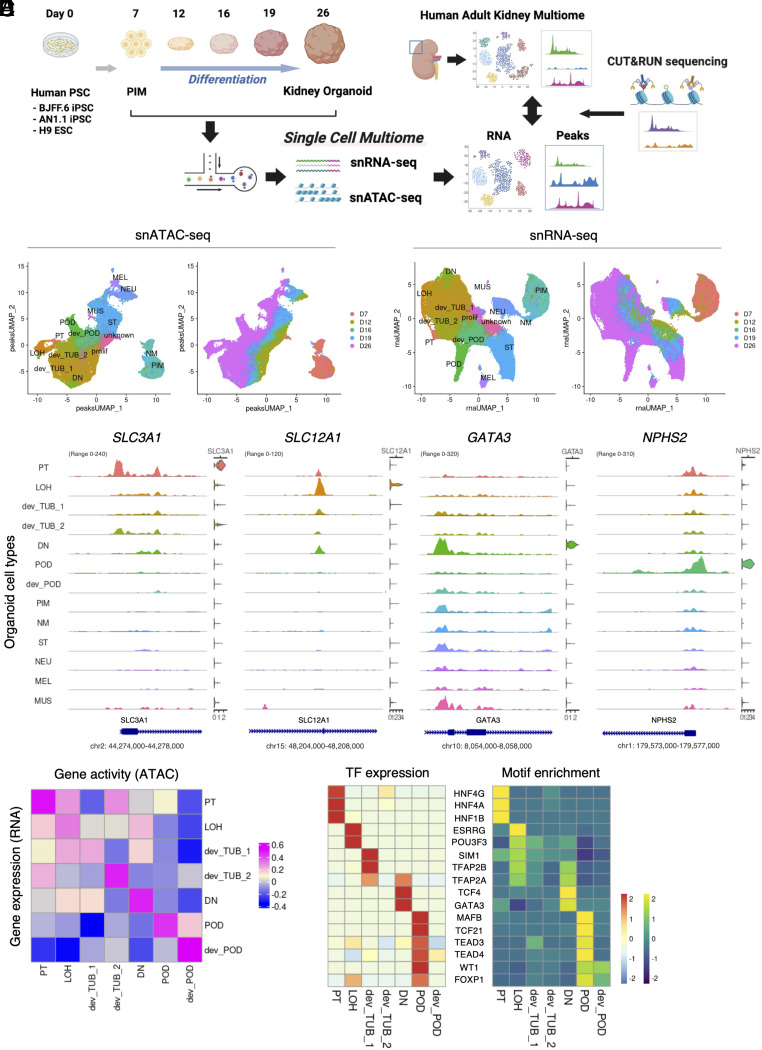
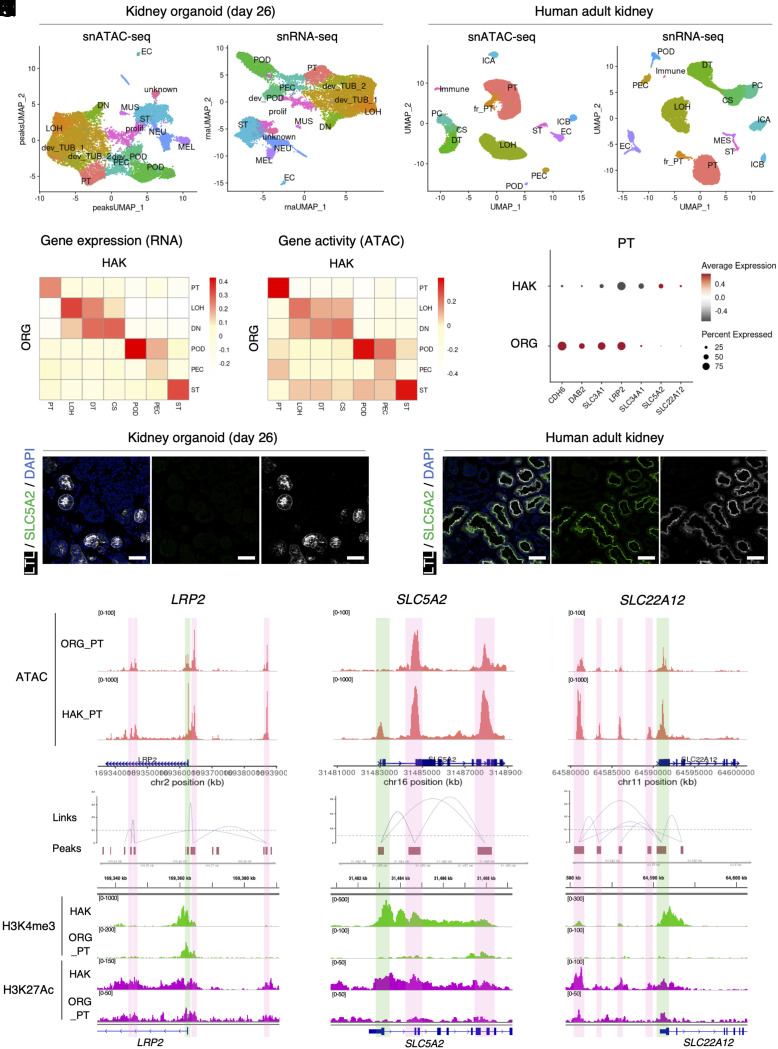
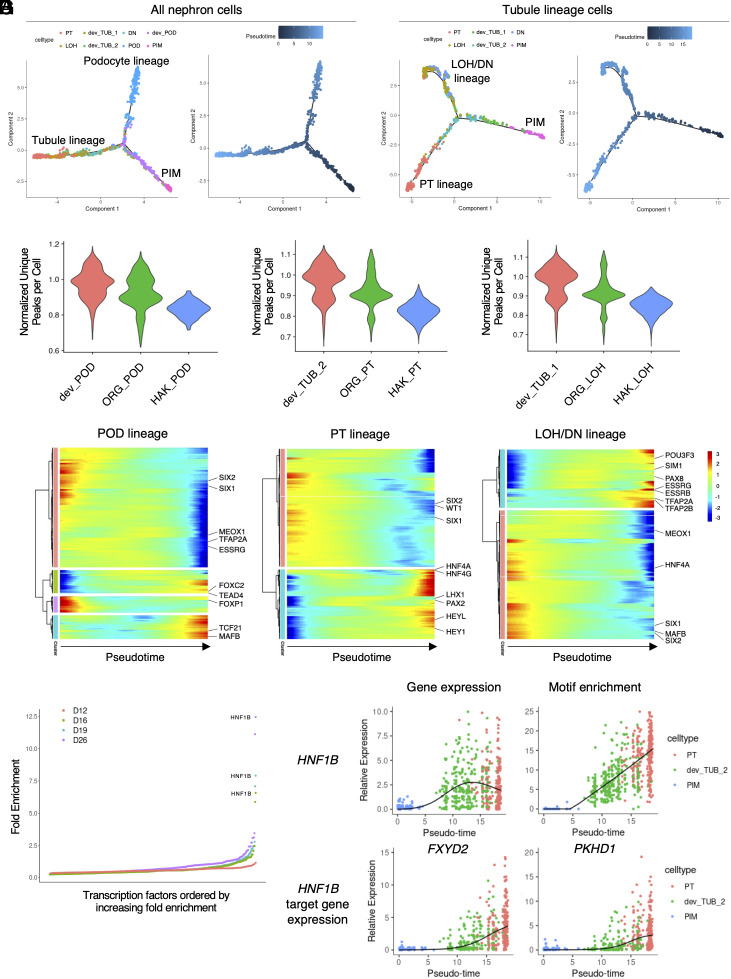
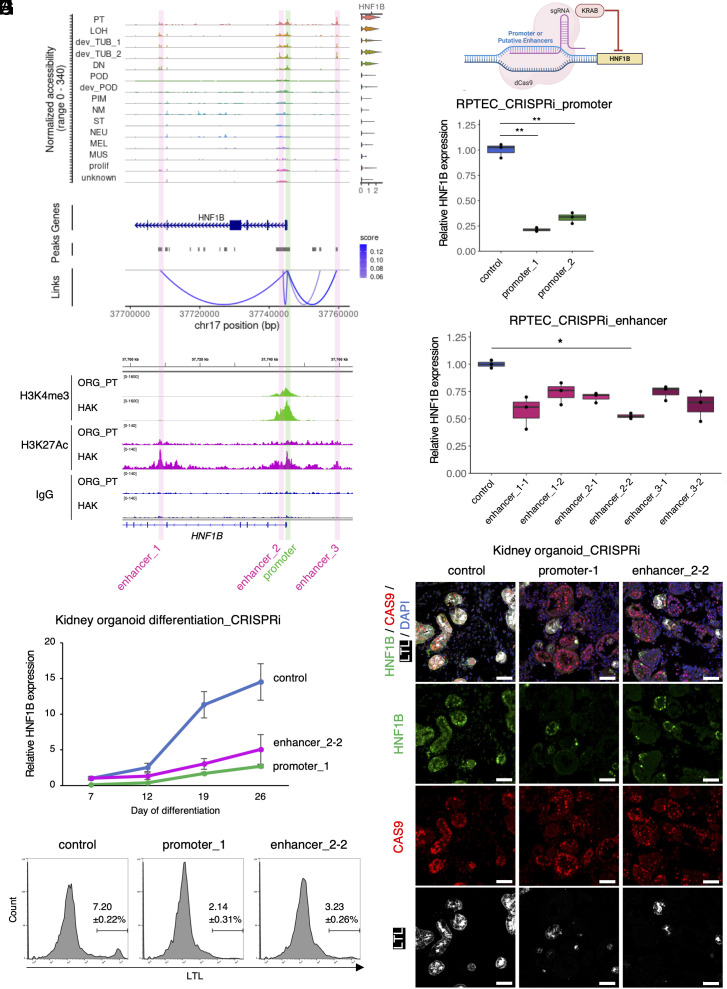
Kidney organoids differentiated from pluripotent stem cells are powerful models of kidney development and disease but are characterized by cell immaturity and off-target cell fates. Comparing the cell-specific gene regulatory landscape during organoid differentiation with human adult kidney can serve to benchmark progress in differentiation at the epigenome and transcriptome level for individual organoid cell types. Using single-cell multiome and histone modification analysis, we report more broadly open chromatin in organoid cell types compared to the human adult kidney. We infer enhancer dynamics by cis-coaccessibility analysis and validate an enhancer driving transcription of HNF1B by CRISPR interference both in cultured proximal tubule cells and also during organoid differentiation. Our approach provides an experimental framework to judge the cell-specific maturation state of human kidney organoids and shows that kidney organoids can be used to validate individual gene regulatory networks that regulate differentiation.

Keywords: CRISPR interference; CUT&RUN; kidney organoid; scATAC-seq; scRNA-seq.


Conflict of interest statement

B.D.H. is a consultant for Janssen Research & Development, LLC, Pfizer, and Chinook Therapeutics and holds equity in Chinook Therapeutics.

Figures

Fig. 1.
Fig. 1.
Characterization of gene expression and open chromatin accessibility of human kidney organoid differentiation. (A) Schematic of this study. Samples were collected at multiple time points from day 7 to day 26 during organoid differentiation. The collected samples were dissociated into single cells and nuclei were extracted. snRNA-seq and snATAC-seq libraries were generated from the extracted nuclei using the 10X Genomics single-cell ATAC and gene expression kit. After sequencing, each organoid multiome dataset was merged and processed for analysis. Human adult kidney multiome dataset [Muto et al. (10)] was used to relatively evaluate day 26 kidney organoids. CUT&RUN sequencing was employed to evaluate chemical annotation of ATAC peaks. (B) UMAP plots of chromatin accessible peaks of the merged kidney organoid differentiation multiome dataset. Left plot shows each organoid cell type cluster. Right plot shows origin of time points during differentiation. PT, proximal tubule; LOH, Loop of Henle; dev_TUB, developing tubule; DN, distal nephron; POD, podocyte; dev_POD, developing podocyte; PIM, posterior intermediate mesoderm; NM, nascent mesoderm; ST, stromal cell; NEU, neural cell; MEL, melanocyte; MUS, muscle cell; prolif, proliferating cell; unknown, undefined type of cell. (C) UMAP plots of gene expression of the merged kidney organoid differentiation multiome dataset. Left plot shows each organoid cell type cluster. Right plot shows origin of time point during differentiation. (D) Coverage plots showing ATAC peaks around transcription start site and gene expression levels of SLC3A1 (PT), SLC12A1 (LOH), GATA3 (DN), and NPHS2 (POD) genes in each cluster of the merged kidney organoid differentiation multiome dataset. (E) Heatmap showing Pearson’s correlation coefficient between gene expression and gene activity of each cluster in nephron-lineage cells of the merged kidney organoid differentiation multiome dataset. (F) Heatmap showing gene expression levels (Left) and motif enrichment in ATAC peaks (Right) of top-listed transcription factors in nephron-lineage cells of the merged kidney organoid differentiation multiome dataset.
Fig. 2.
Fig. 2.
Comparison of kidney organoid and human adult kidney chromatin accessibility landscapes. (A) UMAP plots of chromatin-accessible peak (Left) and gene expression (Right) of the day 26 kidney organoid multiome dataset. PT, proximal tubule; LOH, loop of Henle; dev_TUB, developing tubule; DN, distal nephron; POD, podocyte; dev_POD, developing podocyte; PEC, parietal epithelial cells in the glomerulus, EC, endothelial cell; ST, stromal cell; NEU, neural cell; MEL, melanocyte; MUS, muscle cell; prolif, proliferating cell; unknown, undefined type of cell. (B) UMAP plots of chromatin-accessible peak (Left) and gene expression (Right) of the merged human adult kidney multiome dataset. fr-PT, failed repaired proximal tubule; DT, distal tubule; CS, connecting segment, PC, principal cell; ICA, intercalated cell type A; ICB, intercalated cell type B; Immune, immune cell. (C and D) Heatmaps showing correlation between nephron-lineage cells of human adult kidney and kidney organoid (day 26) gene expression (C) and gene activity (D) modalities. (E) Dot plot showing expression levels of representative developing and mature proximal tubule marker genes in the proximal tubule cluster of human adult kidney and kidney organoid (day 26). (F and G) Immunofluorescence images of SLC5A2 (green, SGLT2), LTL (white), and nuclear DAPI (blue) staining in the proximal tubule of kidney organoids (day 26) (F) and human adult kidney (G). (Scale bars indicate 50 µm). (HJ) Coverage plots showing ATAC peaks and gene expression level in proximal tubule of human adult kidney and kidney organoid (day 26) (Upper) and peaks and peak-to-gene links (Lower) of LRP2 (H), SLC5A2 (I), and SLC22A12 (J) genes. Green boxes indicate promoter regions; pink boxes indicate putative enhancer regions. (KM) Corresponding integrative genomics viewer (IGV) images showing target sites of H3K4me3 (promoter, upper) and H3K27Ac (enhancer and promoter, lower) antibodies in CUT&RUN sequencing with human adult kidney (HAK) and organoid-derived proximal tubule (ORG_PT) (lower) of LRP2 (K), SLC5A2 (L), and SLC22A12 (M) genes.
Fig. 3.
Fig. 3.
Gene regulatory dynamics during kidney organoid differentiation. (A) Pseudotime ordering plots of nephron-lineage cells using snRNA-seq modality showing podocyte and tubule-lineage branches. Colors are based on cell type (Left) and pseudotime (Right). (B) Subordering plots of tubule-lineage cells along pseudotime showing PT and LOH/DN lineage branches. Colors are based on cell type (Left) and pseudotime (Right). (C) Violin plots of number of unique peaks per cell, normalized for read depth, in differentiating (red) and differentiated (green) podocytes (POD, Left), proximal tubules (PT, Middle), and loop of Henle (LOH, Right) of day 26 kidney organoids and those of human adult kidneys (blue). (D) Heatmaps showing motif enrichment changes along pseudotime of podocyte (POD, Left), proximal tubule (PT, Middle), and loop of Henle and distal nephron (LOH/DN, Right) lineages. (E) Transcription factor enrichment in the PT lineage cells at each time point. (F and G) Dynamics of gene expression (F, Left) and motif enrichment (F, Right) of the HNF1B gene and their target gene expression changes (G) along pseudotime.
Fig. 4.
Fig. 4.
Interference of the gene regulatory network of HNF1B inhibited PT differentiation. (A) Coverage plots showing ATAC peaks and gene expression level of HNF1B gene of the merged kidney organoid differentiation multiome dataset. Green box indicates promoter region; pink boxes indicate putative enhancer regions. (B) Corresponding integrative genomics viewer (IGV) images showing target sites of H3K4me3 (promoter, Upper), H3K27Ac (enhancer and promoter, Lower), and IgG (negative control) antibodies in CUT&RUN sequencing with day 26 organoid-derived proximal tubule (ORG_PT) and human adult kidney (HAK). (C) Schematic of HNF1B CRISPRi experiment. (D and E) qRT-PCR results of human primary RPTEC with CRISPRi for targeting promoter (D) and putative enhancer (E) regions of HNF1B. n = 3 biological replicates. The data are presented as mean ± SEM. * P < 0.05, ** P < 0.01. (F) qRT-PCR results of kidney organoid differentiation time course with CRISPRi targeting promoter and enhancer_2 regions of HNF1B. Control samples were treated with a dCAS9-KRAB vector without sgRNA. n = 4 biological replicates. The data are presented as mean ± SEM. (G) Immunofluorescence images of HNF1B (green), LTL (white), CAS9 (red), and nuclear DAPI (blue) staining in kidney organoids (day 26) with CRISPRi for HNF1B using control vector (dCAS9-KRAB without sgRNA, Left), sgRNA targeting promoter (Middle), and sgRNA targeting enhancer_2 (Right). (Scale bars indicate 50 µm). (H) Flow cytometry analyses showing LTL-positive cell proportions of kidney organoid (day 26) with CRISPRi for HNF1B using control vector (dCAS9-KRAB without sgRNA, Left), sgRNA targeting promoter (Middle), and sgRNA targeting enhancer_2 (Right). n = 4 biological replicates. The data are presented as mean ± SEM.

References

    1. Cockwell P., Fisher L.-A., The global burden of chronic kidney disease. Lancet 395, 662–664 (2020). - PubMed
    1. Cao J., et al. , Joint profiling of chromatin accessibility and gene expression in thousands of single cells. Science 361, 1380–1385 (2018). - PMC - PubMed
    1. Stuart T., et al. , Comprehensive integration of single-cell data. Cell 177, 1888–1902.e21 (2019). - PMC - PubMed
    1. Allaway K. C., et al. , Genetic and epigenetic coordination of cortical interneuron development. Nature 597, 693–697 (2021). - PMC - PubMed
    1. Fleck J. S., et al. , Inferring and perturbing cell fate regulomes in human brain organoids. Nature 1–8 (2022). - PMC - PubMed

Publication types