

Population Genomic Screening for Three Common Hereditary Conditions : A Cost-Effectiveness Analysis
- PMID: 37155986
- PMCID: PMC11791829
- DOI: 10.7326/M22-0846
Population Genomic Screening for Three Common Hereditary Conditions : A Cost-Effectiveness Analysis
Abstract
Background: The cost-effectiveness of screening the U.S. population for Centers for Disease Control and Prevention (CDC) Tier 1 genomic conditions is unknown.
Objective: To estimate the cost-effectiveness of simultaneous genomic screening for Lynch syndrome (LS), hereditary breast and ovarian cancer syndrome (HBOC), and familial hypercholesterolemia (FH).
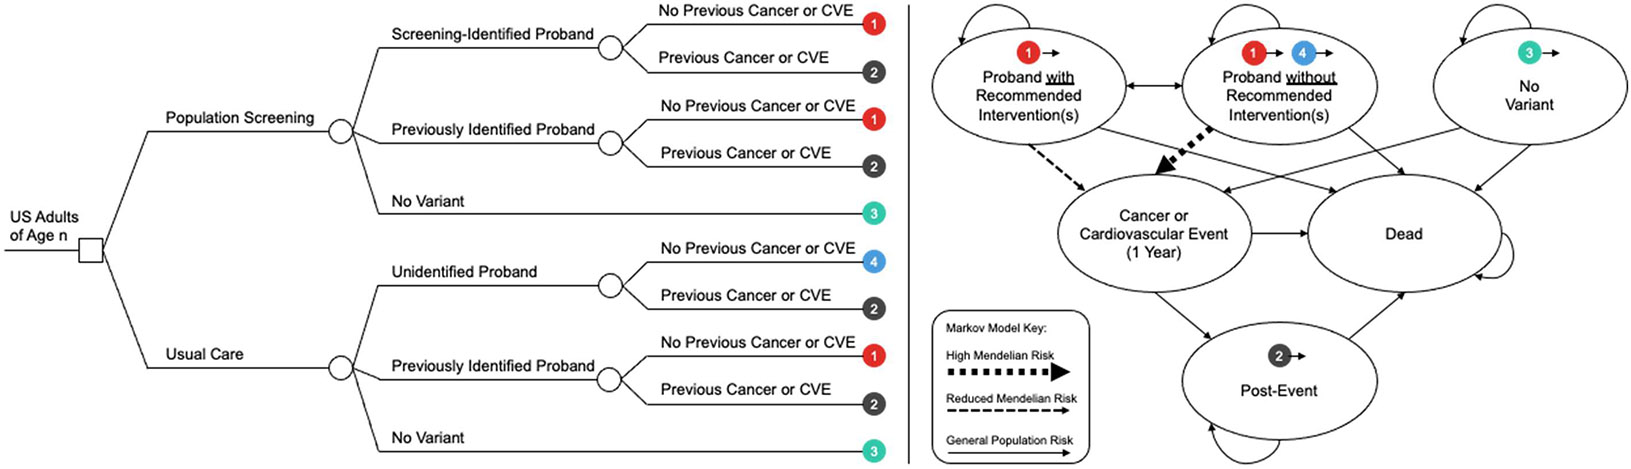
Design: Decision analytic Markov model.
Data sources: Published literature.
Target population: Separate age-based cohorts (ages 20 to 60 years at time of screening) of racially and ethnically representative U.S. adults.
Time horizon: Lifetime.
Perspective: U.S. health care payer.
Intervention: Population genomic screening using clinical sequencing with a restricted panel of high-evidence genes, cascade testing of first-degree relatives, and recommended preventive interventions for identified probands.
Outcome measures: Incident breast, ovarian, and colorectal cancer cases; incident cardiovascular events; quality-adjusted survival; and costs.
Results of base-case analysis: Screening 100 000 unselected 30-year-olds resulted in 101 (95% uncertainty interval [UI], 77 to 127) fewer overall cancer cases and 15 (95% UI, 4 to 28) fewer cardiovascular events and an increase of 495 quality-adjusted life-years (QALYs) (95% UI, 401 to 757) at an incremental cost of $33.9 million (95% UI, $27.0 million to $41.1 million). The incremental cost-effectiveness ratio was $68 600 per QALY gained (95% UI, $41 800 to $88 900).
Results of sensitivity analysis: Screening 30-, 40-, and 50-year-old cohorts was cost-effective in 99%, 88%, and 19% of probabilistic simulations, respectively, at a $100 000-per-QALY threshold. The test costs at which screening 30-, 40-, and 50-year-olds reached the $100 000-per-QALY threshold were $413, $290, and $166, respectively. Variant prevalence and adherence to preventive interventions were also highly influential parameters.
Limitations: Population averages for model inputs, which were derived predominantly from European populations, vary across ancestries and health care environments.
Conclusion: Population genomic screening with a restricted panel of high-evidence genes associated with 3 CDC Tier 1 conditions is likely to be cost-effective in U.S. adults younger than 40 years if the testing cost is relatively low and probands have access to preventive interventions.
Primary funding source: National Human Genome Research Institute.
Conflict of interest statement
Figures

Comment in
-
Population Genomic Screening for Three Common Hereditary Conditions.Ann Intern Med. 2023 Nov;176(11):eL230321. doi: 10.7326/L23-0321. Ann Intern Med. 2023. PMID: 37983802 No abstract available.
References
-
- Khoury MJ, McCabe LL, McCabe ER. Population screening in the age of genomic medicine. N Engl J Med. 2003;348:50–58. - PubMed
-
- Centers for Disease Control and Prevention. Tier 1 Genomics Applications and Their Importance to Public Health. 2014. Accessed at www.cdc.gov/genomics/implementation/toolkit/tier1.htm on 27 December 2019.
-
- Neumann PJ, Sanders GD, Russell LB, et al. Cost-Effectiveness in Health and Medicine. Oxford Univ Pr; 2016.
Publication types
MeSH terms
Grants and funding
LinkOut - more resources
Full Text Sources
Medical
Research Materials
Miscellaneous