. 2023 Jun;299(6):104797.
doi: 10.1016/j.jbc.2023.104797. Epub 2023 May 6.

Identification of novel coenzyme Q10 biosynthetic proteins Coq11 and Coq12 in Schizosaccharomyces pombe

Affiliations

Identification of novel coenzyme Q10 biosynthetic proteins Coq11 and Coq12 in Schizosaccharomyces pombe

Ikuhisa Nishida et al. J Biol Chem. 2023 Jun.

Abstract

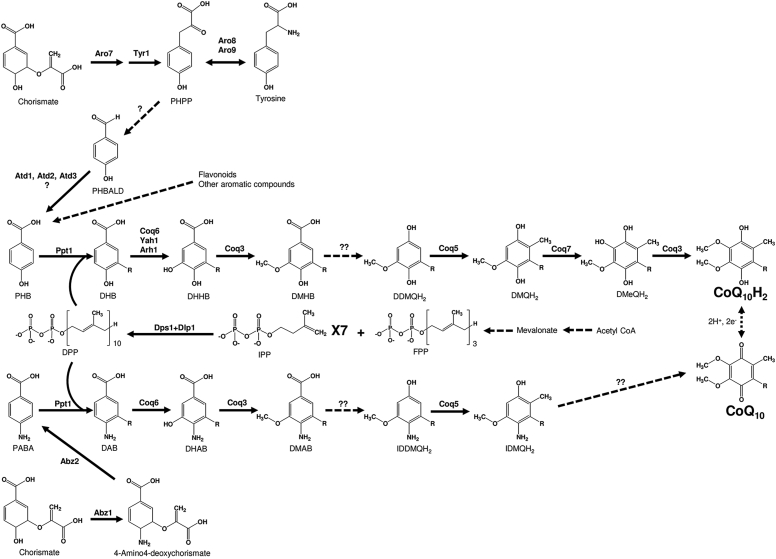
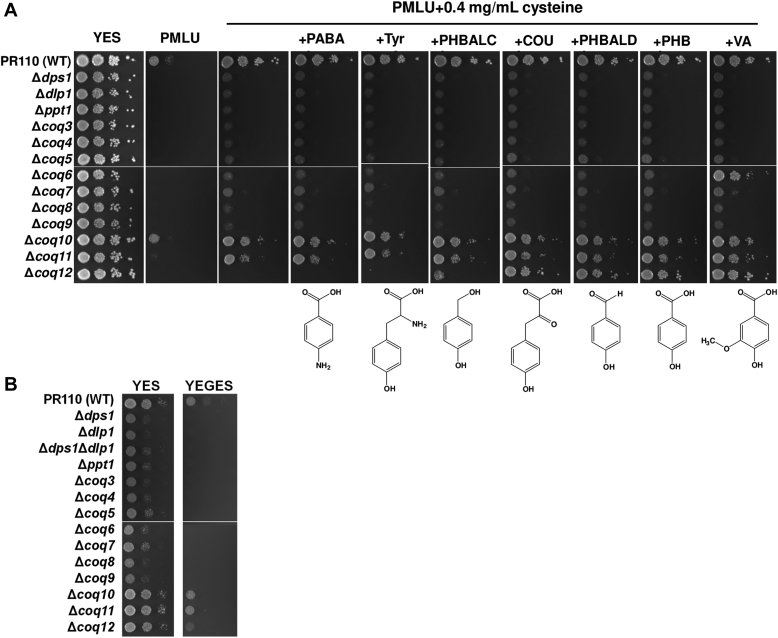
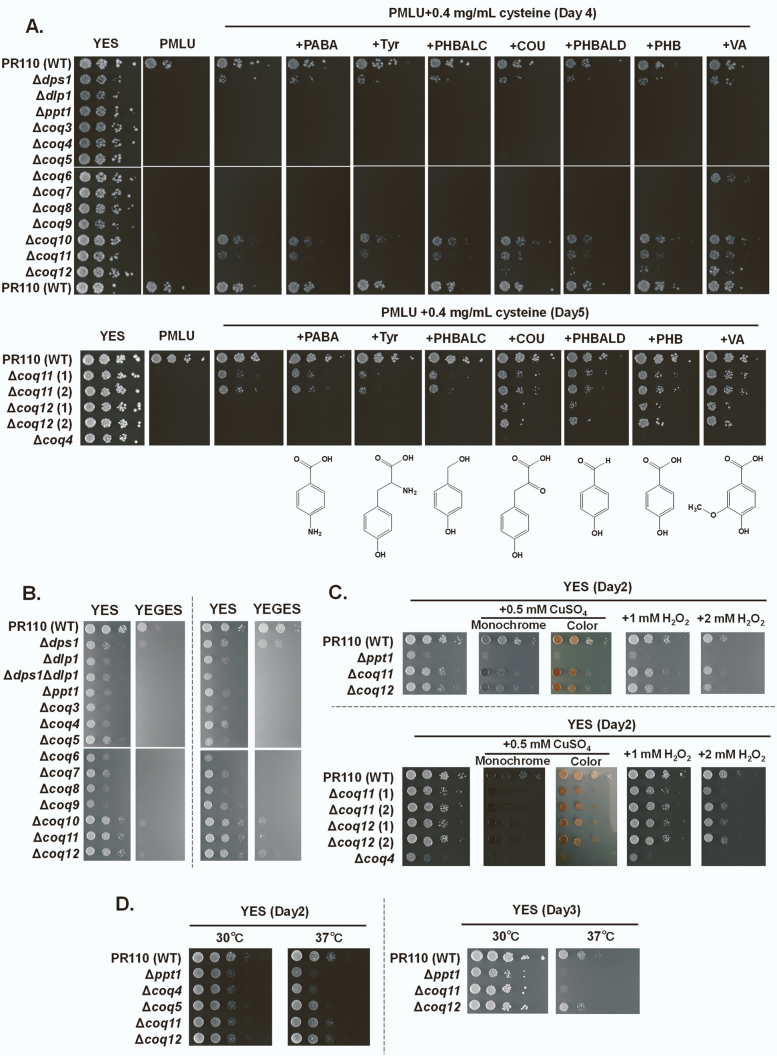
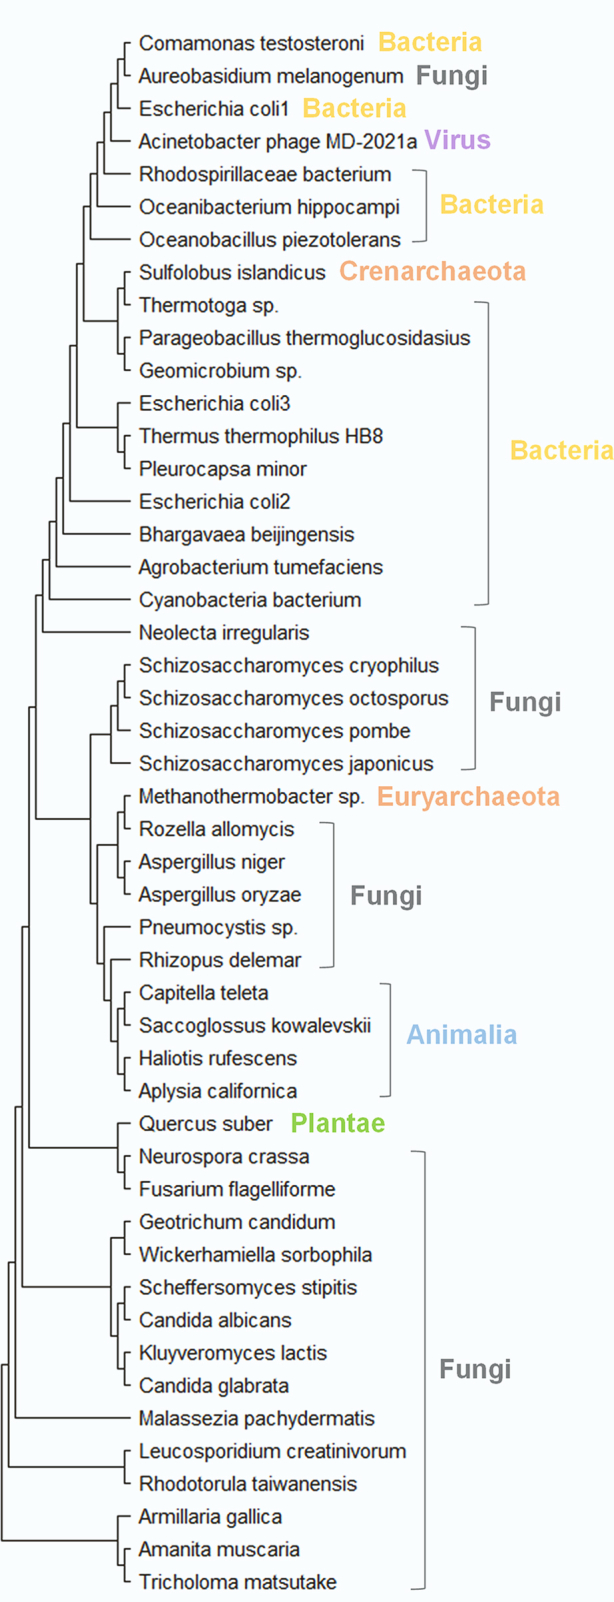
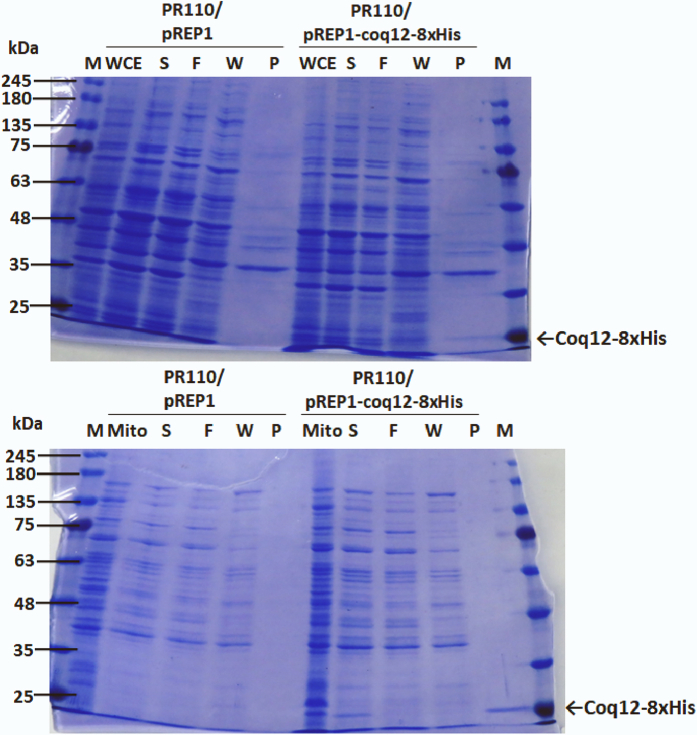
Coenzyme Q (CoQ) is an essential component of the electron transport system in aerobic organisms. CoQ10 has ten isoprene units in its quinone structure and is especially valuable as a food supplement. However, the CoQ biosynthetic pathway has not been fully elucidated, including synthesis of the p-hydroxybenzoic acid (PHB) precursor to form a quinone backbone. To identify the novel components of CoQ10 synthesis, we investigated CoQ10 production in 400 Schizosaccharomyces pombe gene-deleted strains in which individual mitochondrial proteins were lost. We found that deletion of coq11 (an S. cerevisiae COQ11 homolog) and a novel gene designated coq12 lowered CoQ levels to ∼4% of that of the WT strain. Addition of PHB or p-hydroxybenzaldehyde restored the CoQ content and growth and lowered hydrogen sulfide production of the Δcoq12 strain, but these compounds did not affect the Δcoq11 strain. The primary structure of Coq12 has a flavin reductase motif coupled with an NAD+ reductase domain. We determined that purified Coq12 protein from S. pombe displayed NAD+ reductase activity when incubated with ethanol-extracted substrate of S. pombe. Because purified Coq12 from Escherichia coli did not exhibit reductase activity under the same conditions, an extra protein is thought to be necessary for its activity. Analysis of Coq12-interacting proteins by LC-MS/MS revealed interactions with other Coq proteins, suggesting formation of a complex. Thus, our analysis indicates that Coq12 is required for PHB synthesis, and it has diverged among species.

Keywords: Coq11; Coq12; Schizosaccharomyces pombe; biosynthetic proteins; coenzyme Q(10); oxidoreductase; p-hydroxybenzoic acid.


Conflict of interest statement

Conflict of interest The authors declare that they have no conflicts of interest with the contents of this article.

Figures

Figure 1
Figure 1
Overview of the CoQ biosynthetic pathway in Schizosaccharomyces pombe. This figure illustrates the arrangement of CoQ biosynthetic and related proteins in the fission yeast and modified from the figure reported by Awad et al. (11). The CoQ biosynthetic pathway has been shown to involve at least 16 nuclear-encoded proteins that are necessary for mitochondrial CoQ biosynthesis in S. pombe. Black dotted arrows denote more than one step. Solid arrows denote a single step attributed to the corresponding yeast polypeptide named above each arrow. Yeasts synthesize p-hydroxybenzoic acid (PHB) or p-aminobenzoic acid (PABA) by de novo from chorismate. PHB may also be formed by the metabolism of tyrosine. S. pombe cells produce isopentenyl pyrophosphate (IPP) and dimethylally pyrophosphate (DMAPP) as precursors to form farnesyl diphosphate (FPP; n = 3). Decaprenyl diphosphate (DPP; n = 10) is synthesized from FPP and IPP via Dps1 + Dlp1 in the fission yeast. S. pombe Coq2/Ppt1 attach the polyisoprenyl tail to PHB or PABA. Subsequent to this step, the next three intermediates are identified as yeast decaprenyl intermediates: DHB, 3-decaprenyl-PHB; DHHB, 3-decaprenyl-4,5-dihydroxybenzoic acid; DMHB, 3-decaprenyl-4-hydroxy-5-methoxybenzoic acid. The next three intermediates are hydroquinones: DDMQH2, 2-decaprenyl-6-methoxy-1,4-benzenediol; DMeQH2, 2-decaprenyl-3-methyl-6-methoxy-1,4,5-benzenetriol; DMQH2, 2-decaprenyl-3-methyl-6-methoxy-1,4-benzenediol; to ultimately produce the final reduced product (CoQ10H2). Coq6 may require ferredoxin Yah1 (Etp1) and ferredoxin reductase Arh1 as in S. cerevisiae. It has been shown that PABA as an alternate ring precursor utilized by S. pombe(and it is suggested in humans). The next three intermediates are identified as yeast decaprenyl intermediates: DAB, 4-amino-3-decaprenylbenzoic acid; DHAB, 4-amino-3-decaprenyl-5-hydroxybenzoic acid; DMAB, 4-amino-3-decaprenyl-5-methoxybenzoic acid. The next two intermediates are IDDMQH2, 4-amino-3-decaprenyl-5-methoxyphenol and IDMQH2, 4-amino-3-decaprenyl-2-methyl-5-methoxyphenol. Unknown deamination step is involved in the PABA pathway. Interconversion of (CoQnH2) and (CoQn) is shown via a reversible two-electron reduction and oxidation. Steps indicated by “?” are catalyzed by unknown enzyme(s).
Figure 2
Figure 2
Growth phenotype of the Schizosaccharomyces pombe Δcoq11, Δcoq12, and other coq disruptants.A, effect of putative precursors upstream of quinone synthesis on the growth of Δcoq11, Δcoq12, and other coq disruptants was tested. Growth of the S. pombe WT strain PR110 and Δdps1, Δdlp1, Δppt1, Δcoq3, 4, 5, 6, 7, 8, 9, 10, 11, 12 with YES or PMLU base minimal media (225 mg/ml of leucine and uracil were added to the minimal media). About 100 μg/ml of each aromatic chemical was added if necessary). About 2.0 × 106 cells/ml of each strain and serial dilution of 10−1 to 10−4 (from left to right) were spotted onto the agar media and grew 4 days. B, growth phenotype of the coq disruptants on nonfermentable carbon source was also tested. The indicated strains were spotted onto YES (3% glucose) and YEGES (2% glycerol + 1% ethanol [w/v]). About 1 day-grown preculture was used for the assay. Absorbance of 2 at 600 nm of each strain and serial dilution of 10−1 to 10−2 (from left to right) were spotted onto the agar plates, and the photos were taken at 2 days (YES) or 8 days (YEGES). A similar trend was observed in the other dataset including previous study (10). COU, p-coumarate; cys, cysteine; PABA, p-aminobenzoic acid; PHB, p-hydroxybenzoic acid; PHBALC, p-hydroxybenzyl alcohol (gastrodigenin); PHBALD, p-hydroxybenzaldehyde; Tyr, tyrosine; VA, vanillic acid; YES, yeast extract with supplement.
Figure 3
Figure 3
Effect of various stresses in Schizosaccharomyces pombe WT, Δppt1, Δcoq11, and Δcoq12.S. pombe strains were spot onto YES or exhibited chemical additive media (CuSO4: 0.5 mM, H2O2: 1 mM or 2 mM). More than 1 day-grown preculture was used for the assay. Absorbance of 2 at 600 nm of each strain and serial dilution of 10−1 to 10−4 (from left to right) was spotted onto the agar media and grew 2 days at 30 °C or 37 °C. YES, yeast extract with supplement.
Figure 4
Figure 4
Comparison of hydrogen sulfide (H2S) concentration under various condition.Schizosaccharomyces pombe cells were grown in YES (WT PR110, Δcoq11, and Δcoq12) or YES with 100 μg/ml PHB (Δcoq11 and Δcoq12) for 28 h (late log phase), and H2S concentrations were measured by the method described previously (31). Data are represented as the mean ± SD of three measurements. The corresponding actual values are shown as plots. The exact p values on the bars denote statistically significant differences or approaching significance relative to samples from WT (Student’s t test). Diamonds show cell number (right vertical axis). PHB, p-hydroxybenzoic acid; YES, yeast extract with supplement.
Figure 5
Figure 5
Effect of PHB, PHBALC, PHBALD, and VA on CoQ10production of Δcoq12. WT (PR110) and Δcoq12 cells were cultivated for 48 h at 30 °C. The Δcoq12 cells were also cultivated in YES with 100 μg/ml PHBALC, PHBALD, PHB (A), or VA (B). Gray bars show the CoQ10 content per 50 ml of medium, and white bars show CoQ10 normalized by cell number (left vertical axis). Diamonds show cell number (right vertical axis). Five micrograms of CoQ6 was used as an internal standard. Data are represented as the mean ± SD of three measurements. The corresponding actual values are shown as plots. The exact p values on the bars denote statistically significant increase relative to samples from Δcoq12 (Student’s t test). PHB, p-hydroxybenzoic acid; PHBALC, p-hydroxybenzyl alcohol; PHBALD, p-hydroxybenzaldehyde; VA, vanillic acid; YES, yeast extract with supplement.
Figure 6
Figure 6
Overexpression of ubiC and its effect on the CoQ10production in Δcoq12. The WT PR110 and Δcoq12 (IN1) cells harboring pREP1 or pREP1-ubiC were cultivated in PMU medium for 72 h at 30 °C. Gray bars show the CoQ10 content per 50 ml of medium, and white bars show CoQ10 normalized by cell number. Diamonds show cell number. Five micrograms of CoQ6 was used as an internal standard. Data are represented as the mean ± SD of three measurements. The corresponding actual values are shown as plots. The exact p values on the bars denote statistically significant increase relative to samples from the Δcoq12/pREP1 (Student’s t test). PMU, Pombe minimal medium containing uracil but lacking leucine.
Figure 7
Figure 7
Expression level of Dlp1 and Coq4 in WT, Δcoq11, and Δcoq12.A, for the preculture, the yeast cells were cultivated in 10 ml YES for 1 day. Yeast cells were cultivated in 55 ml YES at an initial cell density of 1 × 106 cells/ml and cultivated for 24 h with rotation at 30 °C. Protein was extracted as experimental procedure. Each sample was subjected to 10% SDS-polyacrylamide gel electrophoresis and analyzed by immunoblotting using rabbit antibodies against Dlp1, Coq4, and Cdc2. Western blotting of Coq4 and Dlp1 in WT, Δcoq11, and Δcoq12. Dlp1, Coq4, and Cdc2 as a loading control for whole cells were analyzed by Western blotting. Target proteins are indicated on the right. The yeast strain and chemical additives in each lane are shown at the top. Lane 1, PR110 (WT); lane 2, PR110 (WT) +100 μg/ml benzoic acid; lane 3, WT +100 μg/ml PHB; lane 4, RYP26 (Δcoq11); lane 5, IN1 (Δcoq12); and lane 6, IN1 (Δcoq12) + 100 μg/ml PHB. The amount of proteins was quantified by ImageJ, and relative Dlp1 and Coq4 levels (Dlp1/Cdc2 and Coq4/Cdc2) were calculated. A similar trend was observed in our separate experiments (Fig. S3). B, data are represented as the mean ± SD of four (Dlp1/Cdc2) or three (Coq4/Cdc2) measurements. The corresponding actual values are shown as plots. The exact p values are shown relative to the blots of PR110 (WT) (Student’s t test). PHB, p-hydroxybenzoic acid; YES, yeast extract with supplement.
Figure 8
Figure 8
Subcellular localization of Coq12-GFP by fluorescent microscopy.A, differential interference contrast image (DIC), MitoTracker signals (Mito), and GFP signals (Coq12-GFP) are shown. The scale bar represents 10 μm. B, complementation assay of coq12-GFP. For the preculture, Δcoq12 (IN1) cells harboring pSLF172LGFPS65A (vector) or pSLF172L-coq12-GFP were cultivated in 10 ml PMU medium 1 day. The yeast cells were cultivated in 55 ml PMU medium (starting concentration was approximately 1 × 105 cells/ml) and cultivated for about 3 days with rotation at 30 °C. Data are represented as the mean ± SD of two (vector) and four (Coq12-GFP) measurements. The corresponding actual values are shown as plots. The exact p values on the bars denote statistically significant increase relative to samples from the vector control (Student’s t test). PMU, Pombe minimal containing uracil but lacking leucine.
Figure 9
Figure 9
Enzymatic activity of purified Coq12. Coq12-8xHis (expressed in Schizosaccharomyces pombe and purified (A)) or 6xHis-Coq12 (expressed in Escherichia coli and purified (B)). Yeast cell extract from WT or Δcoq12 reacted with NAD+ and NADH formation was evaluated. Activities on various substrates were determined as described in the Experimental procedures section. The absorbance was measured at 339 nm at the indicated time course. A, the absorbance at 0, 3, 5, and 20 min shows the average of two sets of data. B, the absorbance at 0, 3, 5, 10, and 20 min shows the average of two sets of data.
Figure S1
Figure S1
Reproducibility ofFigure 2 and 3 experiments.A, the experiment was similarly performed as Figure 2A. Growth of the S. pombe Growth of the S. pombe wild-type strain PR110 and Δdps1, Δdlp1, Δppt1, Δcoq3, 4, 5, 6, 7, 8, 9, 10, 11, 12: upper panel; or PR110, Δcoq11, 12, and 4 (for Δcoq11 and 12, two independent single colonies were used): lower panel with YES or PMLU base minimal media (PMLU75: 75 mg/ml of leucine and uracil were added to the minimal media). 100 μg/ml of each aromatic chemical was added if necessary. 2.0 × 106 cells/ml of each strain and serial dilution of 10−1 to 10−3 (from left to right) were spotted onto the agar media and grew 4 or 5 days. B, the experiments were similarly performed as Figure 2B. The strains used in Figure 2B were spotted onto YES (3% glucose) or YEGES (2% glycerol + 1% ethanol (w/v)). OD600 = 2 of each strain and serial dilution of 10−1 to 10−2 (from left to right) were spotted onto the agar plates and the photos were taken at 2 (YES) or 8 days (YEGES). C, the experiments were similarly performed as Figure 3 or A. Strains were spotted onto YES or chemical additive media (CuSO4: 0.5 mM, H2O2: 1 mM or 2 mM). OD600 = 2 of each strain and serial dilution of 10−1 to 10−3 (from left to right) were spotted onto the agar plates and the photos were taken at 2 days. For the CuSO4 plate, monochrome and color images are taken. D, the experiment was similarly performed as Figure 3. Growth of the S. pombe wild-type strain PR110, Δppt1, Δcoq4, Δcoq5, Δcoq11, and Δcoq12 on YES (left panel) or PR110, Δppt1, Δcoq11, and Δcoq12 on YES (right panel). OD600 = 2 of each strain and serial dilution of 10−1 to 10−4 (from left to right) were spotted onto the agar plates and grew for two days at 30 °C and ∼37 °C (left panel) or 3 days at 30 °C and 37 °C (right panel).
Figure S2
Figure S2
Effect of various aromatic compounds on CoQ10production in Δcoq12. WT PR110 and Δcoq12 (IN1) cells were pre-cultivated in 10 ml YES medium for 1 day. Cells at an initial density of ∼1 × 105 cells/ml were cultivated in the presence of aromatic compounds, with rotation at 30 °C. Gray bars show the CoQ10 content per 50 ml of medium, and white bars show CoQ10 normalized by cell number. Diamonds show cell number. Five micrograms of CoQ6 was used as an internal standard. A, indicated amount of PABA was added to the medium of growing the WT or Δcoq12 cells. Data are represented as the mean ± SD of three measurements. The corresponding actual values are shown as plots. B, 1 mg/ml of PHB, p-coumarate, 3,4-dihydroxyphenylacetic acid, DL-p-hydroxymandelic acid, p-hydroxyphenylacetic acid, or 2-hydroxy-3-methoxybenzoic acid, or 0.5 mg/ml of 2-methoxyhydroquinone was added to the medium of growing Δcoq12 cells. Data are represented as the mean ± SD of six (WT in YES or Δcoq12 in YES), four (Δcoq12 in YES +PHB), three (Δcoq12 in YES +p-coumarate), or two (Δcoq12 in YES +3,4-dihydroxyphenylacetic acid, 2-methoxyhydroquinone, DL-p-hydroxymandelic acid, p-hydroxyphenylacetic acid, or 2-hydroxy-3-methoxybenzoic acid) measurements. The corresponding actual values are shown as plots. The exact p values on the bars denote statistically significant increase relative to samples from the Δcoq12 grown in YES (Student’s t-test). C, 200 μg/ml of PABA, L-tyrosine, 4-amino-2-methoxybenzoic acid, 4-amino-2-methoxy phenol, m-anisidine hydrochloride, 4-aminosalicylic acid (4-amino-2-hydroxybenzoic acid), 3-amino-4-hydroxybenzoic acid, 4-amino-3-hydroxybenzoic acid, or 4-amino-3-methoxybenzoic acid was added to the medium of growing Δcoq12 cells. Data are represented as the mean ± SD of three (WT in YES or Δcoq12 in YES), or two (Δcoq12 in YES +the amino group containing aromatic compounds) measurements. The corresponding actual values are shown as plots. The exact p values on the bars denote statistically significant increase relative to samples from the Δcoq12 grown in YES (Student’s t-test). D, 1 mg/ml of 3-amino-4-hydroxybenzoic acid was added to the medium of growing Δcoq12 cells. Data are represented as the mean ± SD of four (Δcoq12 in YES), or three (Δcoq12 in YES +3-amino-4-hydroxybenzoic acid) measurements. The corresponding actual values are shown as plots. The exact p values on the bars denote statistically significant increase relative to samples from the Δcoq12 grown in YES (Student’s t-test). E, 100 μg/ml of PHPP (p-hydroxyphenylpyruvate) was added to the medium of growing the WT or Δcoq12 cells. Data are represented as the mean ± SD of two measurements. The corresponding actual values are shown as plots. The exact p values on the bars denote statistically significant increase relative to samples from the Δcoq12 grown in YES (Student’s t-test). E, 100 μg/ml of quercetin, naringenin, or kaempferol was added to the medium of growing the Δcoq12 cells (upper graph: Oxoid Yeast Extract Lot No. 4325105-02, lower graph: Lot No. 2198213–02). Data are represented as the mean ± SD of two measurements. The corresponding actual values are shown as plots. The exact p values on the bars denote statistically significant increase relative to samples from the Δcoq12 grown in YES (Student’s t-test).
Figure S3
Figure S3
Reproducibility ofFigure 7experiments. The experiments were similarly performed as Figure 7. Western blotting of Coq4 and Dlp1 in WT, Δcoq11 and Δcoq12. Dlp1, Coq4 and Cdc2 as a loading control for whole cells were analyzed by Western blotting. Target proteins are indicated on the right. The yeast strain and chemical additives in each lane are shown at the top. Lane 1, PR110 (WT); lane 2, PR110 (WT) +100 μg/ml Benzoic acid (Bz); lane 3, WT +100 μg/ml PHB; lane 4, RYP26 (Δcoq11); lane 5, RYP26 (Δcoq11) +100 μg/ml PHB; lane 6, IN1 (Δcoq12); lane 7, IN1 (Δcoq12) +100 μg/ml PHB. The amount of proteins were quantified by Image J, and relative Dlp1 and Coq4 levels (Dlp1/Cdc2 and Coq4/Cdc2) were calculated and used for making the graph of Figure 7B.
Figure S4
Figure S4
Overexpression of several coq genes and their effect on the CoQ10production in Δcoq12.A, the WT PR110 cells harboring pREP1 and Δcoq12 (IN1) cells harboring pREP1, pREP1-coq4, pREP1-coq5, pREP1-coq8, pREP1-coq11, or pREP1-coq12-8xHis were pre-cultivated in 5 ml medium one day (PMU + 0.32 mg/ml cysteine + 0.15 μM thiamine). The yeast cells were cultivated in 55 ml PMU + 0.32 mg/ml cysteine + 0.15 μM thiamine (starting concentration was approx. 1 × 105 cells/ml) and cultivated for 2 days with rotation at 30 °C. Data are represented as the mean ± SD of three measurements. The corresponding actual values are shown as plots. The exact p values on the bars denote statistically significant increase relative to samples from the Δcoq12/pREP1 (Student’s t-test). B, the WT PR110 cells harboring pREP1 and Δcoq11 (RYP26) cells harboring pREP1, or pREP1-coq11 were pre-cultivated in 5 ml medium one day (PMU (WT) or PMU 0.32 mg/ml cysteine +0.15 μM thiamine (Δppt1)). The yeast cells were cultivated in 55 ml PMU or PMU + 0.32 mg/ml cysteine +0.15 μM thiamine (starting concentration was ∼5 × 105 cells/ml) and cultivated for 2 days with rotation at 30 °C. Data are represented as the mean ± SD of three (WT/pREP1 and Δcoq11/ pREP1) or two (Δcoq11/ pREP1-coq11) measurements. The corresponding actual values are shown as plots. The exact p values on the bars denote statistically significant increase relative to samples from the Δcoq11/pREP1 (Student’s t-test).
Figure S5
Figure S5
Putative domain structure of Coq12 and related proteins.A, the Coq12 ortholog HpaC reductase, works with HpaB oxygenase to form 3,4-dihydroxyphenylacetate; RutF reductase works with RutA to form ureidoacrylate in their redox reaction. The MTS is predicted from the length of purified Coq12-8xHis and the iPSORT Prediction web site. Coq12 might also work with putative oxygenase(s). The enzymatic function of Coq12 was estimated by the NCBI Conserved Domain Search. The number of amino acid residues for each protein is shown. B, alignment of amino acid sequences of S. pombe Coq12 (244 amino acid) and the ortholog proteins. The coq12 orthologs of the Schizosaccharomyces cryophilus OY26, Schizosaccharomyces octosporus yFS286, Schizosaccharomyces japonicus yFS275, Aspergillus oryzae RIB40, Kluyveromyces lactis NRRL Y-1140, Candida glabrata CBS 138, and Neurospora crassa OR74A were predicted to encode 235, 260, 279, 279, 221, 215, and 357 amino acid proteins, respectively, and these exhibited 77%, 72%, 58%, 48%, 47%, 44%, and 39% sequence similarity to S. pombe Coq12. Amino acid residues that are identical in five or more sequences are indicated by black boxes. Hyphens indicate the absence of corresponding amino acid residues at those positions. Highly conserved in PNPOx/FlaRed_like superfamily is gray underlined. Sequences were aligned using Expresso in T-Coffee Server, which aligns protein sequences using structural information. UniProt IDs are follows: S. pombe Coq12, Q9UTQ4; S. cryophilus, S9VZB0; S. octosporus, S9PXR8; S. japonicus, B6JYK7; A. oryzae, Q2UUH8; K. lactis, Q6CQQ9; C. glabrata, Q6FTE2; N. crassa, Q1K7L6.
Figure S6
Figure S6
Phylogeny of Coq12. Phylogenetic tree of Coq12 and the 47 reductase proteins found in eukaryotes, prokaryotes, or a virus. Homologous proteins of Coq12 were collected via NCBI Blast, then the aligned sequence matrix was imported into MEGA11 and analyzed in the Tree Explorer. Classification of kingdom or domain of organisms (or virus) are shown on the right side.
Figure S7
Figure S7
Confirmation of the purified Coq12-8xHis. Each sample was subjected to 10.5% SDS–polyacrylamide gel electrophoresis and analyzed by CBB staining. A, whole-cell protein profiles were confirmed by CBB staining. The protein was extracted from vector control PR110/pREP1 or Coq12-8xHis expressing cell PR110/pREP1-coq12-8xHis and purified with Ni-NTA Agarose. Fractions: WCE (whole-cell extract), S (supernatant) (cell-free extract), F (flow through), W (wash fraction), P (purified). Arrow indicates the estimated Coq12-8xHis band. M: size marker. B, isolated mitochondria protein profiles were confirmed by CBB staining. The protein was extracted from vector control PR110/pREP1 or Coq12-8xHis expressing cell PR110/pREP1-coq12-8xHis and purified with Ni-NTA Agarose. Fractions: Mito (isolated crude mitochondria), S (supernatant) (water soluble fraction of mitochondria), F (flow through), W (wash fraction), P (purified). Arrow indicates the estimated Coq12-8xHis band. M: size marker
Figure S8
Figure S8
Candidate of Coq12 interacting proteins. These volcano plot illustrates significantly differentially abundant proteins. “Whole None” and “Whole Coq12-His” or “Mitochondria None” and “Mitochondria Coq12-His” were compared and abundant protein in Coq12-His group were selected. Coq12 interacting candidate proteins are shown upper right of each figure and exhibited by red font.
Figure S9
Figure S9
Structure of the putative CoQ biosynthetic enzyme complex and the estimated location of Coq12 in S. pombe. Notes: The enzymes involved in CoQ synthesis form a complex in S. cerevisiae (13) and this study. This figure illustrates the arrangement of CoQ biosynthetic and related proteins in the fission yeast and modified from the figure reported by Kawamukai (8). Proteins in the figure are not proportional to the actual molecular sizes. Some of the structure of Coq ortholog proteins are shown: Aeropyrum pernix UbiA (PDB entity: 4OD5) is shown as a Coq2/Ppt1 homolog, E. coli UbiG (PDB entity: 4KDC) is shown as a Coq3 homolog, Alr8543 from Nostoc sp. PCC7120 (PDB entity: 6E12) is shown as a Coq4 homolog, homologous proteins S. cerevisiae Coq5 (PDB entity: 4OBX) is shown as a Coq5 homolog, E. coli UbiI (PDB entity: 4K22) is shown as a Coq6 homolog, human ADCK3 (PDB entity: 4PED) is shown as a Coq8 homolog, human COQ7 and COQ9 complex (PDB entity: 7SSP) is shown as Coq7 and Coq9 homolog, and HpaC from Thermus thermophilus HB8 (PDB entity: 2ECR) is shown as a Coq12 homolog. Dps1+Dlp1 form heterotetrametric structure and it is separated from the main complex. A nonaprenyl diphosphate synthase (NDS) from Rhodobacter capsulatus (PDB entity: 3MZV) is shown as a Dps1 homolog. Coq2/Ppt1 spans the inner membrane. In S. cerevisiae, the positions of the other proteins have not been defined experimentally, although Coq4 seems to be in the center, and Coq7:Coq9 and Coq8 seem to be located at the edge of the complex. The PDB files were opened and edited by UCSF ChimeraX.
Figure S10
Figure S10
Putative CoQ biosynthetic pathways in the yeast S. pombe. Predicted Coq12 function and related aromatic compounds are shown. Coq12 is thought to be involved in an unknown metabolic process upstream of PHB. Coq12 may have a secondary role in Coq6 mediated hydroxylation step of PABA pathway. p-hydroxybenzoic acid (PHB), p-hydroxybenzaldehyde (PHBLD), p-coumarate, p-hydroxyphenylpyruvate (PHPP), Kaempferol, Vanillic acid, DL-p-hydroxymandelate, 3-amino-4-hydroxybenzoic acid, 4-amino-3-hydroxybenzoic acid, or 4-amino-3-methoxybenzoic acid restored CoQ10 level in coq12 disruptant.

References

    1. Crane F.L. The evolution of coenzyme Q. Biofactors. 2008;32:5–11. - PubMed
    1. Bentinger M., Tekle M., Dallner G. Coenzyme Q--biosynthesis and functions. Biochem. Biophys. Res. Commun. 2010;396:74–79. - PubMed
    1. Kawamukai M. Biosynthesis and applications of prenylquinones. Biosci. Biotechnol. Biochem. 2018;82:963–977. - PubMed
    1. Kawamukai M. Biosynthesis, bioproduction and novel roles of ubiquinone. J. Biosci. Bioeng. 2002;94:511–517. - PubMed
    1. Kawamukai M. Biosynthesis and bioproduction of coenzyme Q10 by yeasts and other organisms. Biotechnol. Appl. Biochem. 2009;53:217–226. - PubMed

Publication types

MeSH terms