. 2023 May 8;13(1):7445.
doi: 10.1038/s41598-023-34508-x.

Active fixation as an efficient coding strategy for neuromorphic vision

Affiliations

Active fixation as an efficient coding strategy for neuromorphic vision

Simone Testa et al. Sci Rep. .

Abstract

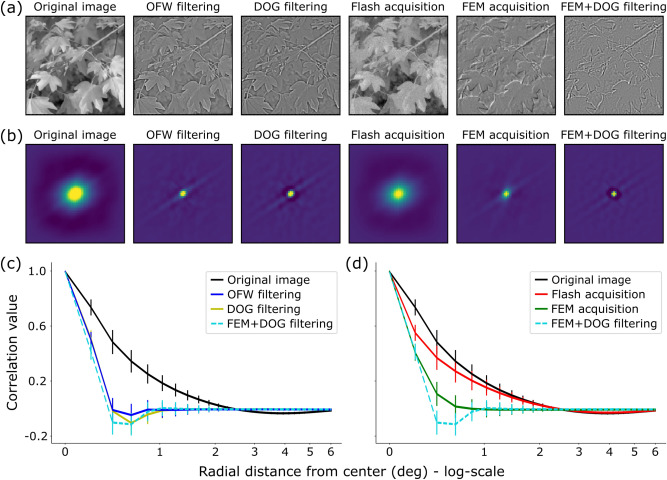
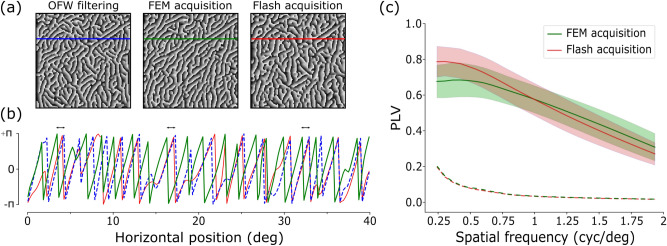
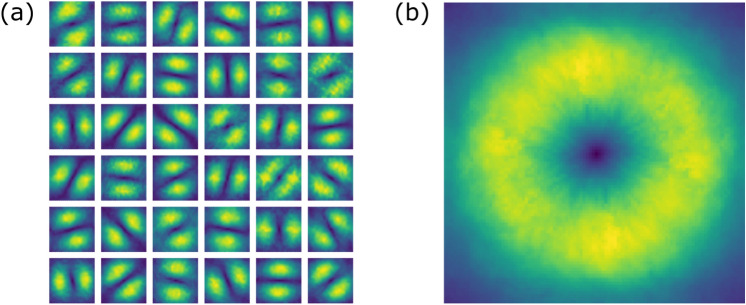
Contrary to a photographer, who puts a great effort in keeping the lens still, eyes insistently move even during fixation. This benefits signal decorrelation, which underlies an efficient encoding of visual information. Yet, camera motion is not sufficient alone; it must be coupled with a sensor specifically selective to temporal changes. Indeed, motion induced on standard imagers only results in burring effects. Neuromorphic sensors represent a valuable solution. Here we characterize the response of an event-based camera equipped with fixational eye movements (FEMs) on both synthetic and natural images. Our analyses prove that the system starts an early stage of redundancy suppression, as a precursor of subsequent whitening processes on the amplitude spectrum. This does not come at the price of corrupting structural information contained in local spatial phase across oriented axes. Isotropy of FEMs ensures proper representations of image features without introducing biases towards specific contrast orientations.


Conflict of interest statement

The authors declare no competing interests.

Figures

Figure 1
Figure 1
Characterization of the proposed model. (a) Simulated showcase of a FEM sequence obtained by our modified version of the SAW model. Black line represents an example of FEM trajectory with 80 steps. The FEM path is superimposed on its activation field, where the greenish shades of blue indicate lower activation values: the circular shape reveals the region of the foveola in which FEMs are confined. (b) Temporal evolution of the mean squared (spatial) displacement (in arcmin2) as a function of the time lag (in number of model iterations, i.e. FEM steps). (c) The distance covered by the walker during a specific FEM sequence (specific seed) is shown at the top (interpolation over 60 FEM steps). The (smoothed) instantaneous firing rate of the DVS (averaged across 16 different recordings) is visualized underneath, sampled at all 60 steps and interpolated. Signals are shown only for the time window of fixational eye movements.
Figure 2
Figure 2
Amplitude information analysis. (a) Effects of different “frame-based” whitening procedures compared to “event-based” counterparts, and their combination. A data sample from the van Hateren dataset (cropped and down-sampled to 200×200) is shown in the left-most image. The two consecutive frames represent results from standard whitening techniques, while the next two images are reconstructed from event-based recordings by either flashing the stimulus on the monitor or shaking the camera with FEM-based sequences. The cascade of a DOG band-pass filtering on the FEM-based reconstructed frame is shown in the right-most image. All axes range from -20 deg to 20 deg. (b) Two-dimensional auto-correlations of the images in panel (a) with matching positions. Axes range from -6 deg to 6 deg. (c, d) Comparison of the azimuthal-averaged profiles of the 2D auto-correlations. Each curve represents mean and standard deviation across the whole set of natural images, also averaged across FEM seeds (or flash trials) in case of event-based acquisitions. For the sake of clearness, we split in (c) the results from standard whitening techniques (blue and yellow lines) while in (d) the results from reconstructed images of both event-based acquisitions (red and green lines). The average correlation profile of the original image (black line) and the combination of FEM effects with DOG filtering (dashed light-blue line) are displayed in both panels for comparison.
Figure 3
Figure 3
Phase information analysis. (a) Results of the dominant local phase extracted at 0.5 cyc/deg from three images in Fig. 2a. Axes range from -20 deg to 20 deg. (b) Mono-dimensional view of the dominant local phase extracted at a specific row. Colors of the curves match those of horizontal lines superimposed on the top three images: phase from FEM (green) and flash (red) acquisitions must be compared to that from the reference whitening procedure (dashed blue). Double-head arrows on top of the curves point out some examples of the roughly-constant phase shift between the reference and FEM-based image, yet not affecting the conservation of phase structure. (c) Distribution of the PLV for different spatial frequencies. The mean PLV (with respect to the OFW-filtered image) are shown with green and red lines for the FEM-based and flash-based signals respectively. Standard deviations are visible as shaded areas. Dashed curves represent the statistical significance level (95-percentile confidence interval) obtained by the PLV distribution of the surrogates for both FEM- (green) and flash-based (red) images.
Figure 4
Figure 4
Effect of motion (an)isotropy on DVS response. (a) Comparison of the mean firing rate over the sensor area evoked by 30 biased motion sequences (blue) and SAW-based isotropic (black) FEMs. The right insets represent examples of anisotropic (blue) and isotropic (black) trajectories on the top, and their corresponding circular histograms on the bottom. (b, c) Same as (a) but for 60 and 90 bias, respectively.
Figure 5
Figure 5
Equivalent FEM spatial filters. (a) Examples of the anisotropic filters in Fourier domain achieved from single FEM steps at a given seed and averaged across all natural image stimuli. (b) Overall isotropic filter obtained by averaging across the whole FEM sequence.
Figure 6
Figure 6
System setup for FEM-based visual acquisition. (a) Left panel: the setup used for collecting data, as viewed from the user. We can identify the workstation for controlling all acquisitions, a utility display, and the enclosure in which the recordings are conducted. Right panel: inside view of the enclosure showing the DAVIS device, the PTU and the stimulation screen. (b) Contour lines of a sample activation field from our proposed version of the SAW model. The circular region of the foveola is delimited by lower activation values. The zoomed-up panel on the right comparatively illustrates the mechanism for deciding subsequent FEM steps of the original SAW model and our modified version. Gray-filled spots depict the history of a FEM sequence, with the final (current) lattice site shown in black. In the original model, the grid spot with the lowest activation value among the red-filled spots was chosen as the arrival site of the current step. In our model, instead, the choice is among all the light-green lattice sites.
Figure 7
Figure 7
Trend of the mutual information between FEM-based reconstructed frames and corresponding natural images as a function of the time interval T. Blue lines show such trend for all six FEM seeds, the solid gray line the average across all seeds and the black dashed line its fitting. The dashed vertical black line represents the detected elbow point of the curve, i.e. the chosen time interval for frame generation (see text).

References

    1. Martinez-Conde S, Macknik SL, Hubel DH. The role of fixational eye movements in visual perception. Nat. Rev. Neurosci. 2004;5:229–240. doi: 10.1038/nrn1348. - DOI - PubMed
    1. Mead C. Neuromorphic electronic systems. Proc. IEEE. 1990;78:1629–1636. doi: 10.1109/5.58356. - DOI
    1. Lichtsteiner P, Posch C, Delbruck T. A 128 × 128 120 db 15 μs latency asynchronous temporal contrast vision sensor. IEEE J. Solid-State Circuits. 2008;43:566–576. doi: 10.1109/JSSC.2007.914337. - DOI
    1. Mead CA, Mahowald MA. A silicon model of early visual processing. Neural Netw. 1988;1:91–97. doi: 10.1016/0893-6080(88)90024-X. - DOI
    1. Rucci M, Poletti M. Control and functions of fixational eye movements. Ann. Rev. Vis. Sci. 2015;1:499–518. doi: 10.1146/annurev-vision-082114-035742. - DOI - PMC - PubMed

Publication types