. 2023 Jun;14(3):476-488.
doi: 10.1007/s13239-023-00667-1. Epub 2023 May 8.

Optimization of 4D Flow MRI Spatial and Temporal Resolution for Examining Complex Hemodynamics in the Carotid Artery Bifurcation

Affiliations

Optimization of 4D Flow MRI Spatial and Temporal Resolution for Examining Complex Hemodynamics in the Carotid Artery Bifurcation

Retta El Sayed et al. Cardiovasc Eng Technol. 2023 Jun.

Abstract

Background: Three-dimensional, ECG-gated, time-resolved, three-directional, velocity-encoded phase-contrast MRI (4D flow MRI) has been applied extensively to measure blood velocity in great vessels but has been much less used in diseased carotid arteries. Carotid artery webs (CaW) are non-inflammatory intraluminal shelf-like projections into the internal carotid artery (ICA) bulb that are associated with complex flow and cryptogenic stroke.

Purpose: Optimize 4D flow MRI for measuring the velocity field of complex flow in the carotid artery bifurcation model that contains a CaW.

Methods: A 3D printed phantom model created from computed tomography angiography (CTA) of a subject with CaW was placed in a pulsatile flow loop within the MRI scanner. 4D Flow MRI images of the phantom were acquired with five different spatial resolutions (0.50-2.00 mm3) and four different temporal resolutions (23-96 ms) and compared to a computational fluid dynamics (CFD) solution of the flow field as a reference. We examined four planes perpendicular to the vessel centerline, one in the common carotid artery (CCA) and three in the internal carotid artery (ICA) where complex flow was expected. At these four planes pixel-by-pixel velocity values, flow, and time average wall shear stress (TAWSS) were compared between 4D flow MRI and CFD.

Hypothesis: An optimized 4D flow MRI protocol will provide a good correlation with CFD velocity and TAWSS values in areas of complex flow within a clinically feasible scan time (~ 10 min).

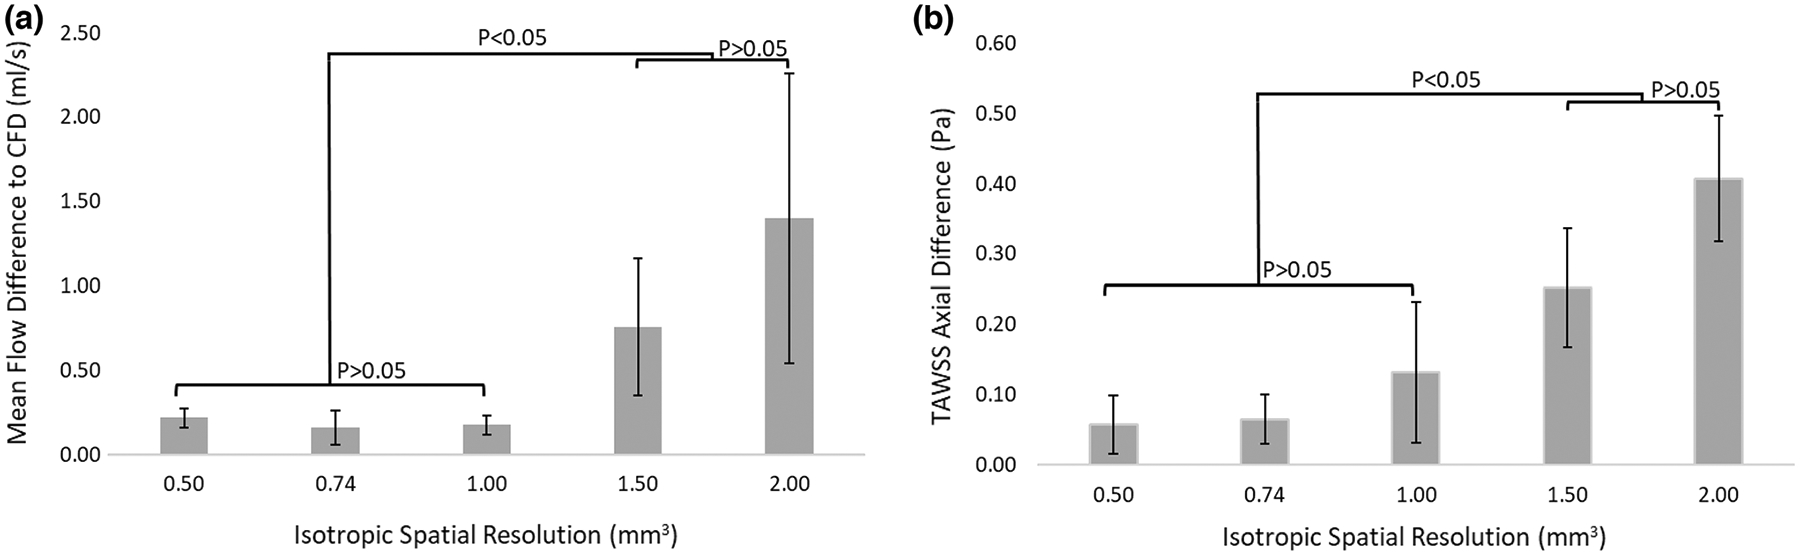
Results: Spatial resolution affected the velocity values, time average flow, and TAWSS measurements. Qualitatively, a spatial resolution of 0.50 mm3 resulted in higher noise, while a lower spatial resolution of 1.50-2.00 mm3 did not adequately resolve the velocity profile. Isotropic spatial resolutions of 0.50-1.00 mm3 showed no significant difference in total flow compared to CFD. Pixel-by-pixel velocity correlation coefficients between 4D flow MRI and CFD were > 0.75 for 0.50-1.00 mm3 but were < 0.5 for 1.50 and 2.00 mm3. Regional TAWSS values determined from 4D flow MRI were generally lower than CFD and decreased at lower spatial resolutions (larger pixel sizes). TAWSS differences between 4D flow and CFD were not statistically significant at spatial resolutions of 0.50-1.00 mm3 but were different at 1.50 and 2.00 mm3. Differences in temporal resolution only affected the flow values when temporal resolution was > 48.4 ms; temporal resolution did not affect TAWSS values.

Conclusion: A spatial resolution of 0.74-1.00 mm3 and a temporal resolution of 23-48 ms (1-2 k-space segments) provides a 4D flow MRI protocol capable of imaging velocity and TAWSS in regions of complex flow within the carotid bifurcation at a clinically acceptable scan time.

Keywords: 4D flow MRI; Carotid web; Phantom model; Spatial resolution; Temporal resolution.


Conflict of interest statement

Conflict of interest The authors declare no conflict or financial interests in this manuscript.

Figures

Fig. 1
Fig. 1
Fabrication of the CaW Phantom Model. a The CTA images of a patient diagnosed with CaW (red arrow). b The 3D image (.stl file) of the segmented model from the CTA images. Highlighted in the gray background is an Overview of the flow system and phantom model. c 3D printed phantom model placed in between the surface coil and body coil in a 3.0 T MRI scanner. d The in-house built pulsatile flow pump. e) LabVIEW control interface for the flow pump. f Glycerin: Water fluid reservoir
Fig. 2
Fig. 2
Overview of 4D Flow and CFD processing methods. a 4D flow MRI methods (blue background) use the MATLAB base program for preprocessing the DICOM MRA images, materialize Mimics used for the segmentation, and EnSight for streamlines generation and 2D cross-section extraction. b CFD processing methods (gray background) geometry segmentation and smoothing using materialize mimics and 3-Matics, fluent for meshing and running CFD simulations using inlet mean velocity waveform from PCMR data. c CFD and 4D flow MRI were compared at four cross-sections perpendicular to the vessel centerline. d 2D Cross-sections extracted: CCA 10 mm below the bifurcation, ICA 10 mm, ICA 15 mm, and ICA 20 mm above the bifurcation. e Velocity profile of a cross-section. f The WSS vectors at the twelve sectors across the corresponding cross-section
Fig. 3.
Fig. 3.
3D Axial velocity profile based on 4D flow MRI with different spatial resolutions compared to CFD simulations at four 2D planes: 10 mm below the carotid bifurcation in CCA, 10 mm, 15 mm, and 20 mm above the carotid bifurcation in the ICA. Note: the noise increases in the velocity profile at higher spatial resolutions, while resolving the velocity profile, and skewing decreases at lower spatial resolutions
Fig. 4
Fig. 4
Pearson correlation coefficients for voxel-to-voxel between 4D flow MRI and CFD at 10 mm distal to the bifurcation at different spatial resolutions. Correlation coefficients were calculated and averaged at different spatial resolutions and across all the time points in the cardiac cycle. All comparisons resulted in statistically significant values except for comparisons between resolutions of 1.00 vs. 0.5 and 1.50 vs. 2.00
Fig. 5
Fig. 5
a Absolute difference in mean flow between CFD and 4D flow MRI at different spatial resolutions averaged across the four different cross-sections. b Absolute difference in axial TAWSS between CFD and 4D flow MRI at different spatial resolutions averaged across the four different cross-sections. Statistical analysis: each pair were compared using a T-Test unpaired two-sample equal variance. Note: looking at the figure and using an alpha critical value of 5%, the statistically insignificant p-value to different comparisons is displayed. Square brackets are showing statistical analysis between different comparisons
Fig. 6
Fig. 6
TAWSS based on 4D flow MRI with different spatial resolutions compared to CFD simulations at 10 mm above the carotid bifurcation in the ICA. a shows the 3D axial velocity profile at peak systole. b shows the corresponding WSS vectors across the twelve sectors in the cross-section. c shows axial TAWSS heat maps corresponded to each sector comparing different 4D flow MRI spatial resolutions to CFD. d shows the Bland–Altman analysis of CFD vs 4D flow MRI axial TAWSS across the twelve different sectors at different spatial resolution at 10 mm above the carotid bifurcation in the ICA
Fig. 7
Fig. 7
a Compares the absolute difference in mean flow between CFD and 4D flow MRI at different temporal resolutions averaged across the four different cross-sections. b Compares the absolute difference in TAWSS axial between CFD and 4D flow MRI at different spatial resolutions averaged across the four different cross-sections. Statistical analysis: each pair were compared using a T-Test unpaired two-sample equal variance. Note: looking at the figure and using an alpha critical value of 5%, the statistically insignificant p-value to different comparisons is shown in the figure. Box brackets show statistical comparisons. In b all comparisons resulted in statistically insignificant analysis

References

    1. Nayak KS, Nielsen J-F, Bernstein MA, et al. Cardiovascular magnetic resonance phase contrast imaging. J. Cardiovasc. Magn. Reson 17(1):71, 2015. 10.1186/s12968-015-0172-7. - DOI - PMC - PubMed
    1. Markl M, Frydrychowicz A, Kozerke S, Hope M, and Wieben O. 4D flow MRI. J. Magn. Reson. Imaging 36(5):1015–1036, 2012. 10.1002/jmri.23632. - DOI - PubMed
    1. Szajer J, and Ho-Shon K. A comparison of 4D flow MRI-derived wall shear stress with computational fluid dynamics methods for intracranial aneurysms and carotid bifurcations—a review. J. Magn. Reson. Imaging 48:62–69, 2018. 10.1016/j.mri.2017.12.005. - DOI - PubMed
    1. Chatzimavroudis GP, Oshinski JN, Franch RH, et al. Evaluation of the precision of magnetic resonance phase velocity mapping for blood flow measurements. J. Cardiovasc. Magn. Reson 3(1):11–19, 2001. 10.1081/JCMR-100000142. - DOI - PubMed
    1. Nilsson A, Bloch KM, Töger J, Heiberg E, and Ståhlberg F. Accuracy of four-dimensional phase-contrast velocity mapping for blood flow visualizations: a phantom study. Acta Radiol. 54(6):663–671, 2013. 10.1177/0284185113478005. - DOI - PubMed

Publication types