. 2023 Jun;25(6):892-903.
doi: 10.1038/s41556-023-01141-9. Epub 2023 May 8.

An mRNA processing pathway suppresses metastasis by governing translational control from the nucleus

Affiliations

An mRNA processing pathway suppresses metastasis by governing translational control from the nucleus

Albertas Navickas et al. Nat Cell Biol. 2023 Jun.

Abstract

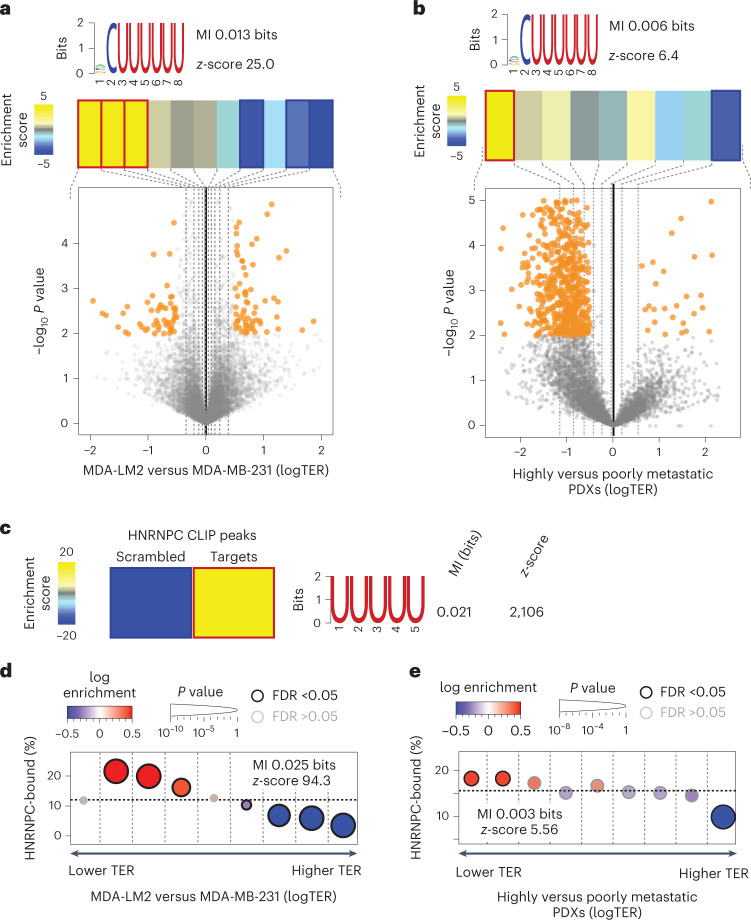
Cancer cells often co-opt post-transcriptional regulatory mechanisms to achieve pathologic expression of gene networks that drive metastasis. Translational control is a major regulatory hub in oncogenesis; however, its effects on cancer progression remain poorly understood. Here, to address this, we used ribosome profiling to compare genome-wide translation efficiencies of poorly and highly metastatic breast cancer cells and patient-derived xenografts. We developed dedicated regression-based methods to analyse ribosome profiling and alternative polyadenylation data, and identified heterogeneous nuclear ribonucleoprotein C (HNRNPC) as a translational controller of a specific mRNA regulon. We found that HNRNPC is downregulated in highly metastatic cells, which causes HNRNPC-bound mRNAs to undergo 3' untranslated region lengthening and, subsequently, translational repression. We showed that modulating HNRNPC expression impacts the metastatic capacity of breast cancer cells in xenograft mouse models. In addition, the reduced expression of HNRNPC and its regulon is associated with the worse prognosis in breast cancer patient cohorts.


Conflict of interest statement

The authors declare no competing interests.

Figures

Fig. 1
Fig. 1. HNRNPC target mRNAs are translationally repressed in highly metastatic breast cancer cells and PDXs.
a, Bottom: volcano plot showing the distribution of changes in TER (logTER) in MDA-LM2 compared with parental MDA-MB-231 cells. Statistically significant (logistic regression, P < 0.01) observations are highlighted in orange. Top: enrichment of the poly(U) motif in the mRNA 3′ UTRs as a function of logTER between MDA-LM2 and MDA-MB-231 cells. mRNAs are divided into equally populated bins based on their logTER (dashed vertical lines delineate the bins). Bins with significant enrichment (hypergeometric test, corrected P < 0.05; red) or depletion (blue) of poly(U) motifs are denoted with a bolded border. Also included are mutual information (MI) values and their associated z-scores. b, Volcano plot showing the distribution of changes in TE in highly versus poorly metastatic breast cancer PDXs, as described for a. c, Heat map showing the enrichment of poly(U) motifs among the HNRNPC binding sites (as determined by CLIP-seq) as compared with scrambled sequences (with di-nucleotide frequency held constant). The bolded border denotes a statistically significant enrichment (hypergeometric test, corrected P < 0.05; red). MI value and associated z-score are shown. d, Enrichment of the HNRNPC target mRNAs as a function of logTER between MDA-LM2 and MDA-MB-231 cells. mRNAs are binned as in a; the y axis shows the frequency of the HNRNPC targets (3′ UTR-bound) that we identified in each bin (dashed horizontal line denotes the average HNRNPC target frequency across all transcripts). Bins with significant enrichment (logistic regression, FDR <0.05; red) or depletion (blue) of HNRNPC targets are denoted with a black border. e, Enrichment patterns of HNRNPC target mRNAs as a function of logTER between highly and poorly metastatic breast cancer PDXs, as in d.
Fig. 2
Fig. 2. HNRNPC binding impacts the translation and APA of its targets.
a, Bottom: volcano plot showing the distribution of changes in TER (logTER) in sgHNRNPC compared with sgControl MDA-MB-231 cells. Statistically significant (logistic regression, P < 0.01) observations are highlighted in orange. Top: enrichment of the HNRNPC targets as a function of logTER between sgHNRNPC and sgControl cells. mRNAs are divided into equally populated bins according to logTER (dashed vertical lines delineate the bins); the y axis shows the frequency of the HNRNPC targets that we identified in each bin (dashed horizontal line denotes the average HNRNPC target frequency across all transcripts). Bins with significant enrichment (logistic regression, FDR <0.05; red) or depletion (blue) of HNRNPC targets are denoted with a black border. Also included are mutual information (MI) values and their associated z-scores. b, Heat maps showing the enrichment of canonical poly(A) signals in the vicinity (500 nt flanking) of HNRNPC binding peaks in 3′ UTRs (as determined by CLIP-seq). The bolded border denotes a statistically significant enrichment (hypergeometric test, corrected P < 0.05; red). MI values and associated z-scores are shown. c, Venn diagram showing the overlap between HNRNPC 3′ UTR target mRNAs and mRNAs showing APA. P value calculated using hypergeometric test. d, Bottom: volcano plot showing distribution of changes in APA ratio (logAPAR; for detailed description, see Methods) in MDA-LM2 compared with MDA-MB-231 cells. Top: enrichment of the HNRNPC-bound 3′ UTRs as a function of APAR between MDA-LM2 and parental MDA-MB-231 cells; statistics as in a. e, Bottom: volcano plot showing distribution of changes in APAR in sgHNRNPC compared with sgControl cells. Top: enrichment of the HNRNPC-bound 3′ UTRs as a function of APAR between sgHNRNPC and sgControl cells; statistics as in a.
Fig. 3
Fig. 3. PABPC4 acts in concert with HNRNPC to control APA and directs its target mRNAs to AGO2-dependent translational repression.
a, Volcano plot showing the distribution of changes in relative protein interaction with HNRNPC (as determined by HNRNPC or control (isotype IgG) co-IP–MS) in MDA-LM2 compared with MDA-MB-231 cells. Statistically significant (FDR-adjusted P value <0.25, generalized linear model controlling for input abundances) observations are highlighted in pink. b, Co-IPs of HNRNPC or control IgG were analysed by western blotting. RNase A was included in the lysates where indicated. Representative image from two independent experiments. c, Venn diagram showing the overlap between HNRNPC and PABPC4 3′ UTR targets (as determined by CLIP-seq and PAPER-CLIP, respectively). P value calculated using hypergeometric test. d, Bottom: volcano plot showing distribution of changes in APA ratio (logAPAR) in HNRNPC/PABPC4 double KD compared with PABPC4 KD MDA-MB-231 cells. Top: enrichment of the HNRNPC-bound 3′ UTRs as a function of APAR between sgHNRNPC/sgPABPC4 and sgControl/sgPABPC4 cells; statistics as in Fig. 2a. e, Venn diagram showing the overlap between HNRNPC 3′ UTR targets and AGO2 bound mRNAs (top) or miRNA target mRNAs (bottom), as determined by CLIP-seq analyses. P values calculated using hypergeometric test. f, Bottom: volcano plot showing distribution of changes in TER (logTER) in sgAGO2 compared with sgControl MDA-MB-231 cells. Top: enrichment of the AGO2 targets as a function of logTER between sgAGO2 and sgControl cells; statistics as in Fig. 2a. g, Enrichment of the HNRNPC targets as a function of logTER between sgAGO2 and sgControl cells. mRNAs are distributed into equally populated bins according to their logTER (the red bars on the black background show the range of values in each bin). Bins with significant enrichment (hypergeometric test, corrected P < 0.05; red) or depletion (blue) of HNRNPC targets (3′ UTR-bound) are denoted with a bolded border. Also included are mutual information (MI) value and its associated z-score. Source data
Fig. 4
Fig. 4. HNRNPC levels impact in vivo metastatic colonization of breast cancer cells.
a, MDA-LM2 cells stably expressing sgHNRNPC or sgControl were injected via tail vein into NSG mice. Bioluminescence was measured at the indicated times (mean values are shown, error bars indicating standard error of the mean (s.e.m.); P value calculated using two-way analysis of variance (ANOVA)); area under the curve was measured at the final timepoint (P value calculated using one-tailed Mann–Whitney U test). Lung sections were stained with H&E (representative images shown). n = 4–5 mice per cohort. b, MDA-LM2 cells stably overexpressing mCherry or HNRNPC were injected via tail vein into NSG mice. Bioluminescence was measured at the indicated times (mean values are shown, error bars indicating s.e.m.; P value calculated using two-way ANOVA); area under the curve was measured at the final timepoint (P value calculated using one-tailed Mann–Whitney U test). n = 4–5 mice per cohort. c, MDA-MB-231 cells stably expressing sgHNRNPC or sgControl were injected orthotopically into mammary fat pads of NSG mice. Tumour volume was measured at indicated times (mean values are shown, error bars indicating s.e.m.; P value calculated using two-way ANOVA); tumour volume was compared at the time of tumour resection (P value calculated using one-tailed Mann–Whitney U test). d, MDA-MB-231 cells stably expressing sgHNRNPC or sgControl were injected orthotopically into mammary fat pads of NSG mice. Four weeks later, the primary tumours were resected and lung colonization was measured at indicated times. Lung bioluminescence was measured at the final timepoint (P value calculated using one-tailed Mann–Whitney U test). Lung sections were stained with H&E (representative images shown). n = 4–5 mice per cohort. Source data
Fig. 5
Fig. 5. PDLIM5 acts downstream of HNRNPC to suppress breast cancer metastasis.
a, The schematics of PDLIM5 3′ UTR, showing proximal and distal poly(A) sites, HNRNPC binding sites as determined by CLIP-seq, and 3′-end RNA-seq results in MDA-MB-231 and MDA-LM2, as well as sgControl and sgHNRNPC-expressing cells. CPM, counts per million. b, Western blot analysis of PDLIM5 protein in MDA-MB-231 and MDA-LM2, as well as sgControl and sgHNRNPC-expressing cells. Relative PDLIM5 quantity normalized to GAPDH is indicated below, along standard errors. c, Quantification of relative PDLIM5 proximal to distal poly(A) site usage in MDA-MB-231 and MDA-LM2 cells (left) or sgControl and sgHNRNPC cells (right), as determined by isoform-specific RT–qPCR. n = 3 biological replicates. P values calculated using one-tailed Mann–Whitney U test. d, Relative reporter FLAG-PDLIM5 protein quantity (normalized to GAPDH), expressing full-length, short and long PDLIM5 3′ UTRs, as illustrated in Extended Data Fig. 5f. n = 6 biological replicates. P value calculated using two-tailed unpaired t-test. e, MDA-MB-231 cells stably expressing sgPDLIM5 or sgControl were injected via tail vein into NSG mice. Bioluminescence was measured at the indicated times (mean values are shown, error bars indicating standard error of the mean; P value calculated using two-way analysis of variance); area under the curve was measured at the final timepoint (P value calculated using one-tailed Mann–Whitney U test). n = 3 and 5 mice per cohort. f, MDA-MB-231 cells stably expressing sgControl or sgHNRNPC and mCherry (control) or PDLIM5 (PDLIM5-OE) were injected via tail vein into NSG mice. Bioluminescence was measured at the final timepoint (P value calculated using one-tailed Mann–Whitney U test). n = 4–5 mice per cohort. Source data
Fig. 6
Fig. 6. HNRNPC expression is associated with clinical outcomes in patients with breast cancer.
a, Kaplan–Meier survival curve showing association between tumour HNRNPC levels and disease-free survival in the METABRIC cohort. b, Kaplan–Meier survival curve showing association between tumour HNRNPC levels and overall survival in the TCGA-BRCA cohort. c, Kaplan–Meier survival curve showing association between tumour HNRNPC levels and distant metastasis-free survival (DMFS) in a collection of breast cancer patient cohorts. Hazard ratios (HR) and P values (calculated using log-rank test) are shown (ac). d, HNRNPC mRNA levels across breast cancer tissue stages I–IV in the METABRIC cohort. P value calculated using one-way analysis of variance (ANOVA). Box centre reports the median value, the boundaries—the quartiles and the whiskers—and the 10th and 90th percentiles. e, HNRNPC mRNA levels in non-metastatic (M0) and metastatic (M1) breast tumours in the TCGA-BRCA cohort. P value calculated using two-tailed Mann–Whitney U test. Box plot characteristics as in d. f, Kaplan–Meier survival curve showing association between tumour PABPC4 levels and distant metastasis-free survival (DMFS) in a collection of breast cancer patient cohorts. Hazard ratios (HR) and P values (calculated using log-rank test) are shown. g, PABPC4 mRNA levels across breast cancer tissue stages I–IV in the METABRIC cohort. P value calculated using one-way ANOVA. Box plot characteristics as in d. h, Kaplan–Meier survival curve showing association between tumour PDLIM5 levels and distant metastasis-free survival (DMFS) in a collection of breast cancer patient cohorts. Hazard ratios (HR) and P values (calculated using log-rank test) are shown. i, MDA-LM2 cells treated with T4 or vehicle control (DMSO) at 3 µM for 6 h were injected via tail vein into NSG mice. Bioluminescence was measured at the indicated times (mean values are shown, error bars indicating standard error of the mean (s.e.m.); P value calculated using two-way ANOVA). Lung sections were stained with H&E (representative images shown). n = 4–5 mice per cohort. j, NSG mice were intravenously injected with MDA-LM2, and intraperitoneally injected with 10 mg kg−1 T4 or vehicle control for three consecutive days, starting on the day of cancer cell injection. Bioluminescence was measured at the indicated times (mean values are shown, error bars indicating s.e.m.; P value calculated using two-way ANOVA); area under the curve was measured at the final timepoint (P value calculated using one-tailed Mann–Whitney U test). n = 4–5 mice per cohort. Source data
Extended Data Fig. 1
Extended Data Fig. 1. HNRNPC target mRNAs are translationally repressed in highly metastatic breast cancer cells and PDXs.
(a) Length distribution of ribosome protected footprints (RPFs) as determined by Ribo-seq. A representative data sample is shown. (b) Distribution of RPFs, aligned on an inferred ribosome P-site, on a metagene, centered around translation start (left) or stop (right) site. A representative data sample is shown. (c) Volcano plot illustrating the changes in protein abundance in MDA-LM2 compared to MDA-MB-231 cells, as determined by TMT-MS analysis. The data points are colored according to thresholds in effect size (logFC ± 0.33) and significance (p < 0.05, two-tailed t-test). (d) The distribution of changes in TEs (as determined by Ribo-seq) and in protein abundance (as determined by TMT-MS and normalized by RNA expression obtained from RNA-seq), in MDA-LM2 compared to MDA-MB-231 cells. Pearson R and associated p-value are shown. (e) The comparison of the metastatic capacity of breast cancer PDXs used in this study. (f) Representative images (n = 4-13 mice per cohort, as in (e)) of H&E stained mouse lung sections transplanted with breast cancer PDXs. The metastatic foci are indicated by black arrows. Scale bar = 100 µm. (g) Mutual information (MI) values and associated z-scores from the DeepBind algorithm, showing the prediction of poly(U) binding protein targets among translationally repressed mRNAs in MDA-LM2 compared to MDA-MB-231 cells. (h) Upset plot showing the distribution and overlap of HNRNPC peaks within genomic features, as determined by CLIP-seq. (i) Cumulative density plot of translation efficiency ratios (TER) comparing MDA-LM2 to MDA-MB-231 cells, for HNRNPC 3′ UTR target and non-target mRNAs. (j) Cumulative density plot of translation efficiency ratios (TER) comparing highly and poorly metastatic breast cancer PDXs, for HNRNPC 3′ UTR target and non-target mRNAs. Median difference (∆M) and p-value (calculated using two-tailed Mann-Whitney U-test) are shown. (k) Cumulative density plot of translation efficiency ratios (TER) comparing MDA-LM2 to MDA-MB-231 cells, for HNRNPC, ELAVL1 and TIA1 3′ UTR target mRNAs, as determined by CLIP-seq.
Extended Data Fig. 2
Extended Data Fig. 2. HNRNPC binding impacts the translation and alternative polyadenylation of its targets.
(a) Cumulative density plot of translation efficiency ratios (TER) comparing sgHNRNPC to sgControl MDA-MB-231 cells, for HNRNPC 3′ UTR target and non-target mRNAs. Median difference (∆M) and p-value (calculated using two-tailed Mann-Whitney U-test) are shown. (b) Two-dimensional heatmap showing significant logTER correlation of translationally repressed mRNAs in MDA-LM2 and HNRNPC knockdown (sgHNRNPC) cells. For comparison, the Spearman correlation coefficient and the associated p-value are shown across all genes. (c) TXNRD1 and PGK1 mRNA levels in MDA-MB-231 and MDA-LM2, as well as sgControl and sgHNRNPC-expressing cells, as determined by RNA-seq. (d) Western blot analysis of TXNRD1 and PGK1 proteins in MDA-MB-231 and MDA-LM2, as well as sgControl and sgHNRNPC-expressing cells. Relative protein quantity normalized to GAPDH is indicated below, along SE. The western blot was performed once in biological triplicates to confirm the TMT-MS results. (e) Cumulative density plot of alternative polyadenylation ratios (logAPAR) comparing MDA-LM2 to MDA-MB-231 cells, for HNRNPC 3′ UTR target and non-target mRNAs; statistics as in (a). (f) Cumulative density plot of logAPAR comparing sgHNRNPC to sgControl cells, for HNRNPC 3′ UTR target and non-target mRNAs; statistics as in (a). (g) Two-dimensional heatmap showing significant logAPAR correlation of proximal to distal poly(A) site switch in MDA-LM2 and HNRNPC knockdown (sgHNRNPC) cells; statistics as in (b). (h) Bidirectional promoter reporter schematics, used for massively parallel reporter assays (MPRA). (i) BFP/mCherry ratio of reporter-expressing MDA-MB-231 cells, transfected with control or HNRNPC-targeting siRNAs, as detected by flow cytometry. (j) Box plot illustrating the relative reporter logAPAR, comparing transcripts with HNRNPC-binding sites versus matched scrambled controls, in control and HNRNPC KD cells. n = 2 biological replicates. p-value calculated using one-tailed Wilcoxon signed-rank test. Box center reports the median value, the boundaries - the quartiles, and the whiskers - the 10 and 90 percentiles. (k) Box plot illustrating the relative reporter logAPAR, comparing transcripts with HNRNPC-binding sites versus matched scrambled controls, in control and HNRNPC KD cells, stratified by reporter protein expression (25% high versus 25% low BFP/mCherry ratio, as determined and sorted by flow cytometry). n = 2 biological replicates. p-value calculated using one-tailed t-test. Box plot characteristics as in (j). Source data
Extended Data Fig. 3
Extended Data Fig. 3. PABPC4 acts in concert with HNRNPC to control alternative polyadenylation and directs its target mRNAs to AGO2-dependent translational repression.
(a) Significant depletion of selected gene ontology (GO) terms in the HNRNPC interactome in MDA-LM2 compared to MDA-MB-231 cells, as determined by coIP-MS. Also reported are the associated empirical p-values from permutation tests. (b) Enrichment of PABPC4 in HNRNPC coIP-MS data in MDA-MB-231 and MDA-LM2 cells. n = 3 biological replicates. Individual data points and mean values are shown, error bars indicating SEM; p-value calculated using parametric linear model controlling for input abundances. (c-d) Comparison of alternative polyadenylation ratio (logAPAR) in PABPC4 knockdown (sgPABPC4) (c) or PABPN1 knockdown (sgPABPN1) (d) and control (sgControl) cells, as in Fig. 2d. Below, cumulative density plots as in Extended Data Fig. 2e are shown. (e) Heatmaps showing the enrichment of canonical poly(A) signals in the vicinity of PABPC4 binding peaks (as determined by PAPER-CLIP). The bolded border denotes a statistically significant enrichment (hypergeometric test, corrected p < 0.05; red). MI values and associated z-scores are shown. (f) Cumulative density plot of logAPAR comparing sgHNRNPC/sgPABPC4 (double knockdown) to sgControl/sgPABPC4 cells, for HNRNPC 3′ UTR target and non-target mRNAs, as in (c). (g) Relative RNA quantity in cytoplasmic versus nuclear fraction, as determined by RTqPCR. (h-i) Cumulative density plot of logAPAR comparing MDA-MB-231 and MDA-LM2 (h) or MDA-MB-231 sgControl and sgHNRNPC (i) cells, in nuclear versus cytoplasmic fractions, for HNRNPC 3′ UTR target and non-target mRNAs, as in (c). (j-k) Comparison of logAPAR from cytoplasmic RNAs, in MDA-LM2 and MDA-MB-231 (j) or MDA-MB-231 sgControl and sgHNRNPC (k) cells, as in (c). (l-m) Enrichment patterns of HNRNPC target mRNAs in the cytoplasm as a function of logTER between MDA-LM2 and MDA-MB-231 (l) or MDA-MB-231 sgControl and sgHNRNPC (m) cells, as in Fig. 1d. Source data
Extended Data Fig. 4
Extended Data Fig. 4. HNRNPC levels impact in vivo metastatic colonization of breast cancer cells.
(a) Violin plots showing the distribution of translation efficiency ratios (logTER) comparing MDA-LM2 to MDA-MB-231 cells among the miRNA target, joint HNRNPC and miRNA target, and non-target mRNA 3′ UTRs. n = 2 biological replicates. p-values calculated using two-tailed Mann-Whitney U-test. Box center reports the median value, the boundaries - the quartiles, and the whiskers - the 10 and 90 percentiles. (b) Violin plots showing the distribution of translation efficiency ratios (logTER) comparing sgHNRNPC to sgControl cells among the miRNA target, joint HNRNPC and miRNA target, and non-target mRNA 3′ UTRs. n = 2 biological replicates. p-values calculated using two-tailed Mann-Whitney U-test. Box plot characteristics as in (a). (c) Bottom: Volcano plot showing distribution of changes in translation efficiency ratio (logTER) in sgHNRNPC compared to sgControl cells. Top: Enrichment of the AGO2 targets as a function of logTER between sgHNRNPC and sgControl cells; statistics as in Fig. 2a. (d) Cumulative density plot of logTER (HNRNPC 3′ UTR targets) comparing sgHNRNPC to sgControl cells, in AGO2 knockdown (sgAGO2) and control (sgControl) conditions; statistics as in Extended Data Fig. 2a. (e) HCC1806-LM2 cells stably expressing sgHNRNPC or sgControl were injected via tail vein into NSG mice. Bioluminescence was measured at the indicated times (mean values are shown, error bars indicating SEM; p-value calculated using two-way ANOVA); area under the curve was measured at the final time point (p-value calculated using one-tailed Mann-Whitney U-test). Lung sections were stained with H&E (representative images shown). n = 4-5 mice per cohort. (f) MDA-MB-231 cells stably expressing sgControl, sgPABPC4 or sgPABPC4/sgHNRNPC were injected via tail vein into NSG mice. Bioluminescence was measured at the indicated times (mean values are shown, error bars indicating SEM; p-value calculated using two-way ANOVA). n = 4-5 mice per cohort. Source data
Extended Data Fig. 5
Extended Data Fig. 5. PDLIM5 acts downstream of HNRNPC to suppress breast cancer metastasis.
(a) Volcano plot illustrating the changes in protein abundance in HNRNPC knockdown (sgHNRNPC) compared to control (sgControl) MDA-MB-231 cells, as determined by TMT-MS analysis. The data points are colored according to thresholds in effect size (logFC ± 0.25) and significance (p < 0.05, two-tailed t-test). (b) The distribution of changes in protein abundance in MDA-LM2 vs. MDA-MB-231 cells and sgHNRNPC vs. sgControl cells, as determined by TMT-MS. Pearson R and associated p-value are shown. (c) Gene-set enrichment analysis of the data depicted in (a). (d) Quantification of PDLIM5 protein expression in MDA-MB-231 and MDA-LM2 (left), or sgControl and sgHNRNPC (right) cells, as determined by TMT-MS. n = 3 biological replicates. p-values calculated using one-tailed Student’s t-test. (e) Quantification of relative PDLIM5 mRNA expression (normalized to HPRT) in MDA-MB-231 and MDA-LM2 cells (left) or sgControl and sgHNRNPC cells (right), as determined by RTqPCR. n = 3 biological replicates. (f) Reporter schematics of testing PDLIM5 3′ UTR variants. Representative western blot image of two independent experiments is shown below. (g) HCC1806-LM2 cells stably expressing sgPDLIM5 or sgControl were injected via tail vein into NSG mice. Bioluminescence was measured at the indicated times (mean values are shown, error bars indicating SEM; p-value calculated using two-way ANOVA); area under the curve was measured at the final time point (p-value calculated using one-tailed Mann-Whitney U-test). n = 4-5 mice per cohort. (h-i) Cell migration (left) and cell invasion (right) measurements of MDA-MB-231 cells. n = 4 biological replicates. p-values calculated using two-tailed Mann-Whitney U-test. (j-m) Proliferation rates (left) and colony forming units (CFU) (right) of MDA-MB-231 cells. n = 6 (proliferation rate) or 3 (CFU) biological replicates. p-values calculated using two-tailed unpaired t-test. Source data
Extended Data Fig. 6
Extended Data Fig. 6. HNRNPC expression is associated with clinical outcomes in breast cancer patients.
(a) Distribution of 10-year relapse-free survival p-values (two-sided log rank test results reported as –log p for positive association and log p for negative) of the association of HNRNPC expression and clinical outcome in the listed 10 breast cancer datasets. Violet bars show associations that pass the statistical threshold (–log p < –1.3, FDR-corrected two-sided log-rank test (FDR < 0.1)), blue bars are trending negative, and yellow bars are trending positive. The statistical threshold was adjusted as 10/number of datasets. (b-c) Kaplan-Meier survival curves showing association between tumor HNRNPC levels and overall (b) or relapse-free (c) survival in a collection of breast cancer patient cohorts. Hazard ratios (HR) and p-values (calculated using log-rank test) are shown. (d) HNRNPC mRNA levels across breast tumor subtypes in the METABRIC cohort. Box center reports the median value, the boundaries - the quartiles, and the whiskers - the 10 and 90 percentiles. (e) Multivariate survival analysis (Cox proportionate-hazards model) of breast cancer patients in the METABRIC cohort with HNRNPC expression as one of the factors. P < 0.05 are highlighted in red. LumA, luminal A; LumB, luminal B; NC, not classified. (f-g) Kaplan-Meier survival curve showing association between tumor HNRNPC signature protein levels and progression-free (f) or overall (g) survival in the TCGA-BRCA CPTAC cohort. (h-j) Kaplan-Meier survival curve showing association between tumor PABPC4 (h) or PDLIM5 (i-j) levels and overall (h) or disease-free (i-j) survival in a collection of breast cancer patient cohorts. (k-l) Comparison of alternative polyadenylation ratio (logAPAR) in T4 and DMSO-treated MDA-MB-231 (k) or HNRNPC knockdown (sgHNRNPC) (l) cells, as in Fig. 2d. (m) Cumulative density plot of logAPAR comparing T4- to DMSO-treated HNRNPC knockdown (sgHNRNPC) cells, as in Extended Data Fig. 2e. (n) Dose-response measurements for 6-hour T4 treatment and corresponding cell viability, determined 72 hours post-treatment. n = 6 biological replicates. Mean values are plotted, error bars indicating SD. (o) Box plots illustrating the changes in alternative polyadenylation (logAPAR) of HNRNPC targets between T4-treated (sampled at indicated time points) and untreated MDA-LM2 cells. n = 3 biological replicates. p-values calculated using two-tailed Wilcoxon signed-rank test. Box plot characteristics as in (d). Source data

Comment in

References

    1. Coghlin C, Murray GI. The role of gene regulatory networks in promoting cancer progression and metastasis. Future Oncol. 2014;10:735–748. doi: 10.2217/fon.13.264. - DOI - PubMed
    1. van Kouwenhove M, Kedde M, Agami R. MicroRNA regulation by RNA-binding proteins and its implications for cancer. Nat. Rev. Cancer. 2011;11:644–656. doi: 10.1038/nrc3107. - DOI - PubMed
    1. Goodall GJ, Wickramasinghe VO. RNA in cancer. Nat. Rev. Cancer. 2021;21:22–36. doi: 10.1038/s41568-020-00306-0. - DOI - PubMed
    1. Kang D, Lee Y, Lee J-S. RNA-binding proteins in cancer: functional and therapeutic perspectives. Cancers. 2020;12:2699. doi: 10.3390/cancers12092699. - DOI - PMC - PubMed
    1. Truitt ML, Ruggero D. New frontiers in translational control of the cancer genome. Nat. Rev. Cancer. 2016;16:288–304. doi: 10.1038/nrc.2016.27. - DOI - PMC - PubMed

Publication types