. 2023 Dec;41(12):1765-1775.
doi: 10.1038/s41587-023-01747-2. Epub 2023 May 8.

Multimodal spatiotemporal phenotyping of human retinal organoid development

Affiliations

Multimodal spatiotemporal phenotyping of human retinal organoid development

Philipp Wahle et al. Nat Biotechnol. 2023 Dec.

Abstract

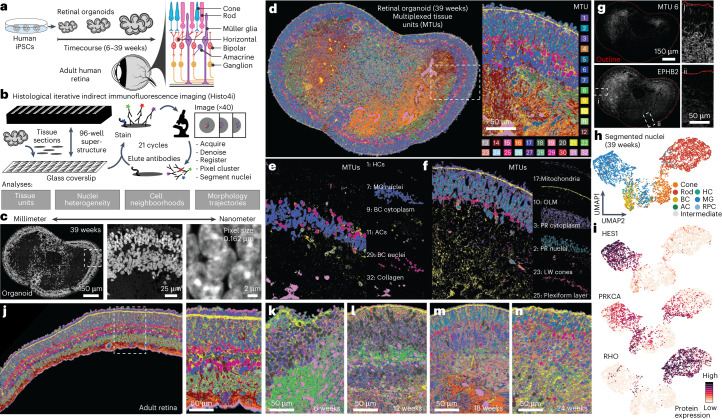
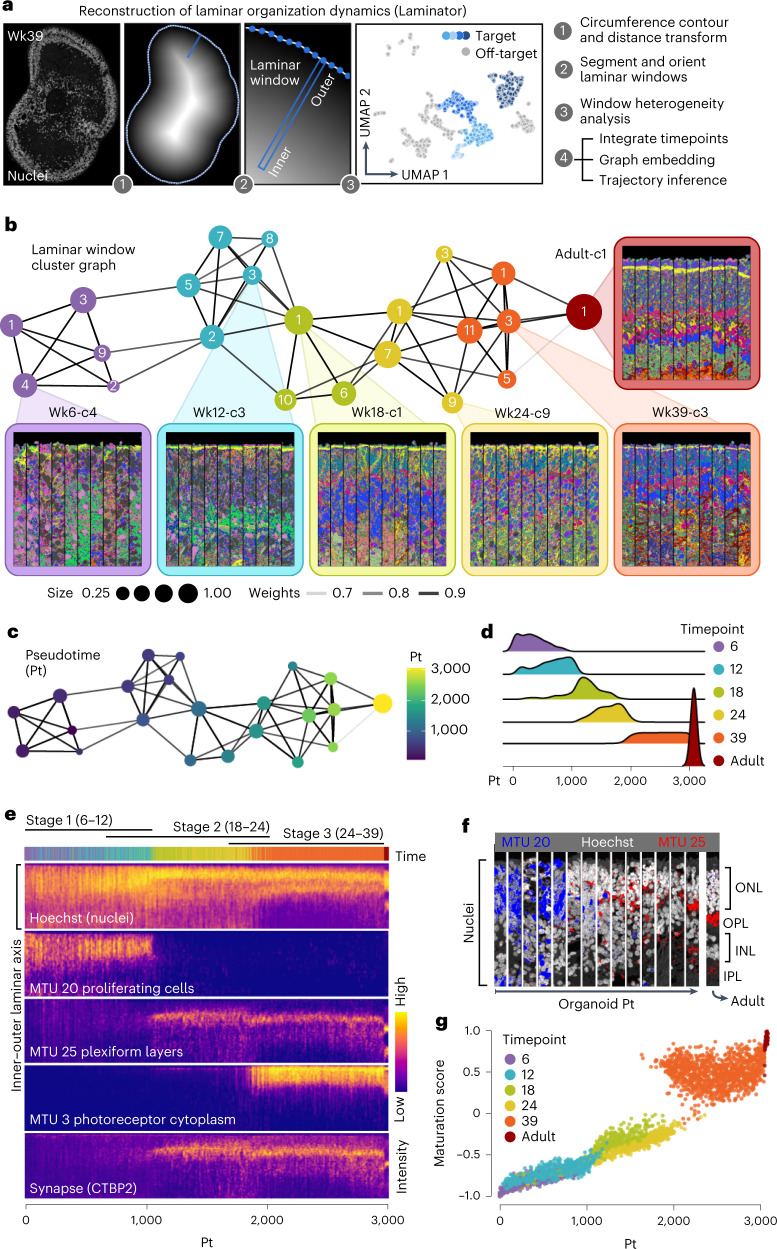
Organoids generated from human pluripotent stem cells provide experimental systems to study development and disease, but quantitative measurements across different spatial scales and molecular modalities are lacking. In this study, we generated multiplexed protein maps over a retinal organoid time course and primary adult human retinal tissue. We developed a toolkit to visualize progenitor and neuron location, the spatial arrangements of extracellular and subcellular components and global patterning in each organoid and primary tissue. In addition, we generated a single-cell transcriptome and chromatin accessibility timecourse dataset and inferred a gene regulatory network underlying organoid development. We integrated genomic data with spatially segmented nuclei into a multimodal atlas to explore organoid patterning and retinal ganglion cell (RGC) spatial neighborhoods, highlighting pathways involved in RGC cell death and showing that mosaic genetic perturbations in retinal organoids provide insight into cell fate regulation.


Conflict of interest statement

The authors declare no competing interests.

Figures

Fig. 1
Fig. 1. Highly multiplexed immunohistochemistry reveals scale-crossing features of developing retinal organoids and primary human retina.
a, 4i was performed on tissues of a timecourse of retinal organoid development (6, 12, 18, 24 and 39 weeks) and adult retina tissue. Schematic shows retinal cell type organization. b, Schematic of the 4i methodology and analyses. FFPE tissue sections were placed on a 96-well format coverslip that was subsequently attached to a 96-well superstructure allowing immunohistological treatment, followed by imaging and antibody elution. Here, we performed 21 immunohistochemical staining cycles. Images were acquired at ×40 magnification with a high-NA silicone oil objective, tiled across the tissue. c, Representative 4i dataset image showing overview of a Hoechst stain of a 39-week organoid section and progressive magnifications from millimeter to nanometer scales. df, Example of pixel clustering of a 39-week organoid section. d, Thirty-two global MTUs resolve the tissue structure with image quality and label biological structures in individual samples. e,f, Biological structures identified by unique MTUs include HCs, BC cytoplasm and nuclei, ACs and structural elements such as collagen-rich areas (e) and peripherally located structures such as mitochondria, the OLM, PR cytoplasm and nuclei, long-wave (LW) cones and the plexiform layers (f). g, MTU 6 (top) is enriched for EPHB2 protein expression (bottom) and non-uniformly distributed in the organoid section (outlined by red line). Insets show regions with high (i) and low (ii) detection of EPHB2 fluorescence immunohistochemical signal. Patterned EPHB2 staining was observed in all 39-week replicates (11 sections and three organoids). h, Heterogeneity analysis of nuclei with UMAP projection based on protein features and colored by labels transferred from sequenced cells. All major types are identified, including RGCs, HCs, cones, ACs, rods, BCs and MG. i, Feature plots highlighting median signal level per nucleus of HES1, identifying nuclei located in the INL; PRKCA, enriched in BCs; and RHO, identifying cells located in the ONL. jn, Primary adult human retina section (j) and retinal organoid sections from different timepoints (kn) with pixels labeled by MTUs derived from communal clustering and comparable across samples.
Fig. 2
Fig. 2. Analysis of laminar structure enables trajectory reconstruction and illuminates spatiotemporal dynamics of retinal organoid formation.
a, Schematic overview of the Laminator algorithm developed for laminar window segmentation, vertical orientation and trajectory inference. Laminar windows measure 16.25 × 1.625 μm and are oriented on the tissue contour by maximizing the Euclidean distance transform of the masked organoid for each window. b, Force-directed graph embedding of laminar window clusters (numbered) colored by timepoint. Node size represents the fraction of laminar windows within a timepoint. Insets colored by timepoints show representative oriented laminar windows per cluster. c, Graph with laminar window clusters colored based on pseudotime from diffusion analysis. d, Density plot showing laminar window proportion along the pseudotime, grouped by timepoint. e, Heat map showing fluorescence intensity measurements (Hoechst and CTBP2) or MTU intensity profiles (MTU 20, MTU 25 and MTU 3) along the inner–outer laminar axis across oriented laminar windows ordered by pseudotime. f, Representative oriented laminar windows from multiple positions along the pseudotime course showing nuclei location (Hoechst, white), proliferating cells (MTU 20, blue) and plexiform layers (MTU 25, red) along the inner–outer laminar axis. g, Scatter plot showing signal similarity of each laminar window to adult laminar windows over pseudotime. Dots are colored by timepoint. c, cluster; Wk, week.
Fig. 3
Fig. 3. Timecourse single-cell multiomic data identify GRNs underlying human retinal organoid development.
a, Paired scRNA-seq and scATAC-seq were performed on a timecourse of retinal organoid development. Multiome data were also acquired and used to assist with data integration. Together with previously published scRNA-seq data, scRNA-seq and scATAC-seq data were combined into metacell representations containing both modalities using CCA and MCMF. b,c, UMAP embedding of metacells colored by iPSC line (b) or by annotated cell type (c, top) and timepoint (c, bottom). d, Heat maps showing average expression of representative marker genes (top) or chromatin accessibility (bottom) for each major cell type. e, Feature plots showing cell type marker gene expression (left) or chromatin accessibility (right). f, Branch visualization in a force-directed layout, with circles representing high-resolution clusters, with both RNA and chromatin access features colored by assignment. g, UMAP embedding of the inferred TF network based on co-expression and inferred interaction strength between TFs. Color and size represent expression weighted pseudotime of TF regulator and PageRank centrality of each module. h, TF network colored by expression enrichment for different cell types. Exp. norm., expression normalized; Pt, pseudotime; Pt-dep., pseudotime dependency; Rel. expr., relative expression; wks, weeks.
Fig. 4
Fig. 4. Multimodal integration provides a digital organoid representation of human retinal neurogenesis.
a, Schematic for integrating accessible chromatin, transcriptome and protein modalities into spatially resolved and segmented nuclei. High-resolution clusters were generated from scSeq data (RNA/ATAC metacells) of the closest matching timepoints to the imaging data. Label transfer was predicted based on correlation of RNA and protein features in sequenced cells and imaged nuclei, respectively. Left UMAP shows timecourse metacell embedding based on transcriptome and colored by cell type with 39-week cells highlighted. Right UMAP shows nuclei embedding based on protein features colored according to label transfer from the transcriptome space. b, Overview and laminar zoom of a representative 39-week retinal organoid colored based on nuclei type assignment from the label transfer. c,d, Representative 39-week organoid nuclei colored based on RNA expression (c) or chromatin accessibility (d) of markers for PRs (CRX, c; chr17-81655189–81657223, d) or MG (HES1, c; chr11-126082119–126083088, d). e, Multimodal integration across the other timepoints. Left metacell embedding colored based on indicated timepoint. Right nuclei UMAP colored by label transfer from the transcriptome space. f, Timecourse retinal organoids colored based on VSX2 transcript expression. Boxed inset shows zoom with inner (I) to outer (O) orientation. g, Heat map shows VSX2 expression densities along the inner–outer and pseudotime axes. Dashed lines demarcate stages (vertical) and the INL (horizontal). 1, 2 and 3 refer to the organoid developmental stage as in Fig. 2e. h, Heat map showing expression of RGCs (POU4F1), MG (HES1) and PR (CRX) markers along the inner–outer and pseudotime axes. i, Heat map showing nuclei type abundance densities for the major annotated retinal organoid cell types/states along the inner–outer and pseudotime axes. j, Density plots showing proportion of each annotated nuclei type over the trajectory. Inter., intermediate; Pt, pseudotime; wk, weeks.
Fig. 5
Fig. 5. Multiplexed spatial transcript detection in retinal organoids enables evaluation of multimodal integration.
a, Multiplexed RNA FISH in retinal organoid cryosections (week 13 and week 32). A six-transcript overlay (100 probed) is shown at two resolutions for one organoid at each timepoint. Scale bar, 100 µm; zoom, 55.2 × 165.6 µm. b, Transcript detection in a representative oriented (inner, I; outer, O) window for a week 13 (top) and a week 32 (bottom) organoid. First panel shows Baysor segmentation. c, Heterogeneity analysis of Baysor-segmented cell bodies from all organoid sections at week 13 (top) and week 32 (bottom). UMAP projection from FISH expression features and colored by labels transferred from sequenced cells. Major types are distinguished, including RGCs, HCs, cones, ACs, rods, BCs and MG. d, Box plots show averaged Euclidean genomic distances of matched spatial zones in week 13 (top, n = 1,697) and week 32 (bottom, n = 1,666) laminar windows from FISH data and transferred transcript expression in the multimodal integrated laminar windows from each 4i timepoint. e, Left, VSX2 transcript detection in extended centroids of segmented cell bodies within an oriented week 13 (top) and week 32 (bottom) window. Right, line plot shows average VSX2 expression across matched windows of measured protein (black) and RNA (gray) from 4i and FISH experiments and transferred RNA from integrated 4i nuclei (dark blue) and FISH cells (light blue). f, Bar plots show spatially constrained correlation within paired multimodal metacells (FISH and 4i) between transferred and measured RNA and measured protein and RNA. g, Scatter plot shows correlation between imputed and measured RNA within segmented features from FISH (y axis) and 4i (x axis) datasets. Genes (circles) are colored by transcript detection in the single-cell sequencing data. h, Power analysis comparing expression correlations in 4i and FISH transcriptome integrations. Clusters from scRNA-seq data were generated at different resolution levels. Major cell types were distinguished at level 1 (L1), with subsequent resolution describing biological and technical cell states. i, Box plots show distribution of distances calculated between the best and second-best matches for label transfer (Seurat) between scRNA-seq cells and 4i (left, n = 366,540) and FISH (right, n = 64,579) nuclei. The data suggest that both methods, on average, perform equivalently well and broadly resolve cell types. Wk, week.
Fig. 6
Fig. 6. Mosaic genetic perturbation and scSeq in organoids highlights OTX2 regulome activity differences between retinal cell types.
a, Heat map shows OTX2 transcript expression, motif enrichment and positive regulome (+) and negative regulome (−) densities along the inner (I) to outer (O) and pseudotime axes from the reconstructed multimodal map. b, Transcriptome-based UMAP metacell plot showing OTX2 expression (left) or motif enrichment within accessible chromatin peaks (right). c, Global TF GRN highlighting OTX2 (black node) and the predicted positively (red) and negatively (blue) regulated genes within the inferred OTX2 regulon. d, Box plots show the distribution of OTX2 positively (top, +) or negatively (bottom, −) regulated targets within the GRN based on the expression correlation of each target to different retinal cell fates. e, Schematic of single-cell perturbation experiment using the CROP-seq method. Three gRNAs targeting OTX2 and four other TFs (Supplementary Information) were used together with a random non-targeting gRNA (dummy). Retinal organoids were infected with gRNA-containing lentiviruses at 19 weeks, and scRNA-seq and amplicon-seq were performed on suspensions at 22–24 weeks. f, UMAP projection colored by annotated cell type (left) or by cells with OTX2 (top right, red) or dummy (bottom right, dark gray) gRNAs detected. Gray cells represent unknown or other targeted TFs. g, Heat map showing gene expression modules (columns) and their activity in cell clusters (rows). Left sidebar shows cluster type. Bottom sidebar shows module clusters. Top side bar shows the differential module activity for the OTX2 gRNA cells relative to dummy control. h, Scatter plot showing the relationship between differential expression between OTX2 LOF and control (x axis) and predicted directionality in the OTX2 GRN targets (y axis). i, GO enrichments for modules that are significantly affected by OTX2 LOF. j, Heat map shows the module activity scores across the retinal organoid spatiotemporal multimodal map. CL, control; KO, knockout; Pt, pseudotime; wks, weeks; ER, endoplasmic reticulum.

References

    1. Schier AF. Single-cell biology: beyond the sum of its parts. Nat. Methods. 2020;17:17–20. - PubMed
    1. Zhu C, Preissl S, Ren B. Single-cell multimodal omics: the power of many. Nat. Methods. 2020;17:11–14. - PubMed
    1. Hickey JW, et al. Spatial mapping of protein composition and tissue organization: a primer for multiplexed antibody-based imaging. Nat. Methods. 2022;19:284–295. - PMC - PubMed
    1. Chiaradia I, Lancaster MA. Brain organoids for the study of human neurobiology at the interface of in vitro and in vivo. Nat. Neurosci. 2020;23:1496–1508. - PubMed
    1. Takebe T, Wells JM. Organoids by design. Science. 2019;364:956–959. - PMC - PubMed

LinkOut - more resources