. 2023 Jun;30(6):761-769.
doi: 10.1038/s41594-023-00984-y. Epub 2023 May 8.

Structural basis of metabolite transport by the chloroplast outer envelope channel OEP21

Affiliations

Structural basis of metabolite transport by the chloroplast outer envelope channel OEP21

Umut Günsel et al. Nat Struct Mol Biol. 2023 Jun.

Abstract

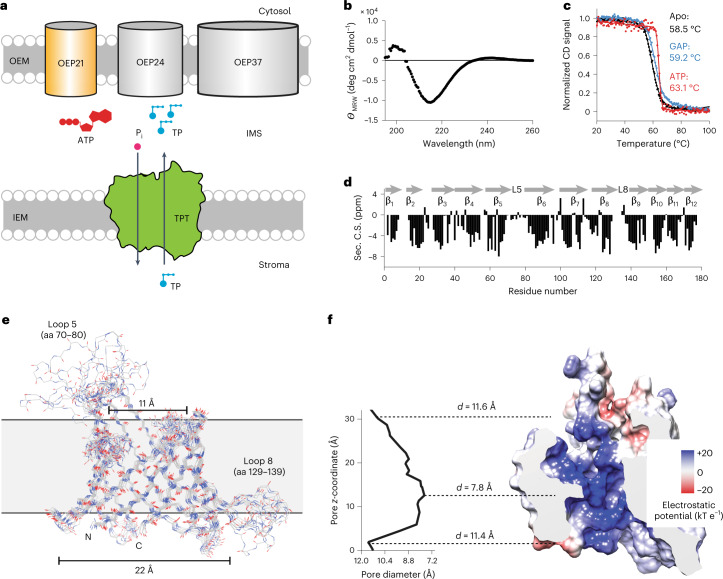
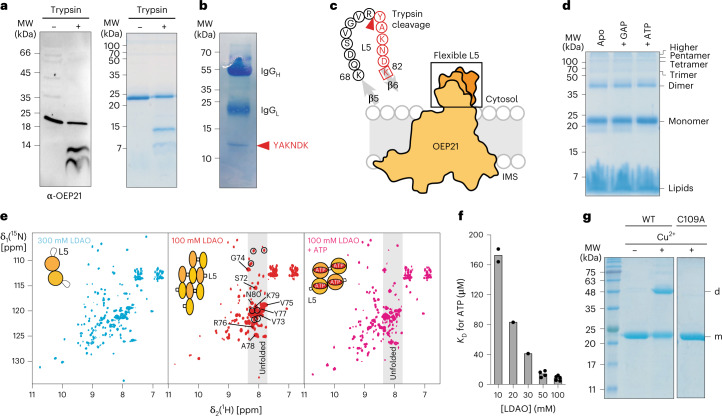
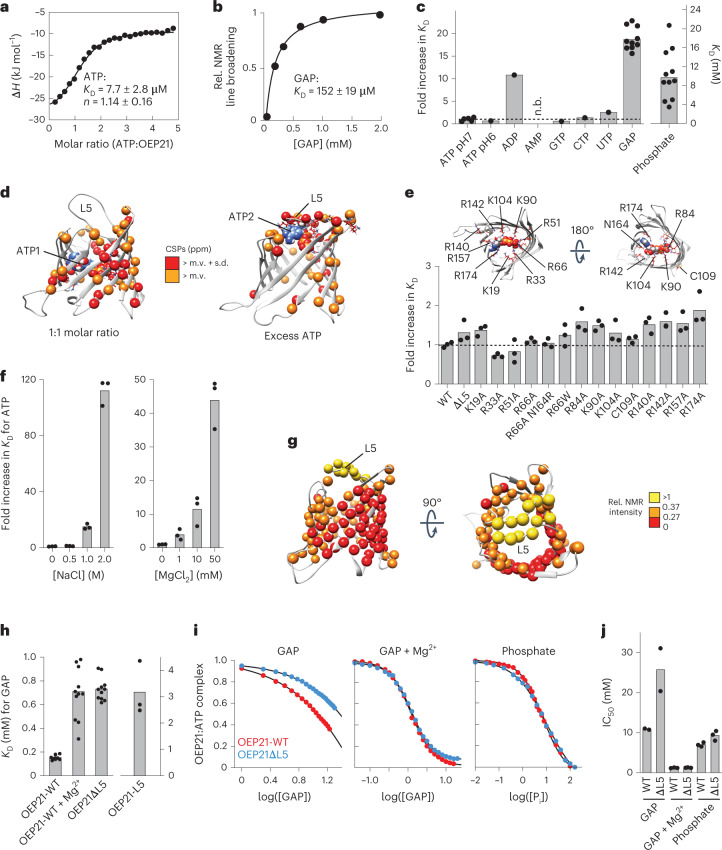
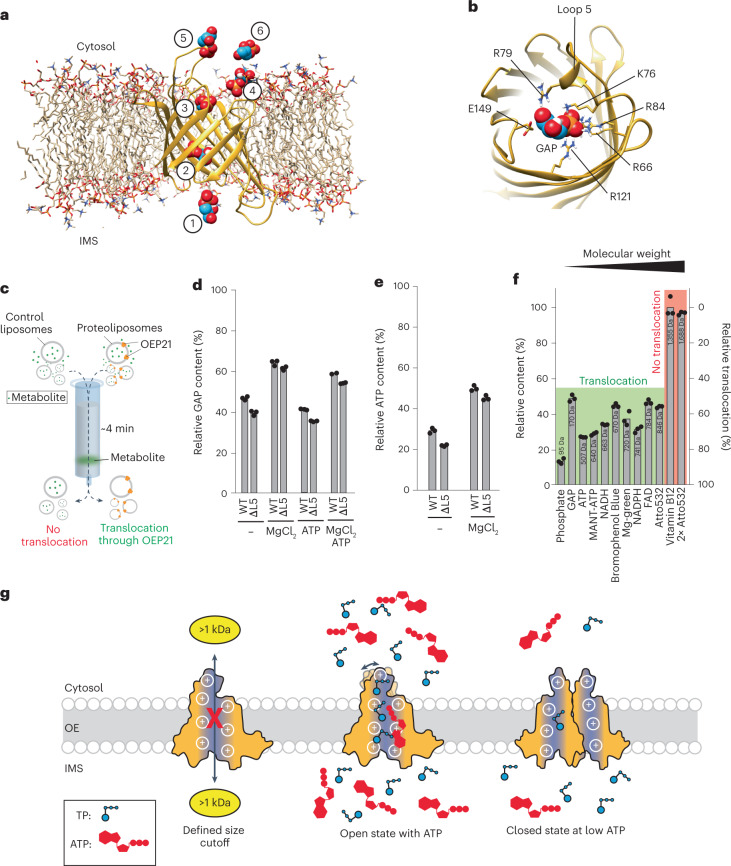
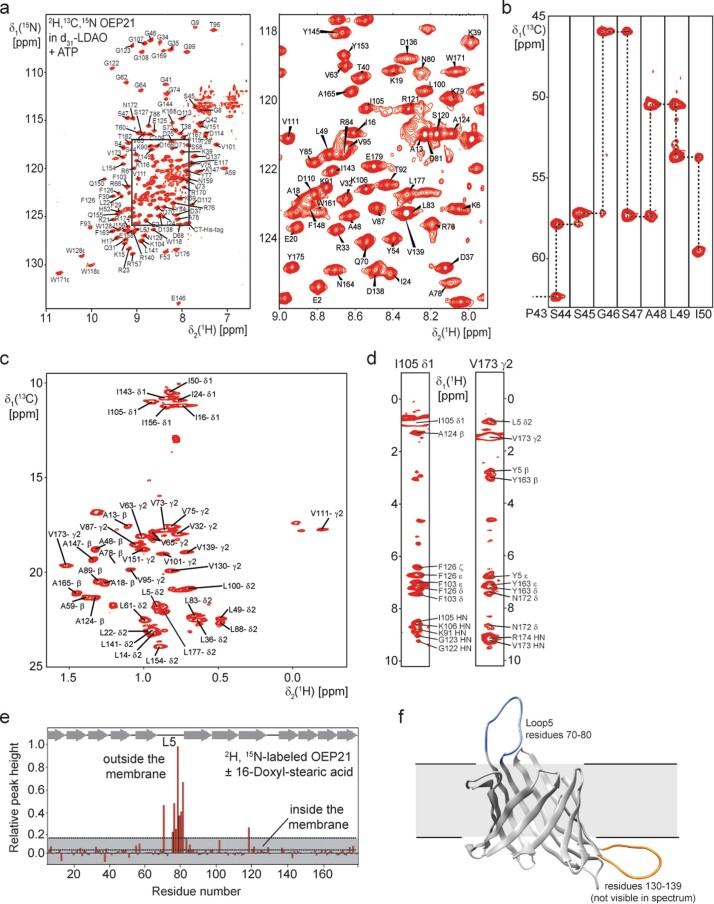
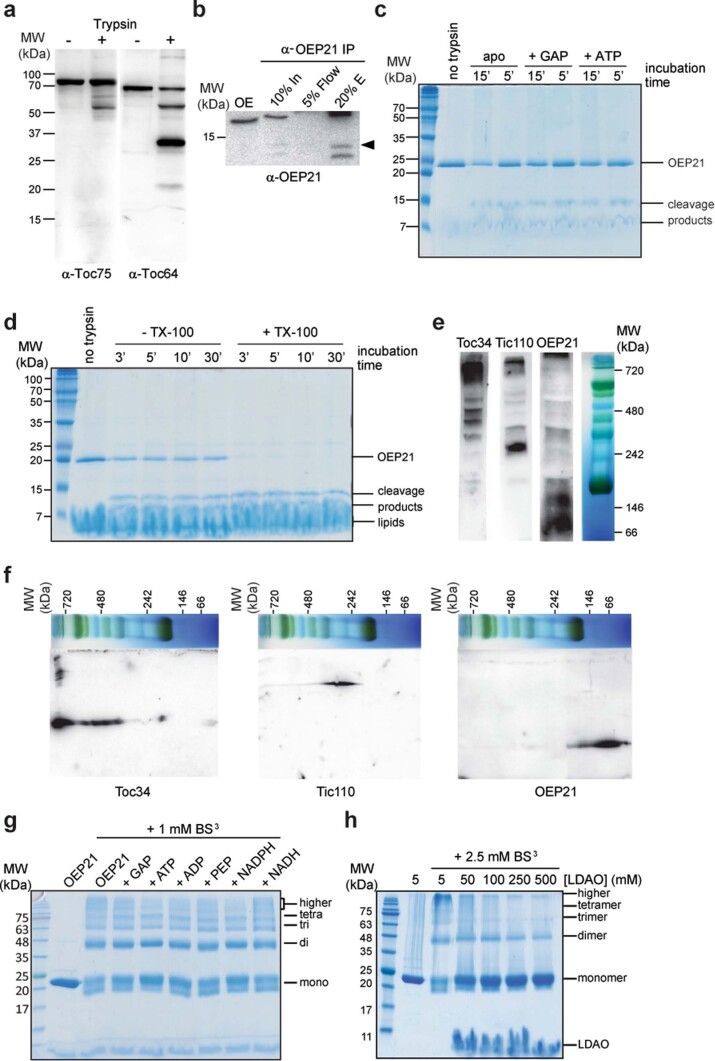
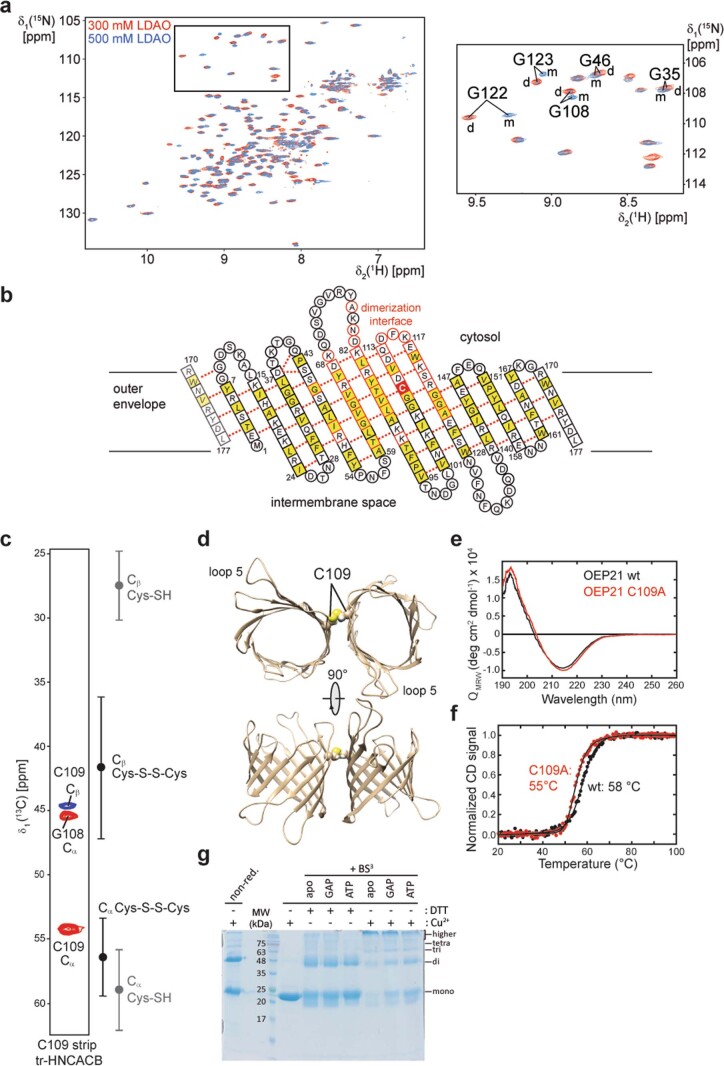
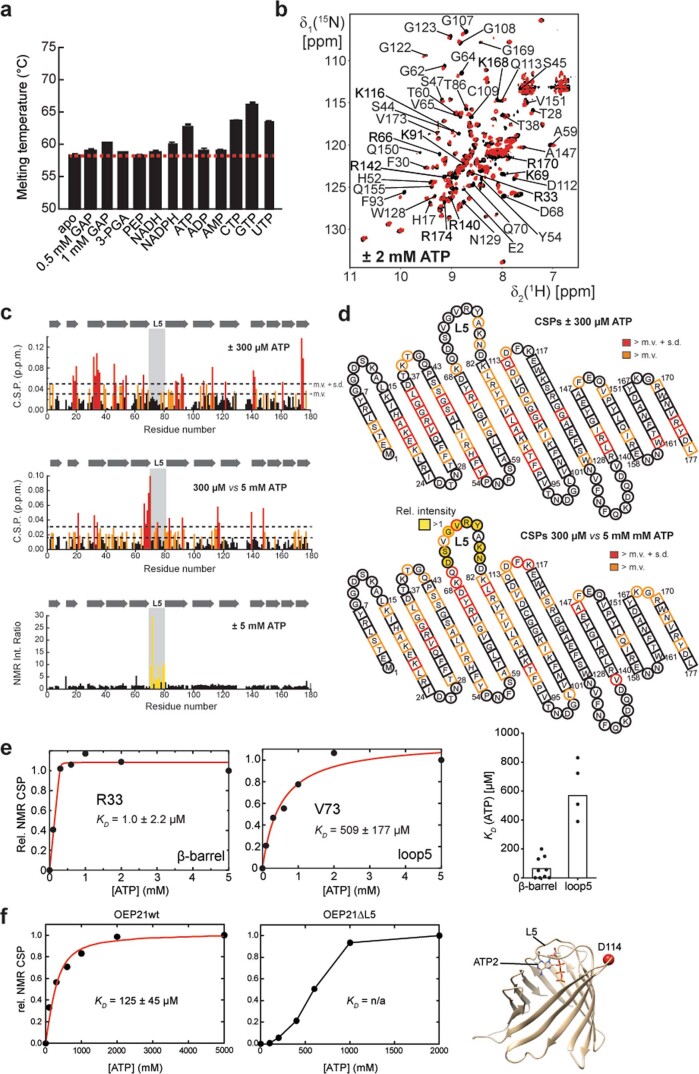
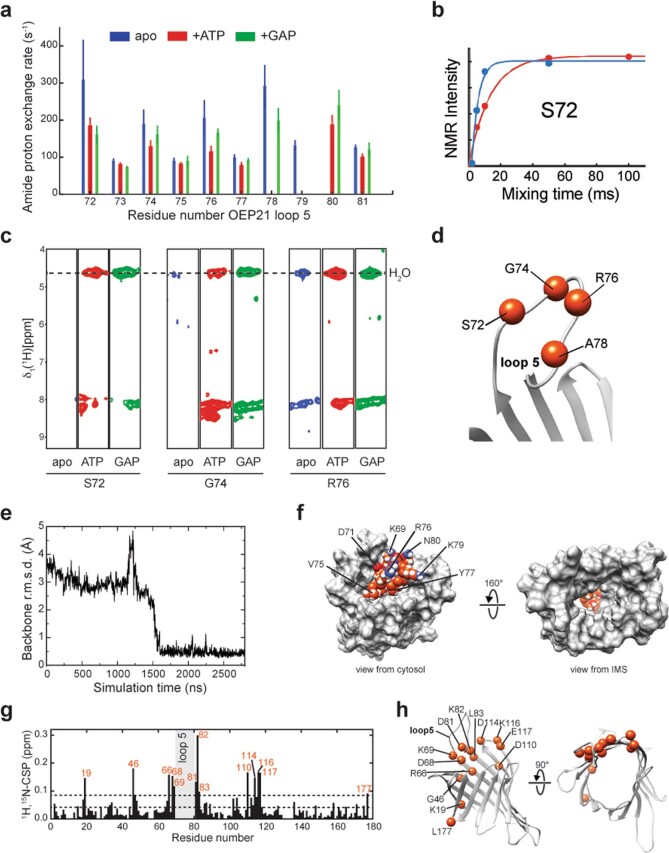
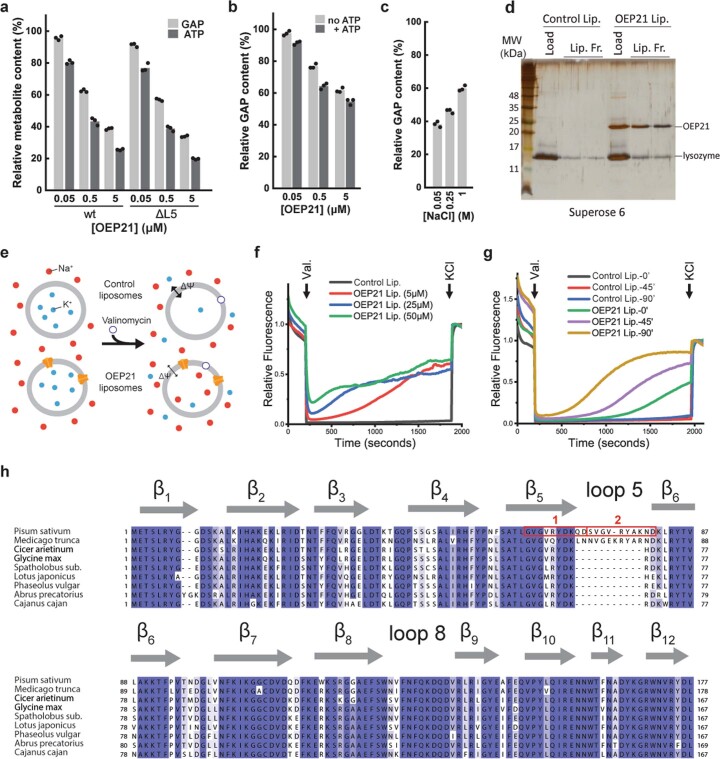
Triose phosphates (TPs) are the primary products of photosynthetic CO2 fixation in chloroplasts, which need to be exported into the cytosol across the chloroplast inner envelope (IE) and outer envelope (OE) membranes to sustain plant growth. While transport across the IE is well understood, the mode of action of the transporters in the OE remains unclear. Here we present the high-resolution nuclear magnetic resonance (NMR) structure of the outer envelope protein 21 (OEP21) from garden pea, the main exit pore for TPs in C3 plants. OEP21 is a cone-shaped β-barrel pore with a highly positively charged interior that enables binding and translocation of negatively charged metabolites in a competitive manner, up to a size of ~1 kDa. ATP stabilizes the channel and keeps it in an open state. Despite the broad substrate selectivity of OEP21, these results suggest that control of metabolite transport across the OE might be possible.


Conflict of interest statement

The authors declare no competing interests.

Figures

Fig. 1
Fig. 1. OEP21 is a highly positively charged β-barrel porin in the OE membrane.
a, TP transport across the IE and OE membranes by the TP/Pi translocator (TPT, PDB:5Y78) and OE proteins (OEPs) of various sizes, such as OEP21, OEP24 and OEP37. Pi, inorganic phosphate. b, Far-UV CD spectrum of recombinant OEP21 in LDAO micelles. ΘMRW, ellipticity mean residue weight. c, Thermal stability of apo-OEP21 and in presence of 0.5 mM GAP or ATP. d, NMR secondary chemical shift (Sec. C.S.) information indicating the presence of 12 β-strand regions of OEP21. e, NMR structural bundle of the OEP21 β-barrel pore showing well-defined secondary structure elements (r.m.s.d. of 0.5 Å) and a funnel-like shape. f, Analysis of the pore geometry, indicating a 7.8-Å-wide constriction site on the electrostatic potential surface map of the pore interior (blue indicates positively charged regions, and negatively charged regions are shown in red). Source data
Fig. 2
Fig. 2. Oligomeric state and orientation of OEP21 in the chloroplast outer envelope.
a, Analysis of trypsin-treated (+) or untreated (–) isolated OE vesicles (left) or recombinant OEP21 reconstituted liposomes (right) by immunoblotting against OEP21 or Coomassie staining. b, Coomassie-stained PVDF membrane from the immunoprecipitated trypsin-treated OEP21 fragment used for Edman sequencing. The immunoprecipitated fragment is indicated by the one-letter amino acid code, as are the positions of the light and heavy chains from the antiserum. c, Topology of OEP21 in the OE. The position of the trypsin cleavage site suggests that L5 is oriented toward the cytosol. d, Analysis of the oligomerization state of OEP21 in liposomes (20 μM) in the apo form or bound to 5 mM GAP or ATP by BS3 crosslinking. e, 2D-[15N,1H]-TROSY NMR experiments with 2H,15N-labeled OEP21 at high (light blue) and low (red) detergent conditions and in the presence of ATP (magenta). Encircled NMR signals in the random coil region are visible only in the oligomeric apo state. f, Affinity between OEP21 and ATP at the indicated LDAO concentrations, derived from ITC experiments. Bars represent the mean value of n ≥ 1 individual measurements. g, Non-reducing SDS–PAGE of WT OEP21 and OEP21-C109A (20 μM) in the absence (–) or presence (+) of oxidizing 1 mM Cu2+. d, dimer; m, monomer. a, d and g are representative of n ≥ 2 independent experiments. Source data
Fig. 3
Fig. 3. Metabolites bind to OEP21 in a charge-dependent and competitive manner.
a,b, ITC (a) and NMR (b) binding experiments with OEP21 and ATP or GAP. ΔH, binding enthalphy. c, Affinities of OEP21 for negatively charged metabolites. Bars indicate mean value of individual measurements, which are multiple ITC or FP experiments (n ≥ 2) or individual residues from the NMR titration experiment (n = 12). n.b., no binding could be detected by ITC for AMP. d, NMR chemical shift perturbations mapped onto an MD-based complex structural model of OEP21 and ATP at an internal, high-affinity (ATP1) and a peripheral, low-affinity (ATP2) binding site. m.v., mean value; s.d., standard deviation. e, Relative KD values of OEP21 variants without L5 or containing single point mutations of positively charged residues obtained from n = 3 fluorescence polarization (FP) measurements with MANT-ATP. f, Effect of NaCl and MgCl2 concentration on the affinity between OEP21 and ATP, measured by FP. Bars represent mean value of n = 3 individual measurements. g, Relative NMR signal intensities of OEP21 upon the addition of 5 mM GAP mapped onto the OEP21 structure. h, The affinity of OEP21 for GAP in the presence of Mg2+or with deletion of L5. OEP21 L5 alone weakly interacts with GAP, as probed by NMR. i, Competition experiments with a complex of MANT-ATP and OEP21-WT or OEP21ΔL5 upon stepwise addition of GAP, GAP + Mg2+, or phosphate. j, IC50 values derived from the experiments shown in i. Bars in h and j represent mean values of n ≥ 2 measurements. Source data
Fig. 4
Fig. 4. OEP21 is a dynamic pore that is stabilized by ATP and allows passage of small metabolites.
a, Translocation trajectory of GAP through the OEP21 pore, obtained by MD simulations (numbers indicate the order of the binding poses in the trajectory). GAP transiently interacts with positive surface patches on OEP21 and finally binds to loop 5 before its dissociation. b, The external binding site is formed by positively charged residues of the pore and loop 5. c, Setup of the SEC translocation assay. d, GAP translocation is increased by ATP and is less efficient with MgCl2. Deletion of L5 slightly increased the translocation efficiency. e, The same as in d, but ATP translocation was monitored. f, Translocation assay with molecules of increasing molecular weight shows that the size cutoff is at ~1 kDa. Bars in d, e and f represent the mean value of n = 3 measurements. Each translocation assay was repeated n ≥ 2 times, with similar results. g, Schematic representation of OEP21 functionality. OEP21 has a substrate cutoff of 1 kDa. At physiological ATP concentrations, OEP21 is in its open state, whereas under oxidative stress and low ATP conditions, enhanced OEP21 oligomerization leads to pore closure. Source data
Extended Data Fig. 1
Extended Data Fig. 1. NMR assignments of OEP21 in LDAO micelles and its membrane location.
3D-triple resonance NMR experiments were performed with a 400 µM 2H,13C,15N-labeled OEP21 in 20 mM Na-phosphate pH 6.0, 50 mM NaCl, 0.5 mM EDTA, 5 mM DTT, 5 mM ATP, 300 mM d31-LDAO and 5 % D2O at 308 K. (a) All assigned NMR resonances in the 2D-[15N,1H]-TROSY are labeled. right panel: expansion of the central crowded spectral region marked by a box in the left panel. (b) Strips of a 3D-tr-HNCA NMR experiment at 308 K with 2H,13C,15N-labeled OEP21 in d31-LDAO micelles in complex with ATP run in a non-uniformly sampled (NUS) manner shows the sequential contacts required for backbone resonance assignment. (c) Assignments of (stereo-) specifically labeled methyl side-chains in OEP21, as indicated by the labels in the shown 2D-[13C,1H]-HMQC spectrum. (d) Representative strips of a NUS 3D-13C-edited-[1H,1H]-NOESY-HMQC experiment with a (stereo-) specifically ILVA 1H,13C methyl-labeled and otherwise 2H,12C,15N-labeled OEP21 sample with incorporated 1H,15N-labeled Phe and Tyr residues in d31-LDAO micelles. (e) Relative peak heights of OEP21 resonances derived from 2D-[15N,1H]-TROSY experiments in 150 mM LDAO or LDAO micelles supplemented with 2 mM 16-doxyl-stearic acid (16-DSA), corresponding to one 16-DSA molecule per micelle. (f) Resonances that are still visible in the 16-DSA sample are mainly located in L5 outside the membrane. Resonances of residues located in the membrane are broadened beyond detection due to the paramagentic effect of the free radical.
Extended Data Fig. 2
Extended Data Fig. 2. Orientation and oligomeric state of OEP21 in the OE membrane and reconstituted liposomes.
(a) Isolated OE vesicles were treated (+) or not treated (-) with trypsin and analyzed by immunoblotting against Toc64 and Toc75. (b) Trypsin-treated OE was immunoprecipitated with antiserum against OEP21. 10% of the input (In), 5% flow through (Flow) and 20% elution (E) were analyzed by immunoblotting against OEP21. Arrowhead indicates the upper 14 kDa proteolytic fragment. (c) Trypsin digestion experiments with 10 µM recombinant OEP21 reconstituted in liposomes prepared with soy polar lipids in the apo form or in presence of 5 mM GAP or 5 mM ATP monitored by Coomassie-stained SDS-PAGE without or with 0.1 µM trypsin. (d) The orientation of 10 µM OEP21 in liposomes was analyzed by trypsin cleavage (0.4 µM) in the absence or presence of 0.2 % triton-100 (TX-100). (e) Chloroplasts enriched with OEV were solubilized with 1% DDM and separated by Blue Native PAGE in a first (e) and SDS PAGE in a second dimension (f) followed by immunoblotting with the indicated antibodies. Molecular weights are indicated to the right of the first-dimension gel slice as deduced by known complex sizes. Toc34 and Tic110 were applied as controls for known complexes in the outer and inner envelope, respectively. (g) Detection of the oligomeric state of OEP21 (20 μM) in LDAO micelles in presence of metabolites (5 mM) using BS3 crosslinking. (h) BS3 crosslinking of OEP21 at increasing detergent concentrations from 5 to 500 mM. Figures (a), (c), (d), (e), (f), (g) and (h) are representatives of n≥2 independent experiments and (b) shows the blot from the sample used for Edmann sequencing. Source data
Extended Data Fig. 3
Extended Data Fig. 3. Detection and analysis of OEP21 dimerization in LDAO micelles.
(a) Left: 2D-[15N,1H]-TROSY NMR experiments at the indicated concentrations of LDAO. Right: Glycine region of the TROSY spectrum (see box) with the monomeric (m) and dimeric (d) species labeled in each case. (b) Residues experiencing pronounced chemical shift perturbations are marked in red in the topology plot. The long β-strands on one side of the β-barrel located around cystein 109 (shown as a filled red box) are strongly affected, suggesting that Cys109 can engage in an inter-monomer disulfide bridge. Hydrophobic amino acids are indicated by yellow boxes. (c) Characteristic NMR chemical shifts for the Cα and Cβ resonances of Cys109 as detected in 3D-tr-HNCA (Cα signals in red) and tr-HN(CA)CB (Cβ signal in blue) experiments indicates the presence of a disulfide bridge in OEP21. (d) Structural model of disulfide-bridged OEP21 as obtained by manual docking, disulfide bond generation and a subsequent equilibration in a 100 ns MD simulation in a DMPC/DMPG lipid bilayer membrane. (e) A comparison of the far-UV CD spectra of OEP21 wt (black) and C109A (red) and (f) CD-detected thermal stability of C109A mutant (55 °C, red) as compared to wt-OEP21 (58 °C, black) at 215 nm. (g) Analysis of oligomerization of OEP21 in monomeric state (+ DTT) or preformed dimers (+ Cu2+) and the effect of GAP or ATP. ‘non-red.’ sample lane shows the Cu2+-oxidized protein prior to BS3 application which was ran under non-reducing conditions. Figure (g) is representative of n = 3 independent experiments. Source data
Extended Data Fig. 4
Extended Data Fig. 4. Stability of OEP21 in the presence of metabolites and NMR titrations with ATP.
(a) CD-detected thermal stabilities of OEP21 measured at 215 nm in 10 mM sodium phosphate pH 7.0, 0.5 mM DTT and 0.1 % LDAO in presence of 0.5 mM metabolites. For GAP, 0.5 and 1 mM concentrations were used, as indicated. Error bars represent the error from curve fitting. (b) 2D-[15N,1H]-TROSY NMR spectra of 300 µM 2H,15N-labeled OEP21 in 20 mM HEPES pH 7.0, 50 mM NaCl, 0.5 mM EDTA, 5 mM DTT and 300 mM LDAO with and without the addition of 2 mM ATP, measured at 950 MHz proton frequency and 303 K. (c) CSPs within 2H,15N-labeled OEP21 upon the addition of 300 μM (top) and 5 mM ATP (bottom) and their comparison (middle). (d) Topology plots for CSPs shown at (c). (e) Dissociation constants for ATP derived from NMR CSP titration data per individual amino acid residues of OEP21 located in the β-barrel pore or L5. Plots of the residues, R33 and V73, were shown as representative plots for β-barrel pore and L5, respectively. The bar diagram shows the average KD values for ATP in the β-barrel and loop regions. (f) NMR titration of D114 with ATP in the presence (OEP21 wt) or absence (OEP21ΔL5) of the loop region. Source data
Extended Data Fig. 5
Extended Data Fig. 5. Interaction of ATP with OEP21 obtained from MD simulations and characterization of the produced OEP21 variants.
(a) (left) Analysis of the population densities of ATP from MD simuations along the OEP21 channel. Negative values along the pore axis indicate the IMS and positive values the cytosol. The two broken vertical lines mark the lipid bilayer membrane region. (middle) Root mean square deviations (r.m.s.d.) within secondary structure elements of OEP21 in complex with ATP4− (ATP 1–8, 2 µs each). (right) Representative binding poses of ATP to OEP21 inside the pore or at the peripheral binding site involving loop 5. (b) LigPlot representation of the interactions in each of the two binding poses. (c) Coomassie-stained SDS-PAGE of OEP21 variants show high protein purity. (d) CD spectra of 10 µM OEP21 variants in 10 mM Na-phosphate pH 7.0, 0.5 mM DTT and 0.1 % LDAO. The β-sheet content of the Δloop5 (red curve) variant is highest due to the missing loop. (e) CD-detected thermal melting points of the samples shown in (c) detected at 215 nm. Source data
Extended Data Fig. 6
Extended Data Fig. 6. NMR titrations of OEP21 with GAP and phosphate and analysis of GAP interaction by MD simulations.
(a) 2D-[15N,1H]-TROSY NMR spectra of 300 µM 2H,15N-labeled OEP21 in 20 mM HEPES pH 7.0, 50 mM NaCl, 0.5 mM EDTA, 5 mM DTT and 300 mM LDAO with and without the addition of 5 mM GAP, measured at 950 MHz proton frequency and 303 K. (b) Intensity ratio of signals in the 2D-[15N,1H]-TROSY NMR spectrum of 2H,15N-labeled OEP21 in the apo form or in presence of 600 µM or 5 mM GAP. (c) Data shown in (b) mapped on the topology plot of OEP21. (d) (top) The rather broad population densities of GAP inside the OEP21 pore indicate that GAP is loosely bound to the channel interior and periphery. Negative values along the pore axis indicate the IMS, positve values the cytosolic side. The two broken vertical lines mark the lipid bilayer membrane region. (middle) r.m.s.d within secondary structure elements of OEP21 in complex with GAP2− (GAP1-5, 2 or 4 µs) show that its structure stays intact during the simulation. (bottom) Representative binding poses of GAP to OEP21 inside the pore or at the peripheral binding site involving loop 5. (e) Chemical shift perturbations and signal intensity ratios of the NMR signals of OEP21 upon the addition of 20 mM phosphate extracted from 2D-[15N,1H]-TROSY NMR experiments. (f) Blue bars in (e) color-coded on the topology plot of OEP21.
Extended Data Fig. 7
Extended Data Fig. 7. Control measurements for the interaction of GAP and ATP with LDAO micelles and their affinities for Mg2+.
(a) (left) 2D-[15N,1H]-TROSY NMR spectra of 400 µM 2H,15N-labeled OmpX in LDAO micelles in 20 mM sodium phosphate, pH6.0, 50 mM NaCl, 0.5 mM EDTA and the indicated concentrations of D-GAP at 30 °C and 1.2 GHz magnetic field. (right) 2D-projections along the 1H dimension of the 2D-spectra shown on (left). (b) (left) 1H NMR spectra of the proton of the aldehyde moiety of GAP (9.64 ppm 1H) at increasing LDAO concentration, as labeled. The decrease in signal indensity indicates an unspecific interaction. (middle) same as in (left) but with the protons in the nucleobase of ATP (8.48 ppm 1H) upon the addition of LDAO at a 50 and 100 mM concentration. No marked signal decrease is observed for ATP, suggesting that it does not interact with the micelle. (right) Relative NMR peak intensities derived from the data in (left) and (middle). Buffer: 10 mM Na-phosphate pH7.0, 20 mM NaCl, 7% (v/v) D2O. (c) (left) 10 mM MgCl2 was titrated into 1 mM ATP. (middle) 100 mM MgCl2 was titrated into 10 mM GAP. (right) 150 mM MgCl2 was titrated into 15 mM potassium phosphate (Pi). Buffer conditions for all experiments were: 10 mM HEPES pH7.0, 20 mM NaCl. The binding stoichiometry (metabolite:Mg2+) is 1:1 for ATP and 1:2 for GAP and phosphate. Source data
Extended Data Fig. 8
Extended Data Fig. 8. MD simulations with a membrane potential to observe GAP translocation across OEP21.
(a) Analysis of the population densities of ATP during a 3 µs MD simulation shows that it interacts with the pore interior and L5. The simulation was stable as indicated by the constant r.m.s.d.values. No transition of ATP was oberved in this time scale. (b) same as in (a) but with GAP. Here, GAP translocation was observed. (c) same as in (b) but with OEP21ΔL5. Without L5 ~10-times more GAP translocation events are observed.
Extended Data Fig. 9
Extended Data Fig. 9. L5 participates in the OEP21 metabolite interaction and can transiently cover the OEP21 pore.
(a) Amide proton exchange rates at 303 K and pH 6.0 for OEP21 L5 determined by CLEANEX NMR experiments are reduced if bound to 2 mM ATP or 5 mM GAP. Under these pH conditions, most of the NMR signals in a 2D-[15N,1H]-TROSY experiment can be observed for L5 even in the apo form, enabling a comparison. Error bars represent the errors obtained from curve fitting. Missing values are due to signal overlap or low peak intensity in the corresponding NMR spectra. (b) Representative builtup curve of the exchange experiment for residue S72 in the apo (blue) and ATP-bound (red) states. (c) Strips from a 3D-15N-edited-[1H,1H]- NOESY-TROSY experiment (40 ms mixing time) with 2H,15N-labeled OEP21 at 303 K and pH 6.0. Diagonal and crosspeaks are absent or very weak in the apo form but visible if bound to ATP or GAP. (d) Residues in L5 that show high exchange rates in the apo state and a marked reduction in the ligand-bound states. (e) r.m.s.d. of L5 backbone coordinates in OEP21 relative to the final pore-inserted state. Insertion of L5 into the pore occurs after ~1.5 µs and stays stably bound until the end of the simulation at 2.8 µs. (f) MD-derived structural model of the final pore-inserted state of L5 in OEP21. (g) NMR CSPs of OEP21 wt versus OEP21ΔL5 in the apo form. Significant CSPs (larger than the CSP mean value plus 1 standard deviation) are labeled. (h) Residues experiencing a significant CSP upon removal of L5 in the apo state are mapped onto the structure of OEP21. Not only residues adjacent to loop 5 are affected but also more remote regions (residues 19, 46 and 110-117), suggesting that loop 5 can sample multiple conformations and affect most parts of the cytosolic opening of the pore.
Extended Data Fig. 10
Extended Data Fig. 10. Analysis of the functionality of OEP21 using SEC and membrane potential measuments, and multiple sequence alignment of OEP21 from different species.
(a) Relative amount of GAP or ATP in OEP21 proteoliposomes subjected to PD10 size exclusion chromatography at increasing OEP21 wt (left) and ΔL5 (right) concentrations. (b) GAP translocation assay with liposomes prepared in absence (light gray) and the presence (dark gray) of 2 mM ATP. (c) GAP translocation assay in the presence of increasing NaCl concentrations. The indicated data points at (a), (b) and (c) show three technical replicates of a representative experiment and bars show mean of the replicates. Similar results were obtained at least n ≥ 2 independent experiments. (d) SDS-PAGE of lysozyme loaded control (left) and OEP21 containing (right) liposomes applied to Superose 6 SEC column. Similar results were obtained for n = 2 independent experiments. (e) Schematic representation of the ΔΨ experiments. K+ ion specific ionophore valinomycin allows its passage from the liposomes resulting in generation of ΔΨ due to ionic imbalance across the liposomal membrane. Control liposomes keep ΔΨ by not allowing Na+ leakage into liposomes while OEP21 liposomes lose it due to passage of Na+ ions through the pore of OEP21. (f) Increasing OEP21 concentration cause faster loss of ΔΨ. Liposomes prepared in the presence of 250 mM KCl were diluted (1:1000) in the buffer containing 250 mM NaCl and the loss of potential measured directly after dilution utilizing fluoresence of potentiometric dye DiSC3(5). (g) Control liposomes or liposomes containing 5 µM OEP21 were diluted in the NaCl buffer as in (f) and they were masured either directly after dilution (0′) or after indicated time points (45′ and 90′). (h) Multiple sequence alignment of OEP21 from various C3 plants. In this compilation, L5 is only present in pea (Pisum sativum) and clover (Medicago trunca) (first two sequences from the top). All other parts of OEP21 show very high sequence conservation. A sequence analyis also suggests that loop 5 is a duplication of a directly adjacent peptide strech (aa 61–71), as indicated by the red boxes and numbers. Source data

Similar articles

Cited by

References

    1. Heineke D, et al. Redox transfer across the inner chloroplast envelope membrane. Plant Physiol. 1991;95:1131–1137. doi: 10.1104/pp.95.4.1131. - DOI - PMC - PubMed
    1. Fischer K. The import and export business in plastids: transport processes across the inner envelope membrane. Plant Physiol. 2011;155:1511–1519. doi: 10.1104/pp.110.170241. - DOI - PMC - PubMed
    1. Flügge UI, Benz R. Pore-forming activity in the outer membrane of the chloroplast envelope. FEBS Lett. 1984;169:85–89. doi: 10.1016/0014-5793(84)80294-X. - DOI
    1. Flugge UI. Transport in and out of plastids: does the outer envelope membrane control the flow? Trends Plant Sci. 2000;5:135–137. doi: 10.1016/S1360-1385(00)01578-8. - DOI - PubMed
    1. Bölter B, Soll J. Ion channels in the outer membranes of chloroplasts and mitochondria: open doors or regulated gates? EMBO J. 2001;20:935–940. doi: 10.1093/emboj/20.5.935. - DOI - PMC - PubMed

Publication types

MeSH terms