

Catch me if you can: capturing microbial community transformation by extracellular DNA using Hi-C sequencing
- PMID: 37156983
- PMCID: PMC10257627
- DOI: 10.1007/s10482-023-01834-z
Catch me if you can: capturing microbial community transformation by extracellular DNA using Hi-C sequencing
Abstract
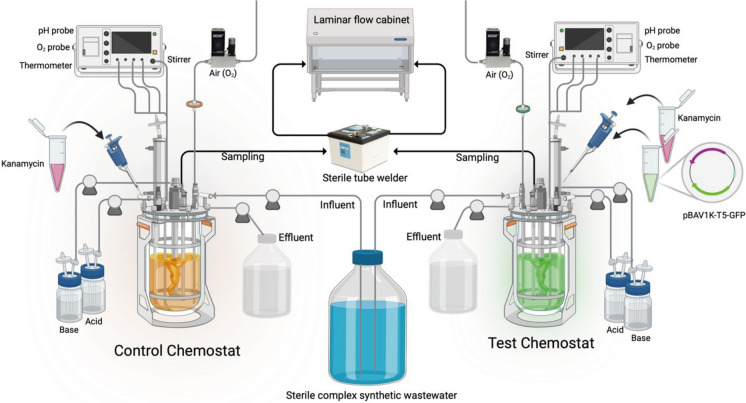
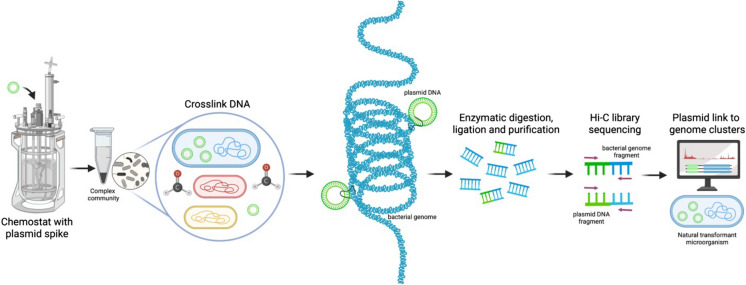
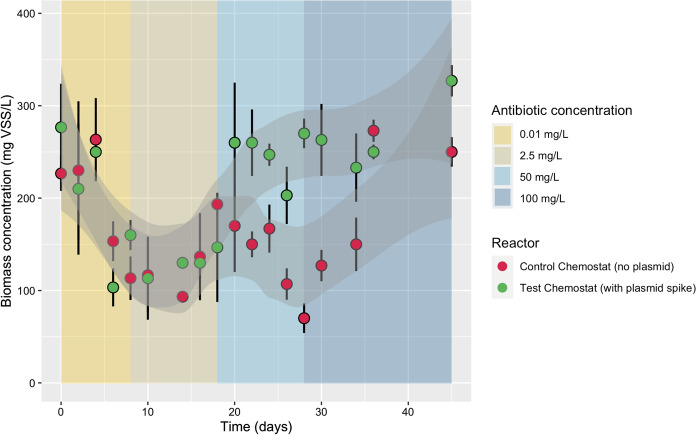
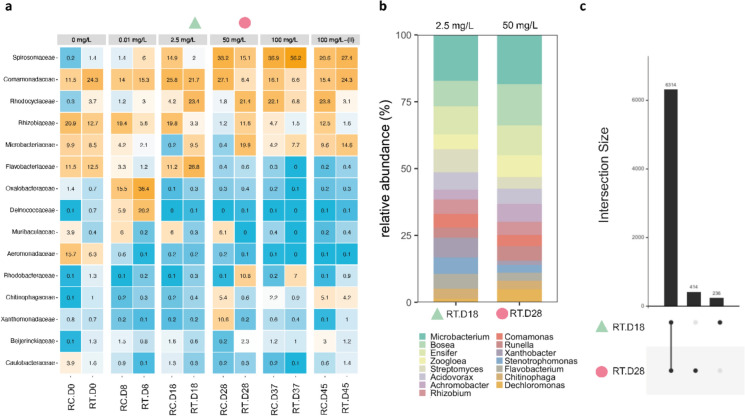
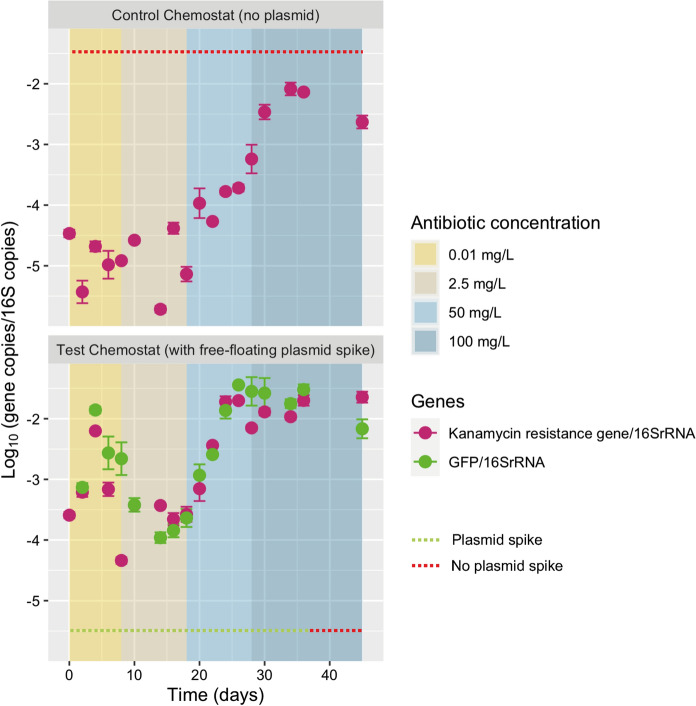
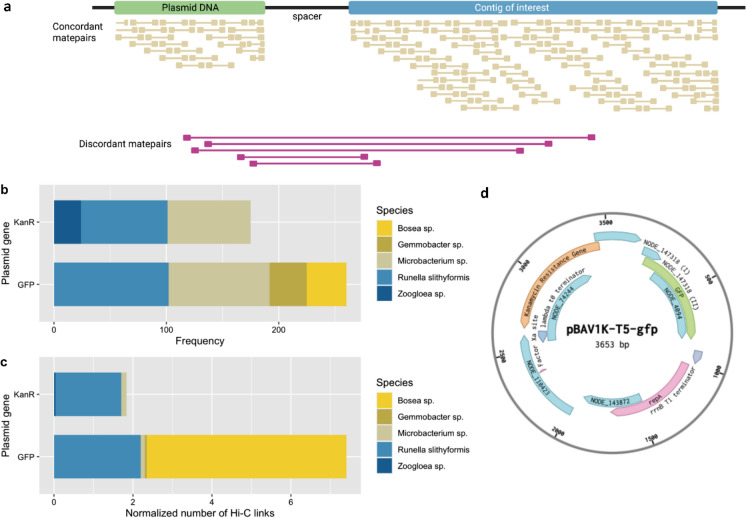
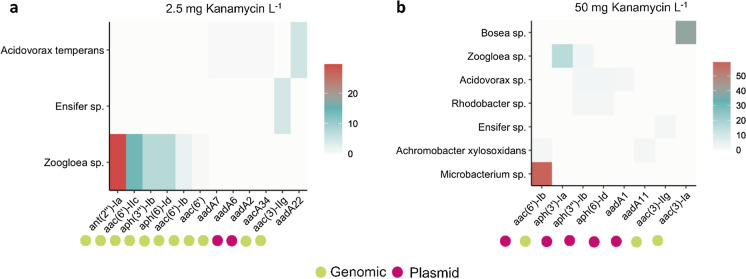
The transformation of environmental microorganisms by extracellular DNA is an overlooked mechanism of horizontal gene transfer and evolution. It initiates the acquisition of exogenous genes and propagates antimicrobial resistance alongside vertical and conjugative transfers. We combined mixed-culture biotechnology and Hi-C sequencing to elucidate the transformation of wastewater microorganisms with a synthetic plasmid encoding GFP and kanamycin resistance genes, in the mixed culture of chemostats exposed to kanamycin at concentrations representing wastewater, gut and polluted environments (0.01-2.5-50-100 mg L-1). We found that the phylogenetically distant Gram-negative Runella (102 Hi-C links), Bosea (35), Gemmobacter (33) and Zoogloea (24) spp., and Gram-positive Microbacterium sp. (90) were transformed by the foreign plasmid, under high antibiotic exposure (50 mg L-1). In addition, the antibiotic pressure shifted the origin of aminoglycoside resistance genes from genomic DNA to mobile genetic elements on plasmids accumulating in microorganisms. These results reveal the power of Hi-C sequencing to catch and surveil the transfer of xenogenetic elements inside microbiomes.
Keywords: Antibiotic resistance; Hi-C sequencing; Mixed cultures; Plasmids; Transformation.
© 2023. The Author(s).
Conflict of interest statement
The authors declare no competing interests.
Figures
Similar articles
-
Deciphering conjugative plasmid permissiveness in wastewater microbiomes.Mol Ecol. 2017 Jul;26(13):3556-3571. doi: 10.1111/mec.14138. Epub 2017 May 6. Mol Ecol. 2017. PMID: 28390108
-
Screening and Potential of the Incidence of Resistance Transfer Among the Multidrug and Heavy Metal Resistant Gram-Negative Isolates from Hospital Effluents of Northern India.Recent Pat Antiinfect Drug Discov. 2018;13(2):164-179. doi: 10.2174/1574891X13666180702111330. Recent Pat Antiinfect Drug Discov. 2018. PMID: 29984669
-
Antibiotic Resistance in Vibrio cholerae: Mechanistic Insights from IncC Plasmid-Mediated Dissemination of a Novel Family of Genomic Islands Inserted at trmE.mSphere. 2020 Aug 26;5(4):e00748-20. doi: 10.1128/mSphere.00748-20. mSphere. 2020. PMID: 32848007 Free PMC article.
-
Towards a better understanding of antimicrobial resistance dissemination: what can be learnt from studying model conjugative plasmids?Mil Med Res. 2022 Jan 10;9(1):3. doi: 10.1186/s40779-021-00362-z. Mil Med Res. 2022. PMID: 35012680 Free PMC article. Review.
-
Monitoring plasmid-mediated horizontal gene transfer in microbiomes: recent advances and future perspectives.Plasmid. 2018 Sep;99:56-67. doi: 10.1016/j.plasmid.2018.08.002. Epub 2018 Aug 4. Plasmid. 2018. PMID: 30086339 Review.
Cited by
-
Landscape of the metaplasmidome of deep-sea hydrothermal vents located at Arctic Mid-Ocean Ridges in the Norwegian-Greenland Sea: ecological insights from comparative analysis of plasmid identification tools.FEMS Microbiol Ecol. 2024 Sep 14;100(10):fiae124. doi: 10.1093/femsec/fiae124. FEMS Microbiol Ecol. 2024. PMID: 39271469 Free PMC article.
-
Expanding the β-Lactamase Family in the Human Microbiome.Adv Sci (Weinh). 2024 Dec;11(46):e2403563. doi: 10.1002/advs.202403563. Epub 2024 Oct 24. Adv Sci (Weinh). 2024. PMID: 39447121 Free PMC article.
-
Understanding the transfer and persistence of antimicrobial resistance in aquaculture using a model teleost gut system.Anim Microbiome. 2025 Feb 22;7(1):18. doi: 10.1186/s42523-025-00377-0. Anim Microbiome. 2025. PMID: 39987284 Free PMC article.
-
Resistome expansion in disease-associated human gut microbiomes.Microbiome. 2023 Jul 29;11(1):166. doi: 10.1186/s40168-023-01610-1. Microbiome. 2023. PMID: 37507809 Free PMC article.
References
-
- APHA (2005) Standard methods for the examination of water and wastewater: 21st ed. A, 21st edn., Washington
-
- Andersen, K.S., Kirkegaard, R.H., Karst, S.M., Albertsen, M.: ampvis2: an R package to analyse and visualise 16S rRNA amplicon data. bioRxiv 10–11 (2018). 10.1101/299537
-
- Andrews, S. (2010). FastQC: A Quality Control Tool for High Throughput Sequence Data [Online]. Available online at: http://www.bioinformatics.babraham.ac.uk/projects/fastqc/
MeSH terms
Substances
Grants and funding
LinkOut - more resources
Full Text Sources
Miscellaneous
