. 2023 May;55(5):796-806.
doi: 10.1038/s41588-023-01384-0. Epub 2023 May 8.

Genetic architecture of the inflammatory bowel diseases across East Asian and European ancestries

Collaborators, Affiliations

Genetic architecture of the inflammatory bowel diseases across East Asian and European ancestries

Zhanju Liu et al. Nat Genet. 2023 May.

Abstract

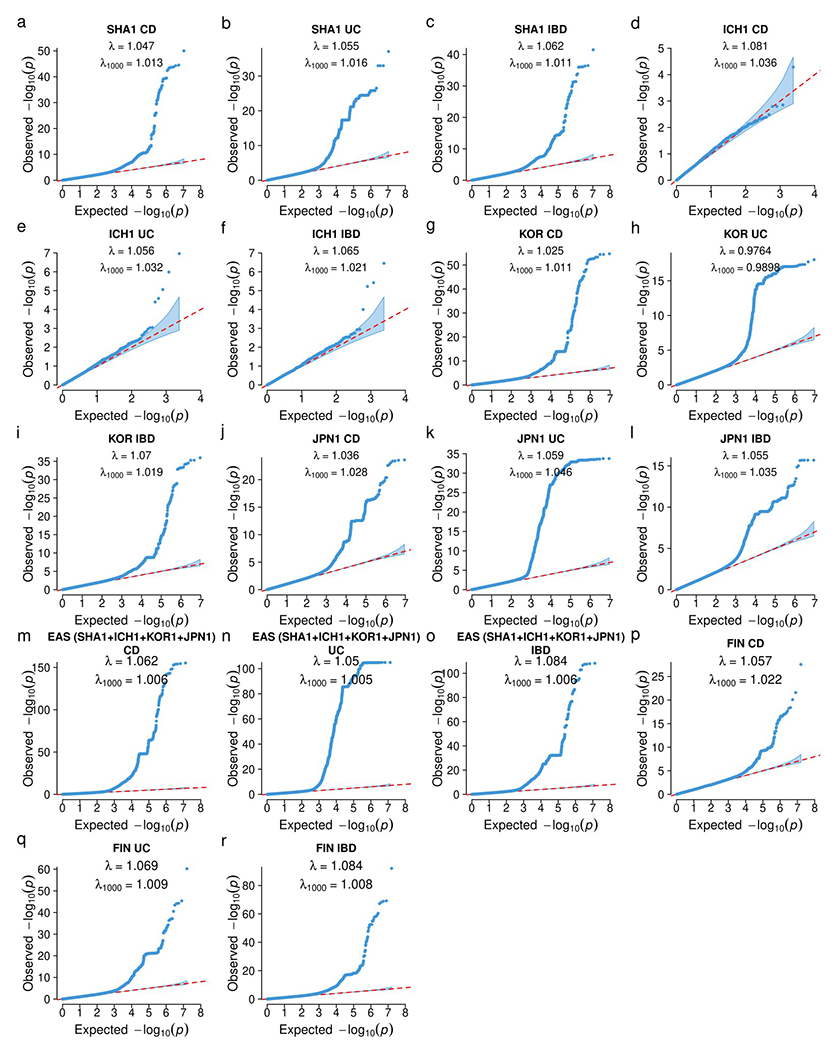
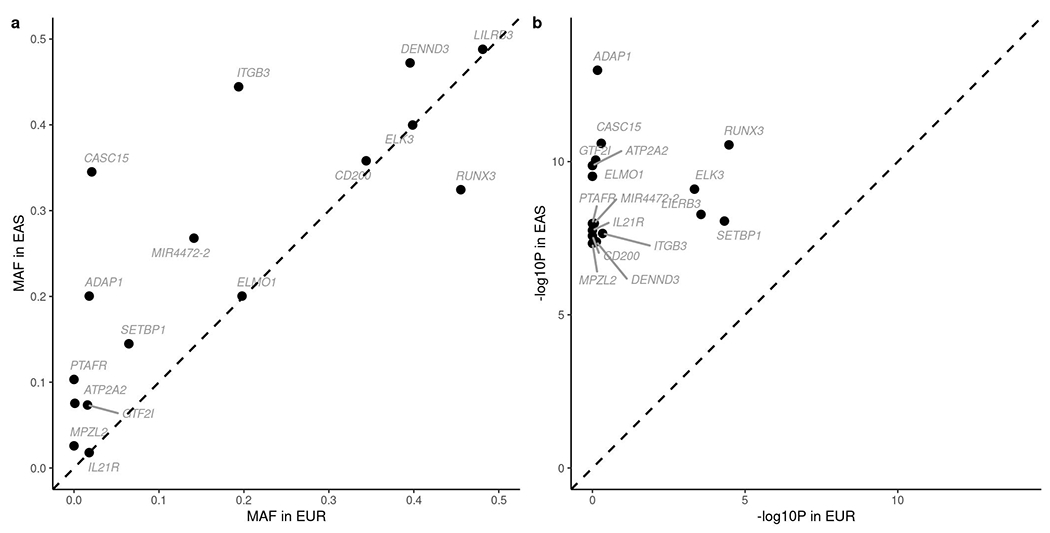
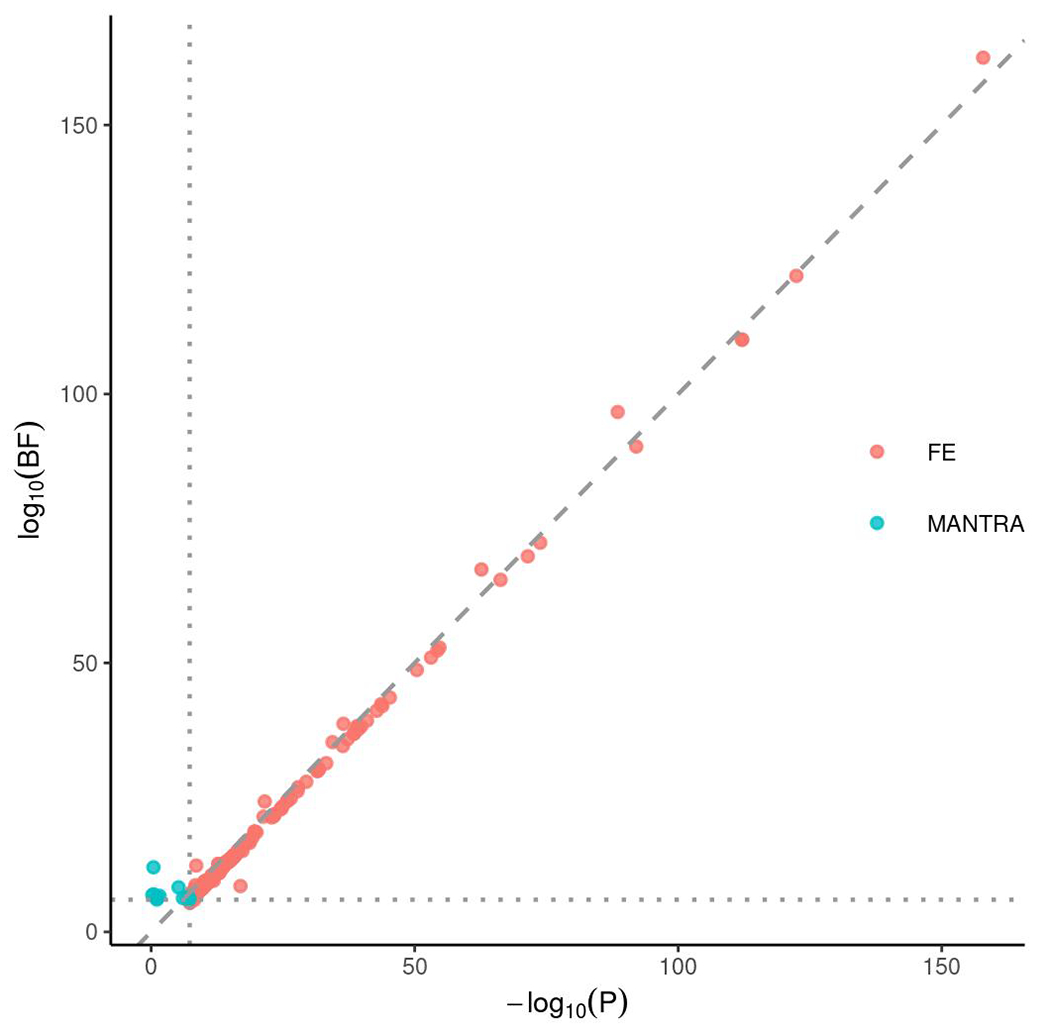
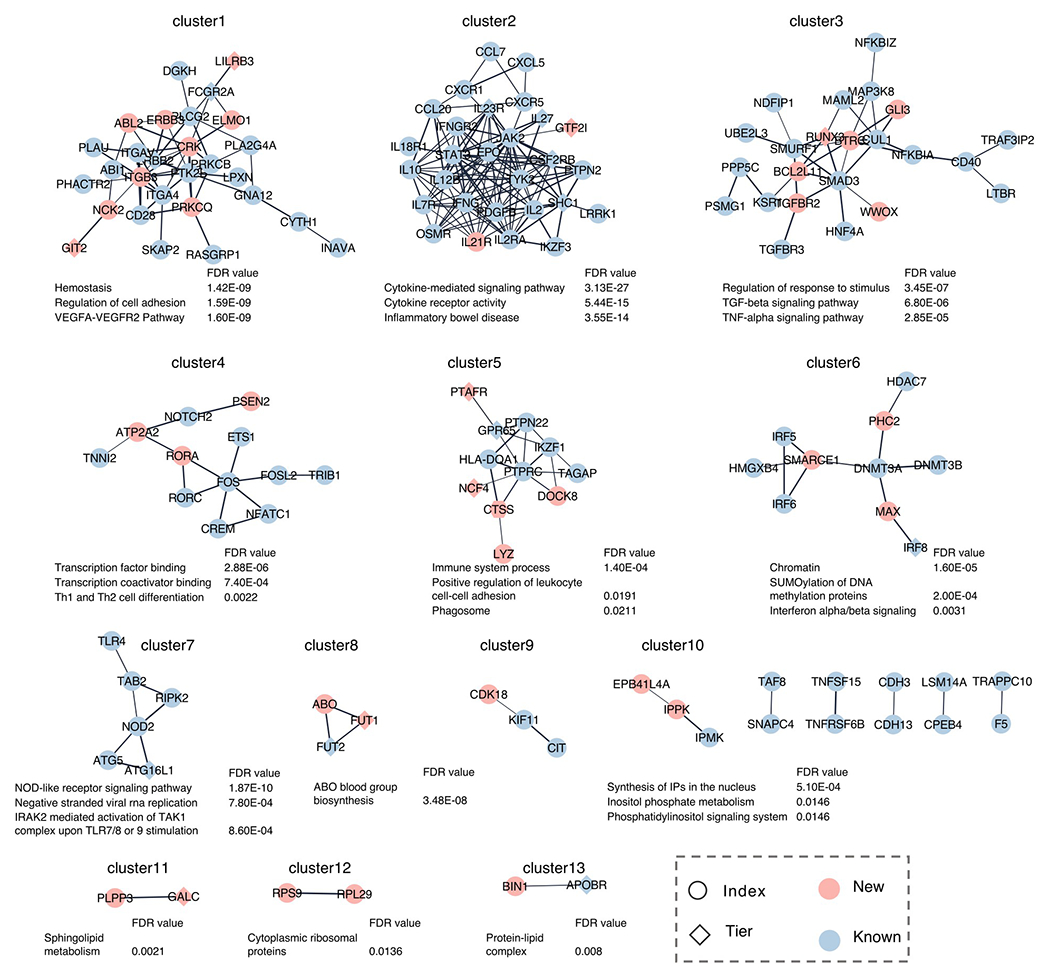
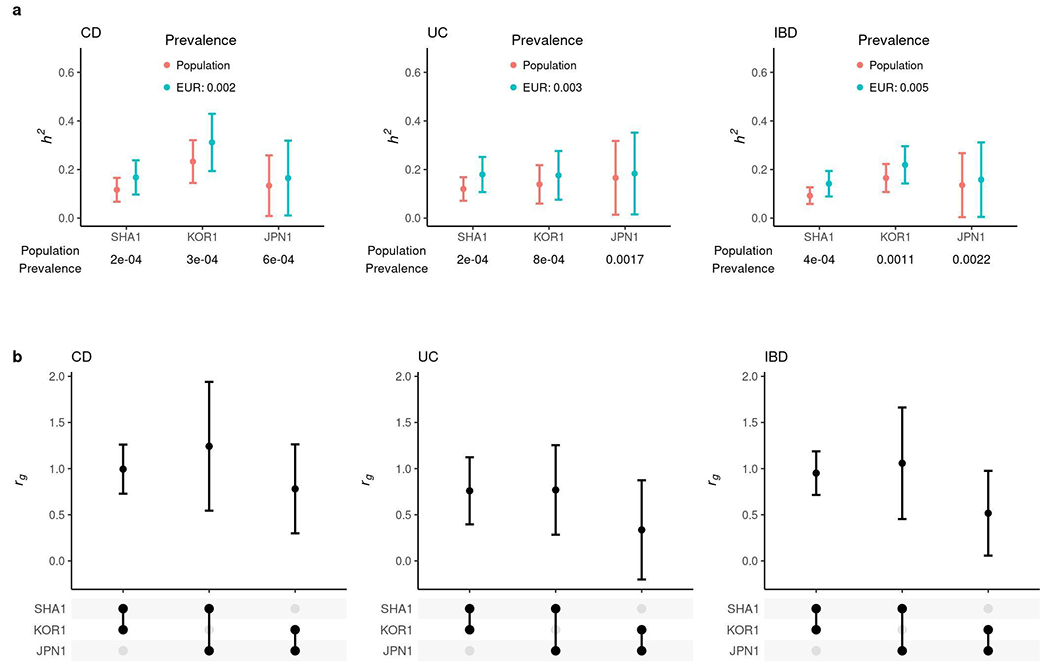
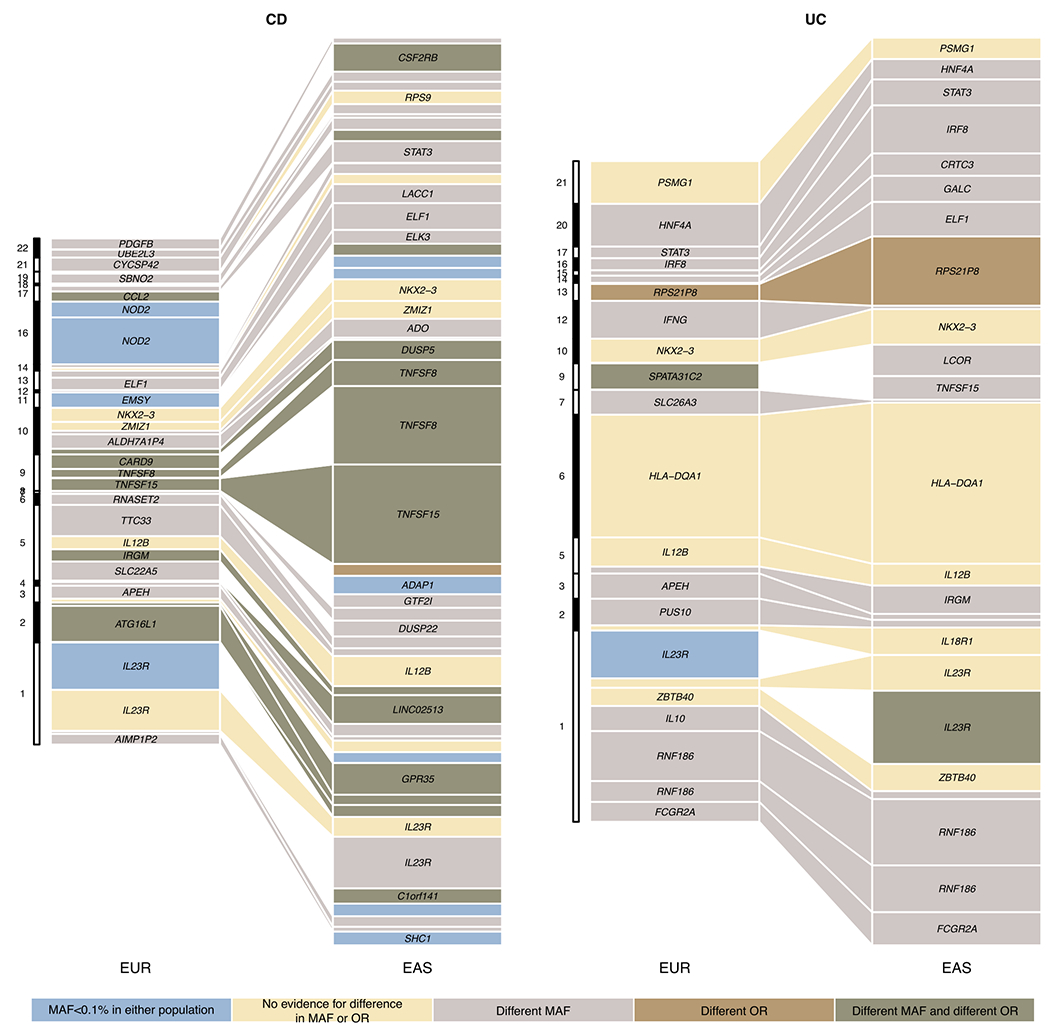
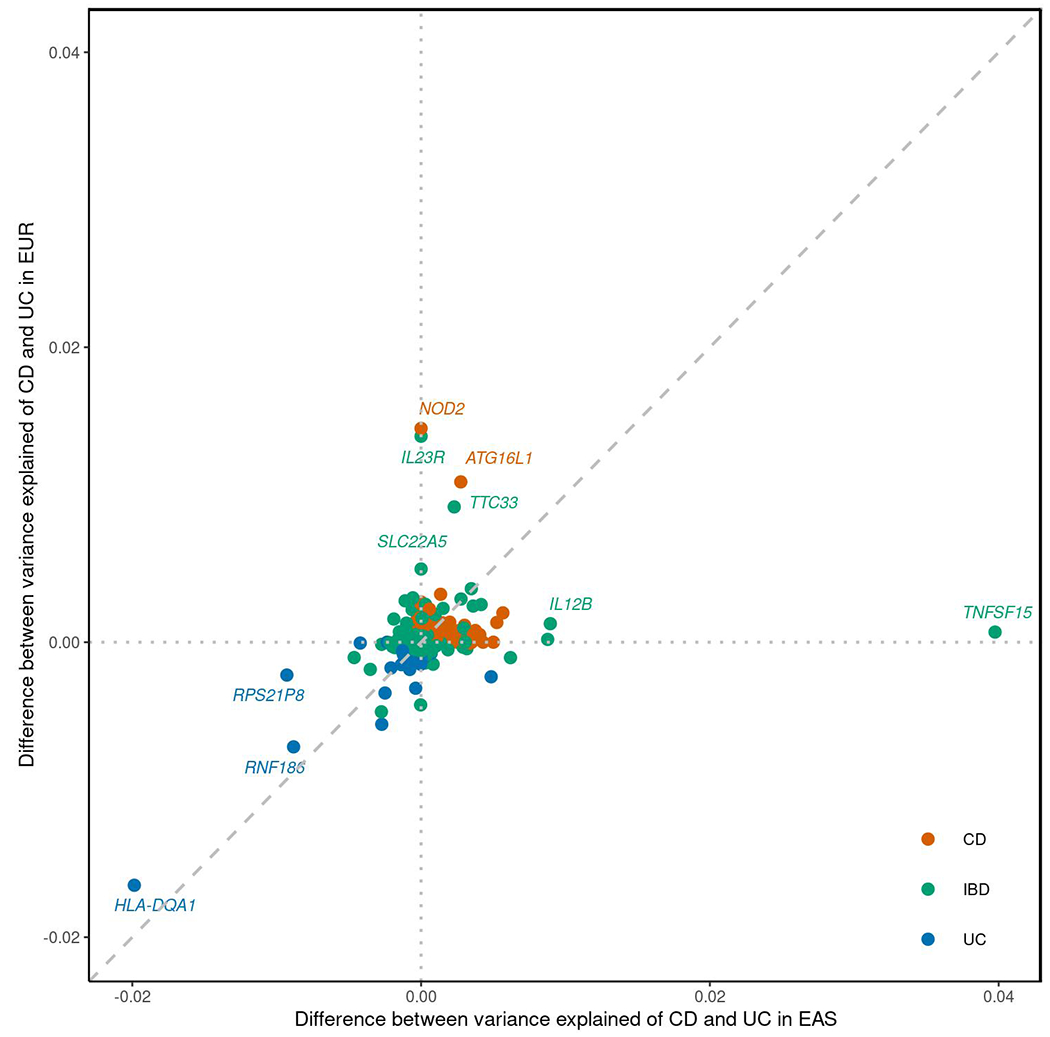
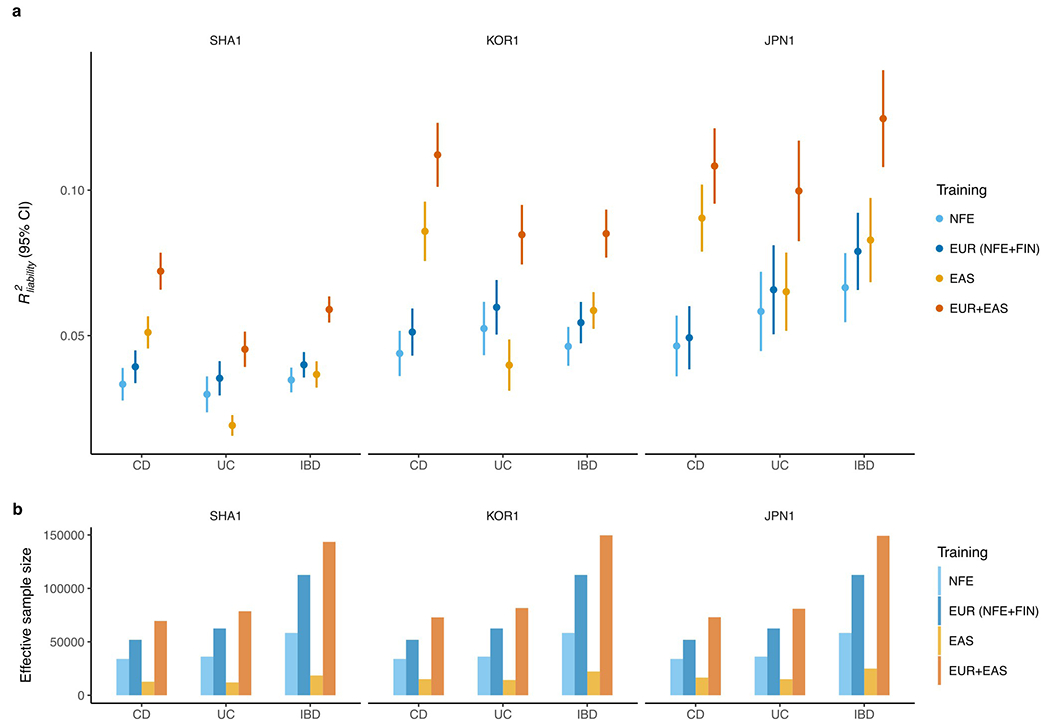
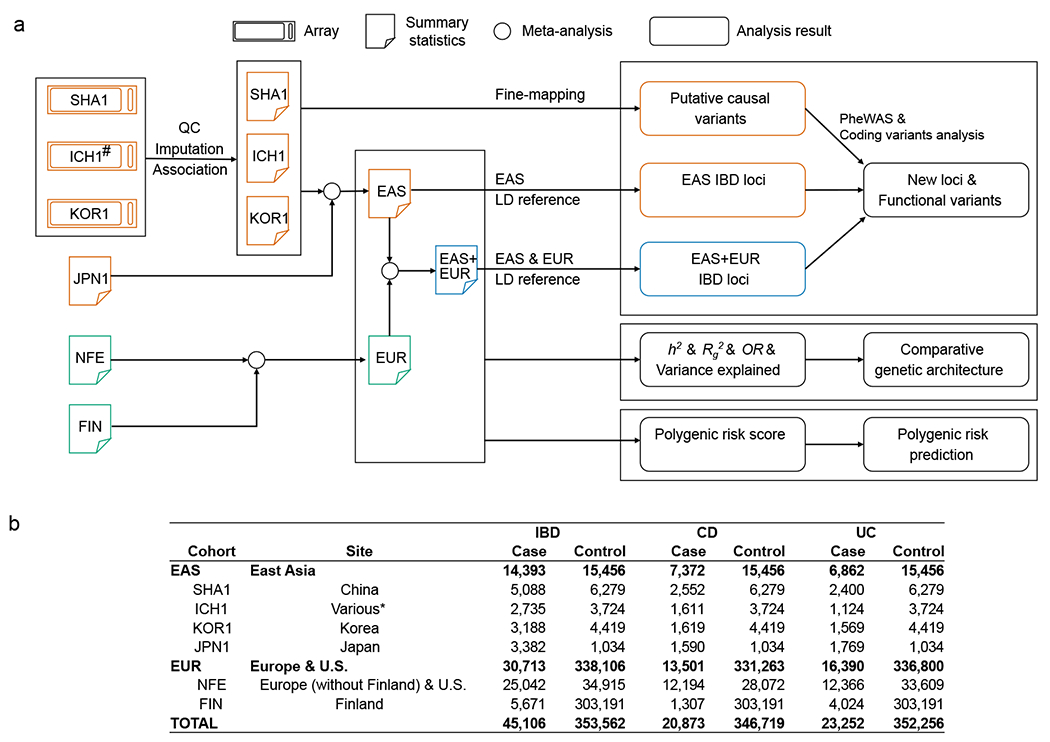
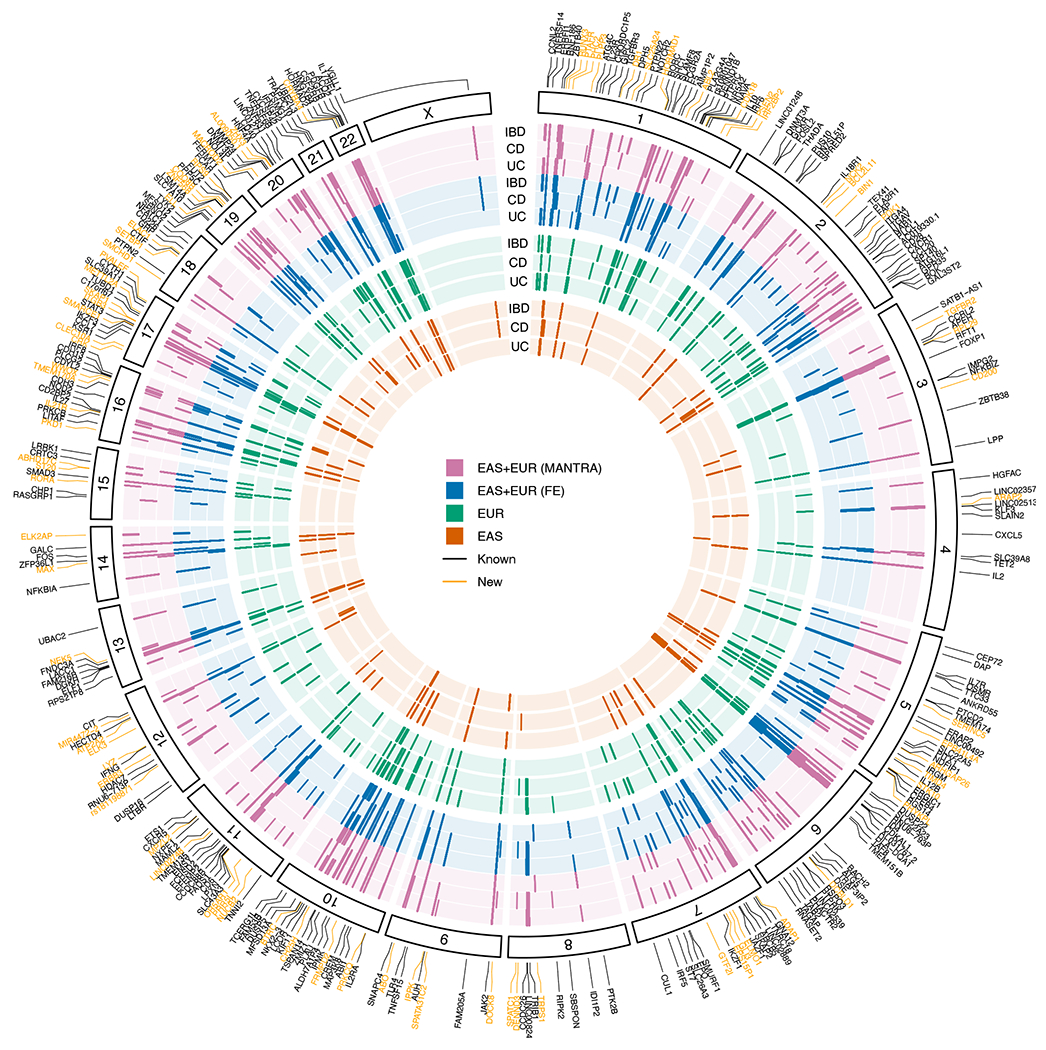
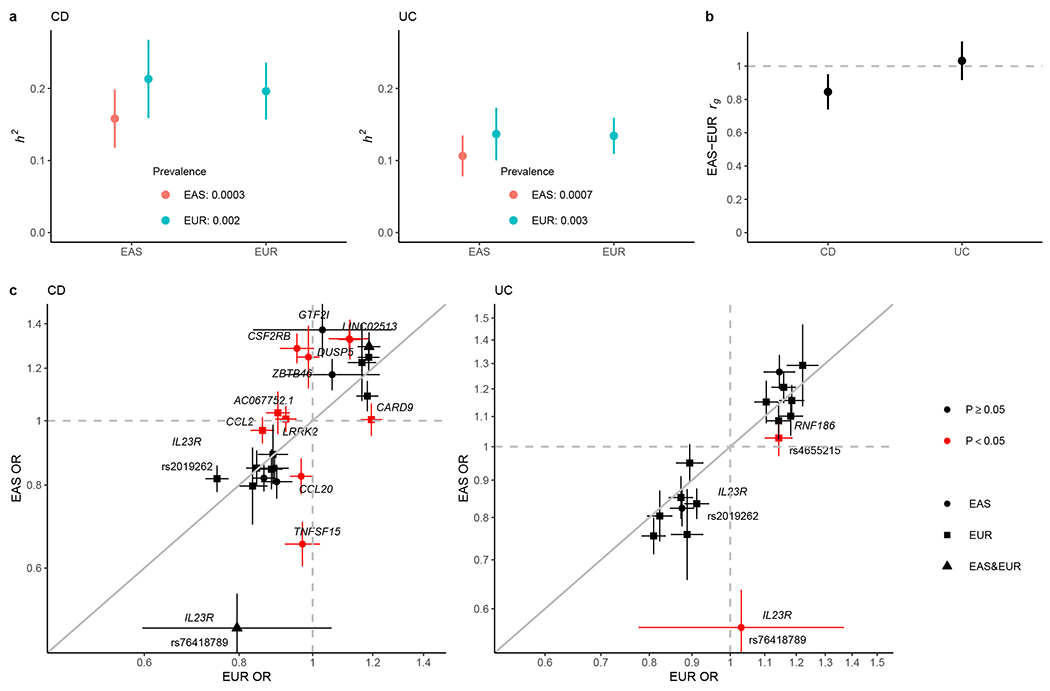
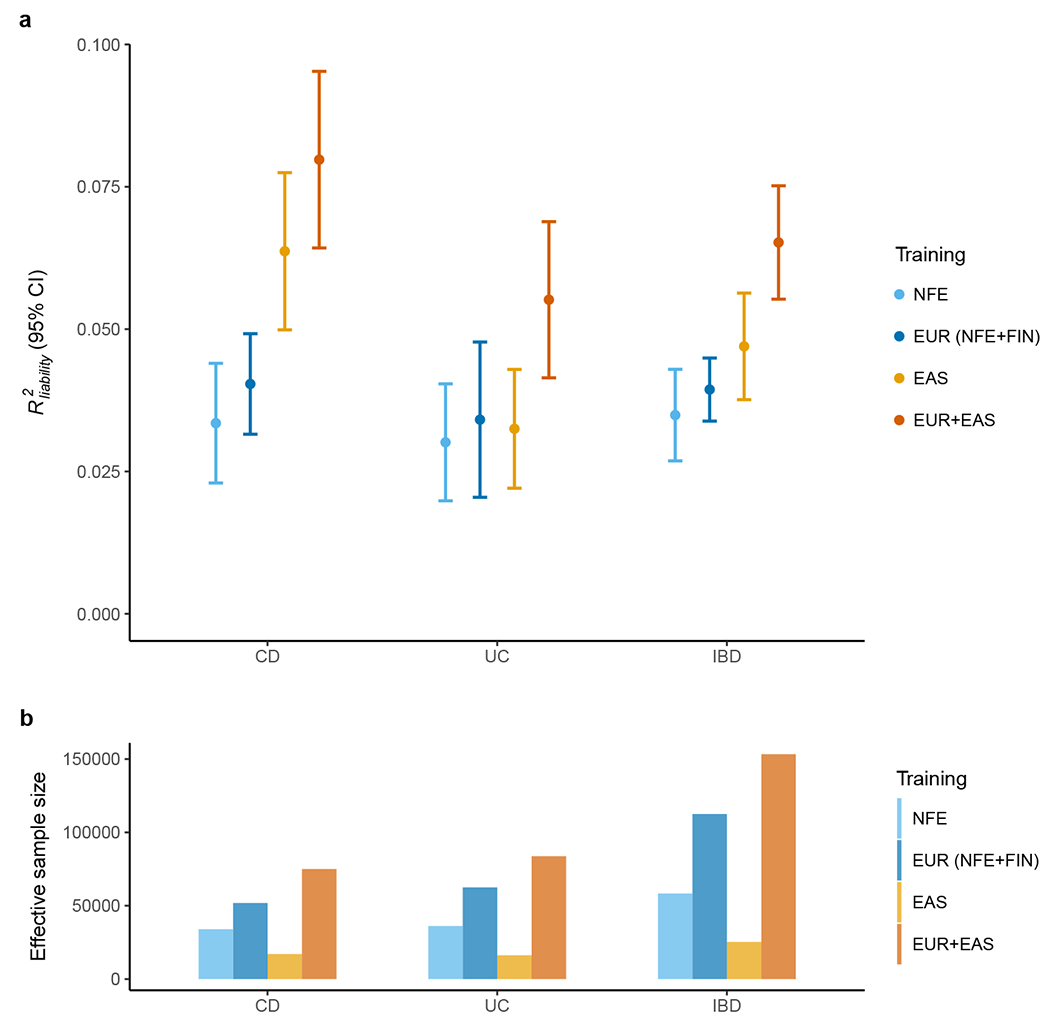
Inflammatory bowel diseases (IBDs) are chronic disorders of the gastrointestinal tract with the following two subtypes: Crohn's disease (CD) and ulcerative colitis (UC). To date, most IBD genetic associations were derived from individuals of European (EUR) ancestries. Here we report the largest IBD study of individuals of East Asian (EAS) ancestries, including 14,393 cases and 15,456 controls. We found 80 IBD loci in EAS alone and 320 when meta-analyzed with ~370,000 EUR individuals (~30,000 cases), among which 81 are new. EAS-enriched coding variants implicate many new IBD genes, including ADAP1 and GIT2. Although IBD genetic effects are generally consistent across ancestries, genetics underlying CD appears more ancestry dependent than UC, driven by allele frequency (NOD2) and effect (TNFSF15). We extended the IBD polygenic risk score (PRS) by incorporating both ancestries, greatly improving its accuracy and highlighting the importance of diversity for the equitable deployment of PRS.


Conflict of interest statement

COMPETING INTERESTS

W.S. and C.S. are employees of Digital Health China Technologies Corp. Ltd.. M.J.D. is a founder of Maze Therapeutics. D.P.B.M. has received consultancy fees from Prometheus Biosciences, Prometheus Laboratories, Takeda, Gilead, Pfizer. Stock - Prometheus Biosciences. B.D.Y. has served on advisory boards for AbbVie Korea, Celltrion, Daewoong Pharma, Ferring Korea, Janssen Korea, Pfizer Korea, and Takeda Korea; has received research grants from Celltrion and Pfizer Korea; has received consulting fees from Chong Kun Dang Pharm., CJ Red BIO, Cornerstones Health, Daewoong Pharma, IQVIA, Kangstem Biotech, Korea United Pharm. Inc., Medtronic Korea, NanoEntek, and Takeda; and has received speaking fees from AbbVie Korea, Celltrion, Ferring Korea, IQVIA, Janssen Korea, Pfizer Korea, Takeda, and Takeda Korea. H.H. received consultancy fees from Ono Pharmaceutical and honorarium from Xian Janssen Pharmaceutical. The remaining authors declare no competing interests.

Figures

Extended Data Fig. 1
Extended Data Fig. 1. Quantile-Quantile plots for IBD genetic associations.
λ: genomic inflation factor; λ1000 : scaled inflation factor for an equivalent study of 1000 cases and 1000 controls. The dots indicate variants. Shaded area indicates the 95% confidence interval under the null distribution. a-c, SHA1. d-f, ICH1 (only the designated null variants in ImmunoChip were used). g-i, KOR1. j-l, JPN1. m-o, meta-analysis including all EAS samples (SHA1, ICH1, KOR1, and JPN1), p-r, FIN. a, d, g, j, m, p are for CD. b, e, h, k, n, q are for UC. c, f, i, l, o, r are for IBD.
Extended Data Fig. 2
Extended Data Fig. 2. Index variants in the 16 new IBD EAS loci.
a, Minor allele frequency (MAF) taken from 1000 Genomes EAS and EUR reference panels respectively. b, P-value in respective studies.
Extended Data Fig. 3
Extended Data Fig. 3. Comparison between the fixed-effect (FE) meta-analysis and MANTRA.
Index variants in loci identified by either FE or MANTRA were plotted. For FE, we used genome-wide significance threshold of 5 × 10⁻⁸, and for MANTRA, we used the Bayes Factor threshold of 106, plotted as the vertical and horizontal lines respectively. P: P-value from FE. BF: Bayes factor from MANTRA.
Extended Data Fig. 4
Extended Data Fig. 4. IBD gene network.
IBD gene network was created using the STRING functional protein association networks and clustered using Community Clustering Glay (Methods). For clusters with more than two genes or with new IBD genes, top three significantly enriched pathways were shown if false-discovery rate (FDR) < 0.05. New: nearest genes to the index variants in new IBD loci or new genes in Table 2 (boldfaced); Known: nearest genes to the index variants in known IBD loci; Index: nearest genes to the index variants in IBD loci except for those in Table 2; Tier: genes in Table 2.
Extended Data Fig. 5
Extended Data Fig. 5. Comparative genetic architecture within EAS.
a, SNP-based heritability in the liability scale with the prevalence in its respective population or the European population. b, Genetic correlation (rg). In a and b, the sample sizes used to derive SHA1, KOR1 and JPN1 h2 and their rg were 8,831, 6,038 and 2,624 for CD, and 8,679, 5,988 and 2,803 for UC, respectively. Results are plotted as mean value ± 95% confidence interval (error bar).
Extended Data Fig. 6
Extended Data Fig. 6. Quantile-Quantile plots for the heterogeneity test within EAS.
a, b, CD. c, d, UC. e, f, IBD. a, c, e, Genome-wide variants including the MHC locus. b, d, f, Genome-wide variants excluding the MHC locus. Cochran’s Q-test, two-sided, was used for the heterogeneity test. The dots indicate variants. Shaded area indicates the 95% confidence interval under the null distribution.
Extended Data Fig. 7
Extended Data Fig. 7. Enrichment of squared genetic correlation stratified across genomic annotations.
No significant enrichment or depletion (deviation from 1) was observed after Bonferroni corrections. Results are plotted as mean value ± 95% confidence interval before multiple testing corrections (error bar).
Extended Data Fig. 8
Extended Data Fig. 8. Variance explained for IBD associations across EUR and EAS.
We included all loci from Supplementary Table 8. For loci with fine-mapping analyses performed, we used the conditional OR (using COJO, Methods) for variants with the highest PIP in each credible set to account for multiple independent associations. We took fine-mapping results from ref 12 for EUR and from this study for EAS. For loci with no fine-mapping results, we used the index variant (variant with the most significant P value) as the proxy for the loci. We only plotted associations that have variance explained greater than 0.3% in either EAS or EUR. Different MAF is defined as Fst > 0.01, and different OR is defined as heterogeneity test P value < 0.05 after Bonferroni correction. Because the heterogeneity test was corrected using a higher multiple testing burden, the significance for a handful of loci, e.g., RNF186, can be different from Figure 3c. Nearest genes to the associations were used as labels for associations when the text space is available.
Extended Data Fig. 9
Extended Data Fig. 9. Difference between variance explained for CD and UC across EUR and EAS.
Index variants from Supplementary Table 8 were plotted. Difference between variance explained was calculated as variance explained of CD - variance explained of UC.
Extended Data Fig. 10
Extended Data Fig. 10. Polygenic risk prediction on Chinese, Korean and Japanese subjects.
a, Leave-one-country-out strategy was performed to test the performance of PRS on SHA1 (Chinese), KOR1 (Korean), and JPN1 (Japanese) subjects, respectively. The prediction accuracy was measured as R2 on the liability scale using the population prevalence (Methods). For the testing cohort, we randomly split subjects into validation and testing 100 times (Methods). All other EAS cohorts were used as discovery. Results are plotted as mean value ± 95% confidence interval of R2 across the 100 replicates (error bar). b, Effective sample size of training datasets, calculated as 4/(1/ncase+1/ncontrol).
Figure 1 |
Figure 1 |. Overview of the study design.
a, Data and analyses in this study. b, Post-QC sample size from each ancestry. #ICH1 was genotyped on ImmunoChip, a non-GWAS custom array (Methods). *ICH1 includes individuals recruited from Hong Kong SAR, China, Korea, and Japan.
Figure 2 |
Figure 2 |. IBD genetic associations.
Each layer of the plot represents results from a GWAS analysis, with results from the same ancestry grouped by the color. Within each ancestry, UC, CD, and IBD are ordered from the inner to the outer layer. Genome-wide significant associations (P < 5 × 10⁻⁸) were plotted as short lines. Known indicates previously reported IBD loci,,,–. New indicates new IBD loci from the meta-analysis (MANTRA and FE) and/or the EAS analysis.
Figure 3 |
Figure 3 |. Comparative genetic architecture across EAS and EUR.
a, SNP-based heritability (h2) on the liability scale. As the population prevalence in EAS can be underestimated for under diagnosis in certain regions in Asia, we calculated the h2 also assuming the prevalence in EUR as the upper bound of the estimate. b, Genetic correlation (rg) between EAS and EUR for CD and UC, respectively. In a and b, the sample sizes used to derive EAS and EUR h2 and EAS-EUR rg were 17,493 and 40,266 for CD, and 17,470 and 45,975 for UC, respectively. Only NFE samples were used in the EUR analysis. c, Per allele genetic effect (OR) for IBD putative causal variants in EAS (from this study) and EUR (from ref. ). OR is from conditional analysis if there are multiple genetic associations in the locus (Methods). OR was aligned such that the minor allele in EUR was the tested allele. The sample size used to derive OR in EAS and EUR were 22,828 and 40,266 for CD, and 22,318 and 45,975 for UC, respectively. Only NFE samples were used in the EUR analysis. Cochrane’s Q test (two-sided) was used for testing heterogeneity. Variants are colored according to their heterogeneity P-values, which are reported in Supplementary Table 12. P, Bonferroni corrected P-value threshold for coloring. We used the number of putative causal variants tested for the correction such that (P < 0.05 / 25 for CD and P < 0.05 / 16 for UC). Results are plotted as mean value ± 95% confidence interval (error bar).
Figure 4 |
Figure 4 |. Polygenic risk prediction on the Chinese samples.
a, Prediction accuracy was measured as R2 on the liability scale using the population prevalence in China as an approximation for Asia. We randomly split SHA1 subjects into discovery, validation and testing 100 times (Methods). All other EAS samples were used as discovery. Results are plotted as mean value ± 95% confidence interval of R2 across the 100 replicates (error bar). b, Effective sample size of training datasets, calculated as 4 / (1 / ncase + 1 / ncontrol).

References

    1. Inflammatory bowel disease. in Fast Facts About GI and Liver Diseases for Nurses (Springer Publishing Company, 2016).
    1. GBD 2017 Inflammatory Bowel Disease Collaborators. The global, regional, and national burden of inflammatory bowel disease in 195 countries and territories, 1990-2017: a systematic analysis for the Global Burden of Disease Study 2017. Lancet Gastroenterol. Hepatol 5, 17–30 (2020). - PMC - PubMed
    1. M’Koma AE Inflammatory bowel disease: an expanding global health problem. Clin. Med. Insights Gastroenterol 6, 33–47 (2013). - PMC - PubMed
    1. de Lange KM et al. Genome-wide association study implicates immune activation of multiple integrin genes in inflammatory bowel disease. Nat. Genet 49, 256–261 (2017). - PMC - PubMed
    1. Jostins L et al. Host-microbe interactions have shaped the genetic architecture of inflammatory bowel disease. Nature 491, 119–124 (2012). - PMC - PubMed

METHODS-ONLY REFERENCES

    1. Magro F et al. European Crohn’s and Colitis Organisation [ECCO]. Third European evidence-based consensus on diagnosis and management of ulcerative colitis. Part 1: definitions, diagnosis, extra-intestinal manifestations, pregnancy, cancer surveillance, surgery, and ileo-anal pouch disorders. J. Crohns. Colitis 11, 649–670 (2017). - PubMed
    1. Gomollón F et al. 3rd European Evidence-based Consensus on the Diagnosis and Management of Crohn’s Disease 2016: Part 1: Diagnosis and Medical Management. J. Crohns. Colitis 11, 3–25 (2017). - PubMed
    1. Sturm A et al. ECCO-ESGAR Guideline for Diagnostic Assessment in IBD Part 2: IBD scores and general principles and technical aspects. J. Crohns. Colitis 13, 273–284 (2019). - PubMed
    1. Maaser C et al. ECCO-ESGAR Guideline for Diagnostic Assessment in IBD Part 1: Initial diagnosis, monitoring of known IBD, detection of complications. J. Crohns. Colitis 13, 144–164 (2019). - PubMed
    1. Kakuta Y et al. NUDT15 codon 139 is the best pharmacogenetic marker for predicting thiopurine-induced severe adverse events in Japanese patients with inflammatory bowel disease: a multicenter study. J. Gastroenterol 53, 1065–1078 (2018). - PMC - PubMed

Publication types

MeSH terms

Substances