. 2023 Nov;29(11):3239-3258.
doi: 10.1111/cns.14256. Epub 2023 May 8.

LIPUS-SCs-Exo promotes peripheral nerve regeneration in cavernous nerve crush injury-induced ED rats via PI3K/Akt/FoxO signaling pathway

Affiliations

LIPUS-SCs-Exo promotes peripheral nerve regeneration in cavernous nerve crush injury-induced ED rats via PI3K/Akt/FoxO signaling pathway

Kun Ye et al. CNS Neurosci Ther. 2023 Nov.

Abstract

Objective: Clinical treatment of erectile dysfunction (ED) caused by cavernous nerve (CN) injury during pelvic surgery is difficult. Low-intensity pulsed ultrasound (LIPUS) can be a potential strategy for neurogenic ED (NED). However, whether Schwann cells (SCs) can respond to LIPUS stimulation signals is unclear. This study aims to elucidate the signal transmission between SCs paracrine exosome (Exo) and neurons stimulated by LIPUS, as well as to analyze the role and potential mechanisms of exosomes in CN repair after injury.

Methods: The major pelvic ganglion (MPG) neurons and MPG/CN explants were stimulated with LIPUS of different energy intensities to explore the appropriate LIPUS energy intensity. The exosomes were isolated and purified from LIPUS-stimulated SCs (LIPUS-SCs-Exo) and non-stimulated SCs (SCs-Exo). The effects of LIPUS-SCs-Exo on neurite outgrowth, erectile function, and cavernous penis histology were identified in bilateral cavernous nerve crush injury (BCNI)-induced ED rats.

Results: LIPUS-SCs-Exo group can enhance the axon elongation of MPG/CN and MPG neurons compared to SCs-Exo group in vitro. Then, the LIPUS-SCs-Exo group showed a stronger ability to promote the injured CN regeneration and SCs proliferation compared to the SCs-Exo group in vivo. Furthermore, the LIPUS-SCs-Exo group increased the Max intracavernous pressure (ICP)/mean arterial pressure (MAP), lumen to parenchyma and smooth muscle to collagen ratios compared to the SCs-Exo group in vivo. Additionally, high-throughput sequencing combined with bioinformatics analysis revealed the differential expression of 1689 miRNAs between the SCs-Exo group and the LIPUS-SCs-Exo group. After LIPUS-SCs-Exo treatment, the phosphorylated levels of Phosphatidylinositol 3-kinase (PI3K), protein kinase B (Akt) and forkhead box O (FoxO) in MPG neurons increased significantly compared to negative control (NC) and SCs-Exo groups.

Conclusion: Our study revealed that LIPUS stimulation could regulate the gene of MPG neurons by changing miRNAs derived from SCs-Exo, then activating the PI3K-Akt-FoxO signal pathway to enhance nerve regeneration and restore erectile function. This study had important theoretical and practical significance for improving the NED treatment.

Keywords: Schwann cells; erectile dysfunction; exosomes; low-intensity pulsed ultrasound; nerve regeneration.


Conflict of interest statement

The authors declare no conflict of interest.

Figures
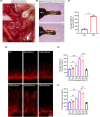
FIGURE 1
FIGURE 1
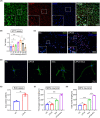
The effect of LIPUS at different energy intensities on the axonal growth of MPG/CN explants (A) Representative images of MPG and CN anatomy. (B) New neurites grew at the CN terminals as the culture time increased. Quantification of the average length of new axons is shown in panel (C). Data presented as mean ± SD with three replicates. ***p < 0.001.(D) Representative images of axonal growth length of MPG/CN explants stimulated by LIPUS with different energy intensities. New axons were stained for β3‐tubulin(red). (Scale bar = 100 μm.) Quantification of the average length and the longest length of new axons are shown in panel (E) and panel (F). Data presented as mean ± SD with three replicates. Ns, no significant difference; *p < 0.05; **p < 0.01; ***p < 0.001. CN, cavernous nerve; LIPUS, low‐intensity pulsed ultrasound; MPG, major pelvic ganglion; NC, negative control.
FIGURE 2
FIGURE 2
The effect of LIPUS on the SCs viability and proliferation. (A) Characterization of primary SCs from CN is shown by immunofluorescent staining for S100β (green), p75NTR (red), DAPI (blue) and Merge file. (Scale bar = 100 μm.) (B) The viability of SCs stimulated by LIPUS with different energy intensities for 72 h was evaluated by MTT assay. The data were presented as mean ± SD. n = 3; Ns, no significant difference; *p < 0.05; ***p < 0.001. (C) SCs proliferation was assessed by EdU assay. (Scale bar = 100 μm.) (D) MPG neurons were assessed by immunofluorescent staining for β3‐tubulin (green) and DAPI (blue). (Scale bar = 50 μm.) Quantification of Edu positive cells is shown in panel (E). Data presented as mean ± SD with three replicates. **p < 0.01. Quantification of the longest neurite length and total neurite length of MPG neurons is shown in panel (F) and panel (G). Data presented as mean ± SD with three replicates. Ns, no significant difference; **p < 0.01; ***p < 0.001. CN, cavernous nerve; LIPUS, low‐intensity pulsed ultrasound; MPG, major pelvic ganglion; NC, negative control; SCs, Schwann cells.
FIGURE 3
FIGURE 3
The effect of LIPUS‐SCs‐Exo on the neurite outgrowth in vitro. (A) TEM analysis of isolated exosomes. (Scale bar = 200 nm.) (B) The size of exosomes was detected by NTA. (C) Western blot analysis showing exosome markers Alix, HSP70, TSG101 and CD63. Panel (D) showed that PKH26(red)‐labeled exosomes were detected in cytoplasm and neurite of MPG neurons, and not in the negative control group. MPG neurons were immunofluorescent stained cytoskeletal staining by phalloidin (green) and DAPI (blue). (Scale bar = 10 μm.) (E) The effect of different concentrations of LIPUS‐SCs‐Exo(E1‐E5) on axonal growth in MPG/CN explants. Quantification of the average length and the longest length of new axons is shown in panel (F) and panel (G). Data presented as mean ± SD with three replicates. Ns, no significant difference; **p < 0.01; ***p < 0.001. Axonal elongation of MPG/CN explants(H) and MPG neurons(K) after 3 days in PBS, SCs‐Exo, LIPUS‐SCs‐Exo, LIPUS‐SCs‐Exo pre‐treated with H2O. Quantification of neurites is shown in panel (I), panel (J), panel (L) and panel (M). Data presented as mean ± SD with three replicates. Ns, no significant difference; **p < 0.01; ***p < 0.001. CN, cavernous nerve; Exo, exosomes; LIPUS, low‐intensity pulsed ultrasound; MPG, major pelvic ganglion; NC, negative control; NTA, Nanoparticle Tracking Analysis; SCs, Schwann cells; TEM, Transmission Electron Microscope.
FIGURE 4
FIGURE 4
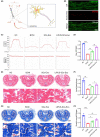
The effect of LIPUS‐SCs‐Exo on erectile function and histological alteration in vivo. (A) Schematic diagram of exosomes treatment. Panel (B) showed that PKH26(red)‐labeled LIPUS‐SCs‐Exo was detected in CN. CN were immunofluorescent stained cytoskeletal staining by phalloidin (green). (Scale bar = 100 μm.) (C) Representative images of hemodynamic changes after CN stimulation. (D) The maximum ICP/MAP ratio of each group was measured to evaluate erectile function. The data were presented as mean ± SD. n = 3; **p < 0.01; ***p < 0.001. (E) The morphological characteristics of corpus cavernosum were observed by H&E staining. (F) Semi‐quantitative analysis of the ratio of cavernous lumen to parenchyma. The data were presented as mean ± SD. n = 3; *p < 0.05; **p < 0.01. (G) Corpus cavernosum was evaluated by Masson's trichrome staining, smooth muscle (red), collagen (blue). (H) Semi‐quantitative analysis of the ratio of smooth muscle to collagen. The data were presented as mean ± SD. n = 3; *p < 0.05; **p < 0.01; ***p < 0.001. CN, cavernous nerve; Exo, exosomes; H&E, hematoxylin and eosin; ICP, intracavernous pressure; LIPUS, low‐intensity pulsed ultrasound; MAP, mean arterial pressure; SCs, Schwann cells.
FIGURE 5
FIGURE 5
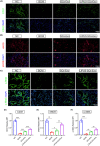
The effect of LIPUS‐SCs‐Exo on endothelial and smooth muscle cell contents and function. Endothelium cell content and function in corpus cavernosum were evaluated by immunofluorescent staining for CD31 (green) (A) and eNOS (red) (B), respectively. The nucleus was stained with DAPI (blue). (Scale bar = 100 μm.) Semi‐quantitative image analysis of the relative MFI of CD31 (D) and eNOS (E). Data presented as mean ± SD with three replicates. *p < 0.05; **p < 0.01; ***p < 0.001. (C) Smooth muscle cell content in corpus cavernosum were evaluated by immunofluorescent staining for α‐SMA (green), DAPI (blue) and Merge file. (Scale bar = 100 μm.) (F) Semi‐quantitative image analysis of the relative MFI of α‐SMA. Data presented as mean ± SD with three replicates. **p < 0.01; ***p < 0.001. Exo, exosomes; LIPUS, low‐intensity pulsed ultrasound; MFI, mean fluorescence intensity; SCs, Schwann cells.
FIGURE 6
FIGURE 6
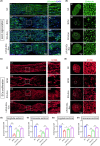
The effect of LIPUS‐SCs‐Exo on axon regeneration and SCs proliferation in vivo. Representative immunostaining images of CN longitude sections were stained for β3‐tubulin (green) (A) and S100β (red) (C) in each group, respectively. The nucleus was stained with DAPI (blue). (Scale bar = 100 μm.) Representative immunostaining images of CN transverse sections of the distal regenerated nerve segments were stained for β3‐tubulin (green) (B) and S100β (red) (D) in each group, respectively. The nucleus was stained with DAPI (blue). (Scale bar = 100 μm.) Semi‐quantitative image analysis of the β3‐tubulin relative MFI of CN longitude sections (E) and transverse sections (F). Data presented as mean ± SD with three replicates. *p < 0.05; **p < 0.01; ***p < 0.001. Semi‐quantitative image analysis of the S100β relative MFI of CN longitude sections (G) and transverse sections (H). Data presented as mean ± SD with three replicates. *p < 0.05; **p < 0.01; ***p < 0.001. Exo: exosomes; LIPUS, low‐intensity pulsed ultrasound; MFI, mean fluorescence intensity; SCs, Schwann cells.
FIGURE 7
FIGURE 7
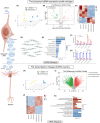
The exosomal miRNA expression profile changes and the transcriptome changes of MPG neurons after SCs‐Exo and LIPUS‐SCs‐Exo treatment. (A) PCA 3D mapping plot of miRNA expression profile in each group. (B) Volcano plot showed the differentially expressed miRNAs between LIPUS‐SCs‐Exo and SCs‐Exo. A gradient of green to red indicated the down‐expressed to up‐regulation of the miRNAs. (C) Heatmap diagram showed the expression level of differentially expressed miRNAs between LIPUS‐SCs‐Exo and SCs‐Exo. A gradient of blue to red indicated the down‐expressed to up‐regulation of the miRNAs. (D) Target gene network of differentially expressed miRNAs between LIPUS‐SCs‐Exo and SCs‐Exo. (E) KEGG pathway enrichment of target genes of the predicted differentially expressed miRNAs. Confirmation of the up‐expressed miRNA (F) and down‐expressed miRNAs (G) in LIPUS‐SCs‐Exo compared to SCs‐Exo by qRT‐PCR. The data were presented as mean ± SD. n = 3; ***p < 0.001. (H) PCA 3D mapping plot of DEGs profile in each group. (I) Volcano plot showed the DEGs in each group. A gradient of green to red indicated the down‐expressed to up‐regulation of the genes. (J) Heatmap diagram showed the expression level of DEGs in each group. A gradient of blue to red indicated the down‐expressed to up‐regulation of the genes. (K) KEGG pathway analysis of DEGs. DEGs, differentially expressed genes; Exo, exosomes; KEGG, Kyoto Encyclopedia of Genes and Genomes; LIPUS, low‐intensity pulsed ultrasound; PCA, principal component analysis; SCs, Schwann cells.
FIGURE 8
FIGURE 8
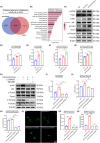
LIPUS‐SCs‐Exo promotes nerve regeneration via PI3K/Akt/FoxO signaling pathway. (A)Venn diagram showed 1689 key genes between predictive target genes of differential miRNA and the DEGs after LIPUS‐SCs‐Exo and SCs‐Exo treatment. (B) KEGG pathway enrichment of the key genes. (C) MPG neurons were treated with SCs‐Exo or LIPUS‐SCs‐Exo for 72 h. Western Blotting was used to detect the expression of PI3K, p‐PI3K, Akt, p‐Akt, FoxO1, p‐FoxO1, FoxO3a and p‐FoxO3a in MPG neurons. The quantization of protein expression levels. The ratios of p‐PI3K/PI3K (D), p‐Akt/Akt (E), p‐FoxO1/FoxO1 (F), p‐FoxO3a/FoxO3a (G) of every group were calculated with β‐actin as an internal reference. Data presented as mean ± SD with three replicates. *p < 0.05. MPG neurons were pretreated with LY294002 (10 μM) and MK2206 (1 μM) for 3 h, and then treated with LIPUS‐SCs‐Exo for 72 h. (H) The activation of PI3K‐Akt was examined with Western Blotting. (I–K) The quantization of PI3K‐Akt‐FoxO protein expression levels. Data presented as mean ± SD with three replicates. *p < 0.05; **p < 0.01; ***p < 0.001. (L) Inhibition of PI3K‐Akt signal in MPG neurons partially counteracted the enhancement of growth by LIPUS‐SCs‐Exo. Quantification of neurites is shown in panel (M) and panel (N). Data presented as mean ± SD with three replicates. Ns, no significant difference; n = 3; ***p < 0.001. DEGs, differentially expressed genes; Exo, exosomes; KEGG, Kyoto Encyclopedia of Genes and Genomes; LIPUS, low‐intensity pulsed ultrasound; MPG, major pelvic ganglion; SCs, Schwann cells.

References

    1. Shamloul R, Ghanem H. Erectile dysfunction. Lancet (London, England). 2013;381(9861):153‐165. - PubMed
    1. Yafi FA, Jenkins L, Albersen M, et al. Erectile dysfunction. Nat Rev Dis Primers. 2016;2:16003. - PMC - PubMed
    1. Corona G, Rastrelli G, Morgentaler A, Sforza A, Mannucci E, Maggi M. Meta‐analysis of results of testosterone therapy on sexual function based on international index of erectile function scores. Eur Urol. 2017;72(6):1000‐1011. - PubMed
    1. Kendirci M, Tanriverdi O, Trost L, Hellstrom WJG. Management of sildenafil treatment failures. Curr Opin Urol. 2006;16(6):449‐459. - PubMed
    1. Del Popolo G, Cito G, Gemma L, et al. Neurogenic sexual dysfunction treatment: a systematic review. Eur Urol Focus. 2020;6(5):868‐876. - PubMed

Publication types

MeSH terms

Substances