. 2023 Nov 1;78(5):1525-1541.
doi: 10.1097/HEP.0000000000000438. Epub 2023 May 10.

Single-cell RNA sequencing of liver fine-needle aspirates captures immune diversity in the blood and liver in chronic hepatitis B patients

Affiliations

Single-cell RNA sequencing of liver fine-needle aspirates captures immune diversity in the blood and liver in chronic hepatitis B patients

Alex S Genshaft et al. Hepatology. .

Abstract

Background and aims: HBV infection is restricted to the liver, where it drives exhaustion of virus-specific T and B cells and pathogenesis through dysregulation of intrahepatic immunity. Our understanding of liver-specific events related to viral control and liver damage has relied almost solely on animal models, and we lack useable peripheral biomarkers to quantify intrahepatic immune activation beyond cytokine measurement. Our objective was to overcome the practical obstacles of liver sampling using fine-needle aspiration and develop an optimized workflow to comprehensively compare the blood and liver compartments within patients with chronic hepatitis B using single-cell RNA sequencing.

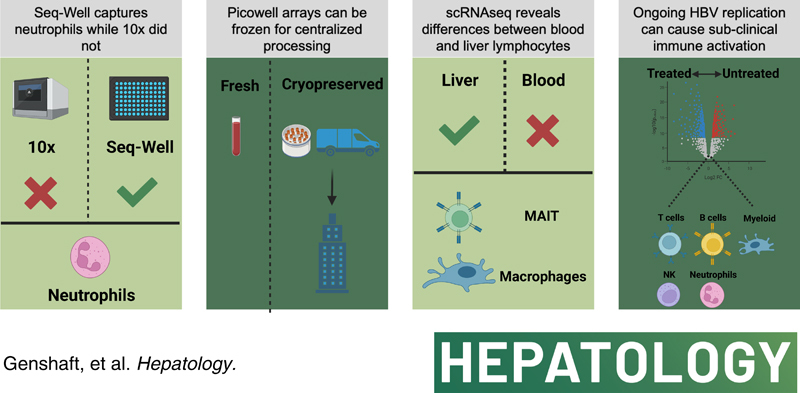
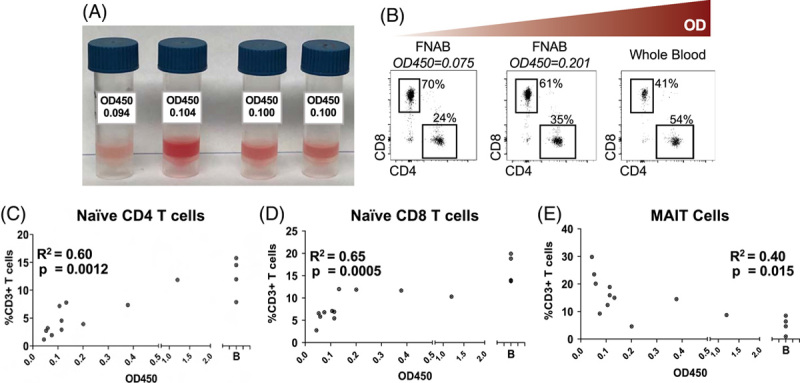
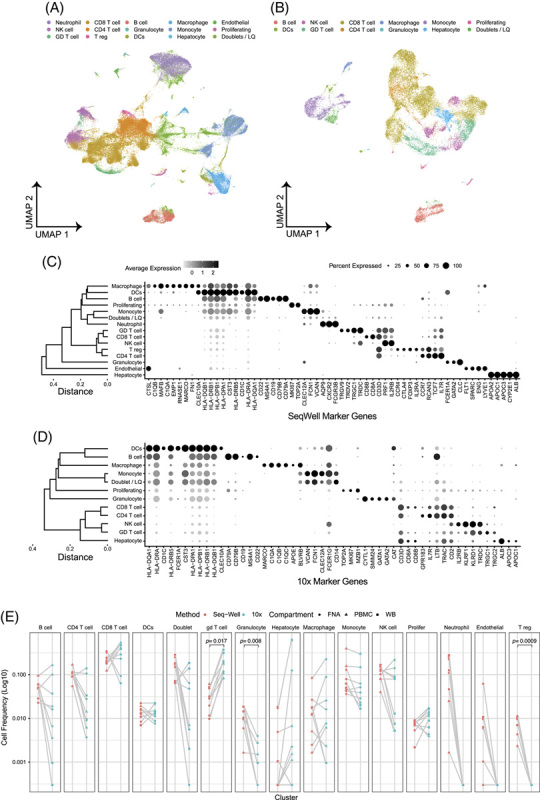
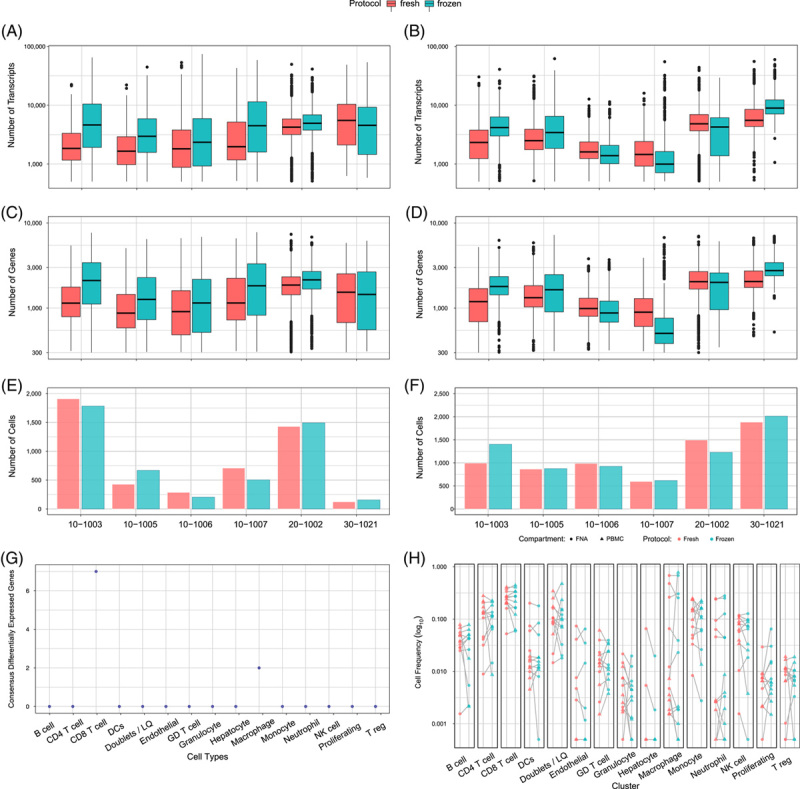
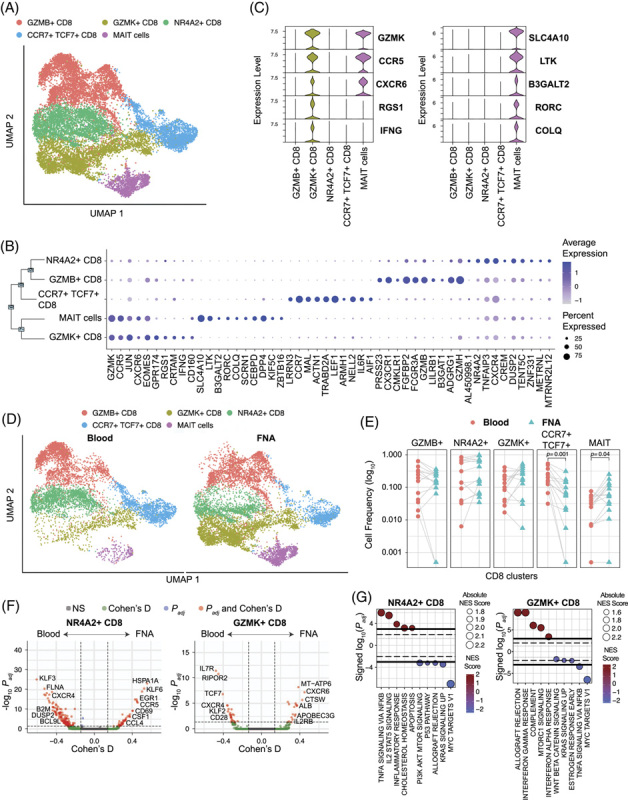
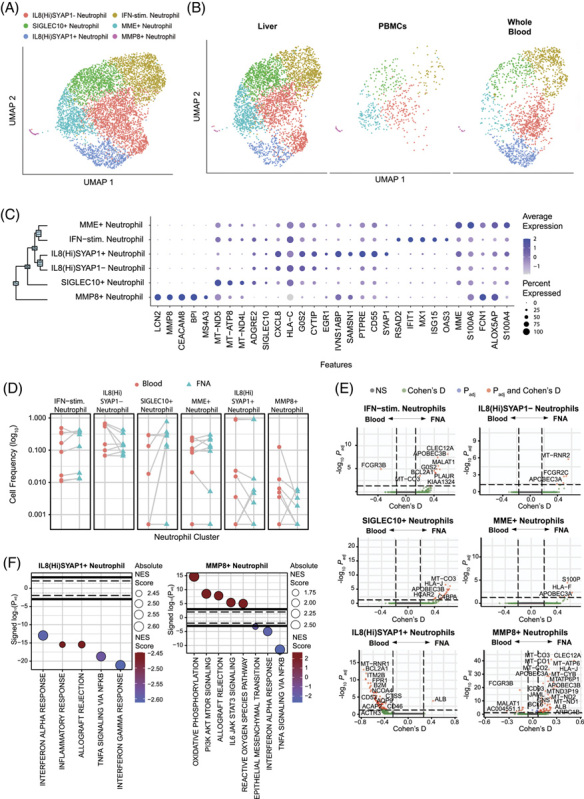
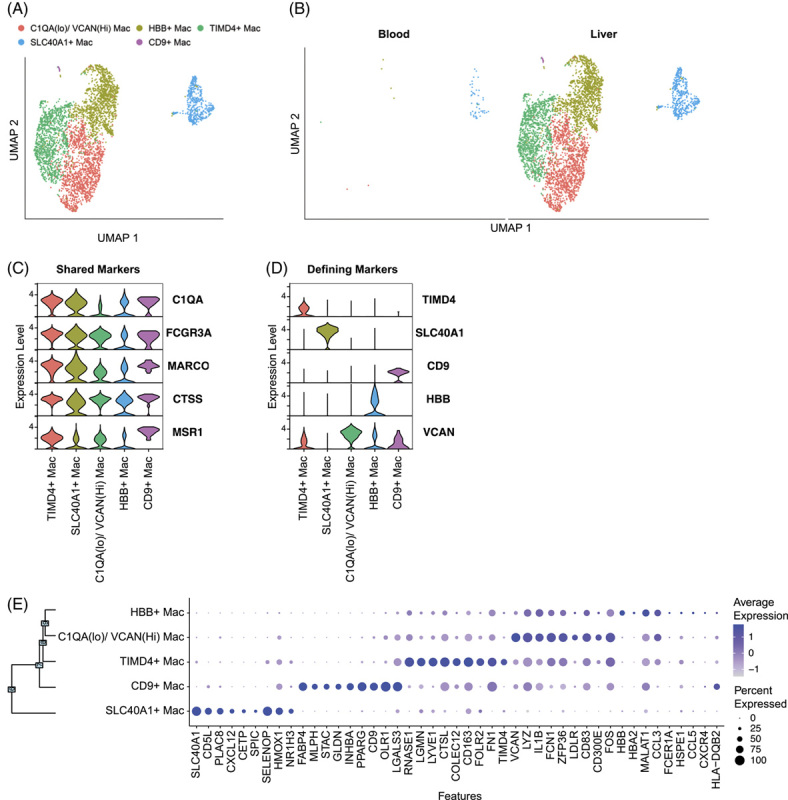
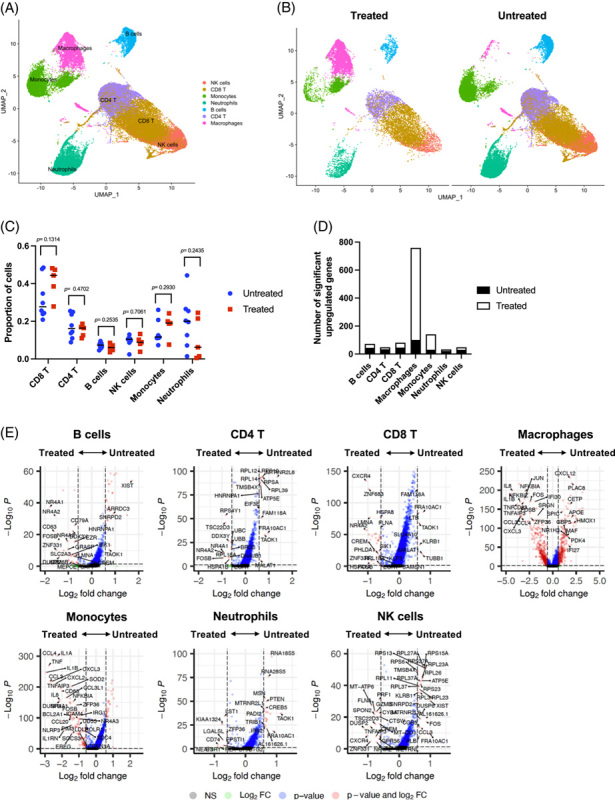
Approach and results: We developed a workflow that enabled multi-site international studies and centralized single-cell RNA sequencing. Blood and liver fine-needle aspirations were collected, and cellular and molecular captures were compared between the Seq-Well S 3 picowell-based and the 10× Chromium reverse-emulsion droplet-based single-cell RNA sequencing technologies. Both technologies captured the cellular diversity of the liver, but Seq-Well S 3 effectively captured neutrophils, which were absent in the 10× dataset. CD8 T cells and neutrophils displayed distinct transcriptional profiles between blood and liver. In addition, liver fine-needle aspirations captured a heterogeneous liver macrophage population. Comparison between untreated patients with chronic hepatitis B and patients treated with nucleoside analogs showed that myeloid cells were highly sensitive to environmental changes while lymphocytes displayed minimal differences.

Conclusions: The ability to electively sample and intensively profile the immune landscape of the liver, and generate high-resolution data, will enable multi-site clinical studies to identify biomarkers for intrahepatic immune activity in HBV and beyond.


Conflict of interest statement

Nádia Conceição-Neto is employed by Janssen Pharmaceutica NV. Jordan Feld consults and received grants from Arbtus, AbbVie, Gilead, GlaxoSmithKline, Janssen, Roche, and Vir. He received grants from Eiger and Enanta. Raymond T. Chung received grants from AbbVie, Boehringer, Bristol Myers Squibb, Gilead, GlaxoSmithKline, Janssen, Merck, and Roche. Robert J. de Knegt consults, is on the speakers' bureau, and received grants from AbbVie, Echosens, and Gilead. He consults and received grants from Bristol Myers Squibb, Janssen, Medtronic, and Roche. He consults for Merck and Norgine. He received grants from GlaxoSmithKline and Phillips. Henry L.A. Janssen consults and received grants from Arbutus, Gilead, GlaxoSmithKline, Janssen, Merck, Roche, and Vir. He consults for Aligos, Antios, Arena, Eiger, Enyo, Regulus, VBI Vaccines, and Viroclinics. He received grants from AbbVie, Arbutus, and Bristol Myers Squibb. Jeroen Aerssens owns stock in Johnson & Johnson. He is employed by Janssen. Jacques Bollekens consults, owns stock in, and holds intellectual property rights with Johnson & Johnson. He is employed by Janssen. Nir Hacohen consults and owns stock in DangerBio. He owns stock in Biontech. Georg M. Lauer consults for and received grants from Janssen. He consults for Altimmune, GlaxoSmithKline, and Roche. Andre Boonstra received grants from Fujirebio, Gilead, GlaxoSmithKline, and Janssen. Alex K. Shalek consults, advises, and owns stock in Cellarity, Dahlia Biosciences, Honeycomb Biotechnologies, Ochre Bio, Repertoire Immune Medicines, Relation Therapeutics, and Santa Ana Bio. He consults and received grants from Janssen. He consults for FL82, Hovione, Merck, Roche, and Third Rock Ventures. He received grants from Leo Pharma A/S and Novo Nordisk. Adam J. Gehring consults and received grants from BlueJay Therapeutics, Gilead, GlaxoSmithKline, Janssen Pharmaceuticals, Roche, and Vir Biotech. He consults for Assembly, Finich Therapeutics, SQ BioTech, Viron Therapeutics, and VBI Vaccines. The remaining authors have no conflicts to report.

Figures

None
Graphical abstract
FIGURE 1
FIGURE 1
Quantification of RBC contamination of liver FNAs. (A) Images showing variable RBC contents of individual FNA passes. (B) CD4:CD8 ratio in FNA passes from a single patient with increasing OD450 values. Frequency of (C) naïve CD4 T cells (D) naïve CD8 T cells and (E) MAIT cells compared to OD450 values of each FNA pass. Analysis was done using the Pearson pairwise correlation. Abbreviation: MAIT, mucosal-associated invariant T.
FIGURE 2
FIGURE 2
10 × 3′v2 versus Seq-Well S3 comparison. UMAPs of all data from (A) Seq-Well and (B) ×10. Dot plot of cell type marker genes for (C) Seq-Well and (D) ×10. (E) Cell type frequencies compared across matched samples (gray lines) for Seq-Well S3 (red) and ×10 (blue). Paired t test was used to test for statistical significance. Samples from FNA, PBMC, and WB are circles, triangles, and squares, respectively, n = 4 patients run in parallel, and 8 samples account for blood and liver from each patient. Abbreviation: FNA, fine-needle aspirates.
FIGURE 3
FIGURE 3
Data comparison of freshly processed versus frozen arrays. (A) Number of transcripts/cells, (B) Number of genes/cells, and (C) number of cells captured in liver FNAs from 6 different patients. (D) number of transcripts/cells (E) number of genes/cell and (F) number of cells captured in peripheral blood from 6 different patients. Paired t test was used to test for statistical significance in panels (a–). (G) Number of differentially expressed genes in matched cell types between freshly processed and frozen arrays. Differential expression was performed on a participant and compartment basis. Genes were considered consensus differentially expressed if they were significant at adjusted p values < 0.05 and the absolute value of Cohen’s d > 0.2 across at least 6 of the 12 individual and compartment combinations. (H) Comparison of cell type capture across matched samples (gray lines) for fresh (pink) and frozen (blue) arrays. Samples from FNA and PBMC are circles and triangles, respectively. Paired t test was used to test for statistical significance (n = 6 patients, blood and liver). Abbreviation: PBMC, peripheral blood mononuclear cells.
FIGURE 4
FIGURE 4
CD8 T cell composition in liver versus blood. (A) scRNA-seq UMAP for CD8 T cells colored by cluster IDs. (B) Dot plot showing the top 10 marker genes for each cluster ID. (C) Violin plot showing the top 5 marker genes for GZMK + CD8 and MAIT cells. Significance was determined using the Wilcoxon Rank sum test. (D) scRNA-seq UMAP colored by cluster and split based on tissue of origin, that is, liver and blood. (E) Comparison of cell frequencies between blood and liver within sample (connected through grey lines) for each CD8 cluster. Significance was determined using Wilcoxon Signed-Rank test with the Bonferroni correction (adjusted p-value < 0.05). (F) Volcano plots depicting differences in gene expression between blood and FNA in NR4A2 + and GZMK + CD8 T cells. The R-package MAST was used to obtain hurdle p values that were Bonferroni corrected for multiple hypothesis testing. Positive Cohen’s d value suggests higher expression in liver. Cohen’s d cutoff calculated as mean + ×2 SD of Cohen’s d values of all genes. (G) Hallmark gene sets enriched by NR4A2 + and GZMK + CD8 T cells. The normalized enrichment score was calculated based on a vector of gene-level signed statistic and false discovery rate was adjusted based on the Benjamini-Hochberg (BH) Correction. x-axis represents the signed log10 of adjusted p-value for the gene sets, and the positive value suggests enrichment in the liver. Abbreviation: MAIT, mucosal-associated invariant T.
FIGURE 5
FIGURE 5
Neutrophil identification. (A) scRNA-seq UMAP for neutrophils colored by cluster IDs. (B) UMAP dimensionality reduction of neutrophils by compartment. (C) Dot plot showing top 5 marker genes for each cluster determined using the Wilcoxon Rank sum test with the Bonferroni correction (adjusted p-value < 0.05). (D) Differential frequency of neutrophil clusters between compartments. Participants with 0 cells within a cell population were excluded. Significant differences between compartments were assessed using the Wilcoxon Signed-Rank test with the Bonferroni correction (adjusted p-value < 0.05). (E) Volcano plots depicting differences in gene expression between compartments within each cluster. The R-package MAST was used to obtain hurdle p values that were Bonferroni corrected for multiple hypothesis testing. Positive Cohen’s d value suggests higher expression in the liver. (F) Hallmark gene sets enriched for clusters with differentially expressed genes between compartments. The normalized enrichment score was calculated based on a vector of gene-level signed statistic and the false discovery rate was adjusted based on the Benjamini-Hochberg (BH) correction. x-axis represents signed log10 of adjusted p-value for the gene sets, and positive value suggests enrichment in liver.
FIGURE 6
FIGURE 6
Macrophage identification in liver FNAs. (A) scRNA-seq UMAP for macrophages colored by cluster IDs. (B) UMAP dimensionality reduction of macrophages by compartment. Violin plots of (C) macrophage-shared genes and (D) unique cluster-defining genes. (E) Dot plot showing the top 9 cluster-defining genes. Significance was determined using the Wilcoxon Rank-Sum test with the Bonferroni correction (adjusted p-value < 0.05). Abbreviations: Mac, macrophages; scRNA-seq, single cell RNA sequencing.
FIGURE 7
FIGURE 7
Myeloid cells are the most sensitive to treatment in patients with CHB. (A) scRNA-seq UMAP of cells from treated and untreated patients with CHB. (B) UMAP dimensionality reduction of intrahepatic cells by treatment. (C) Comparison of cell proportions between treatment. Dots represent individual donors; bars indicate mean values. The unpaired t test was used to test for statistical significance. (D) Number of differentially upregulated genes in each intrahepatic cluster between treated and untreated patients with CHB. (E) Volcano plots showing genes that are differentially expressed between treated and untreated patients with CHB. Significance was determined using the Wilcoxon rank sum test with Bonferroni correction (adjusted p-value < 0.05). Thresholds: p < 0.05 and log2 fold change ≥ 1.5. Genes upregulated in untreated patients are shown to the right-hand side of each plot. Genes upregulated in treated patients are shown on the left-hand side of each plot. Abbreviation: scRNA-seq, single cell RNA sequencing.

References

    1. Marcellin P, Kutala BK. Liver diseases: a major, neglected global public health problem requiring urgent actions and large-scale screening. Liver Int. 2018;38(Suppl 1):2–6. - PubMed
    1. Polaris Observatory C. Global prevalence, treatment, and prevention of hepatitis B virus infection in 2016: a modelling study. Lancet Gastroenterol Hepatol. 2018;3:383–403. - PubMed
    1. Yuen MF, Chen DS, Dusheiko GM, Janssen HLA, Lau DTY, Locarnini SA, et al. Hepatitis B virus infection. Nat Rev Dis Primers. 2018;4:18035. - PubMed
    1. Lok AS, Zoulim F, Dusheiko G, Ghany MG. Hepatitis B cure: From discovery to regulatory approval. Hepatology. 2017;66:1296–1313. - PMC - PubMed
    1. Revill PA, Chisari FV, Block JM, Dandri M, Gehring AJ, Guo H, et al. A global scientific strategy to cure hepatitis B. Lancet Gastroenterol Hepatol. 2019;4:545–558. - PMC - PubMed