

Energetic landscape of polycystin channel gating
- PMID: 37158562
- PMCID: PMC10328073
- DOI: 10.15252/embr.202356783
Energetic landscape of polycystin channel gating
Abstract
Members of the polycystin family (PKD2 and PKD2L1) of transient receptor potential (TRP) channels conduct Ca2+ and depolarizing monovalent cations. Variants in PKD2 cause autosomal dominant polycystic kidney disease (ADPKD) in humans, whereas loss of PKD2L1 expression causes seizure susceptibility in mice. Understanding structural and functional regulation of these channels will provide the basis for interpreting their molecular dysregulation in disease states. However, the complete structures of polycystins are unresolved, as are the conformational changes regulating their conductive states. To provide a holistic understanding of the polycystin gating cycle, we use computational prediction tools to model missing PKD2L1 structural motifs and evaluate more than 150 mutations in an unbiased mutagenic functional screen of the entire pore module. Our results provide an energetic landscape of the polycystin pore, which enumerates gating sensitive sites and interactions required for opening, inactivation, and subsequent desensitization. These findings identify the external pore helices and specific cross-domain interactions as critical structural regulators controlling the polycystin ion channel conductive and nonconductive states.
Keywords: TRP channels; calcium; polycystic kidney disease; polycystins; structural biology.
© 2023 The Authors. Published under the terms of the CC BY NC ND 4.0 license.
Conflict of interest statement
The authors declare that they have no conflict of interest.
Figures

- A
Perturbation in the free energy of PKD2L1 opening (ΔG°) and difference in closure rates (Δτclose) inducted by substitutions within the pore module. ΔG° is estimated from the results shown in Fig EV2 and tabulated in Appendix Table S1. Error bars = SD as estimated by the propagation of error equation, as described in statistics subsection. Mutation sites that produced nonfunctional channels are listed in Appendix Table S2. The number of cells voltage clamped (N) for each mutation is indicated within the parenthesis of Fig EV2.
- B
Heat maps of ΔG° (top) and Δτclose (bottom) applied on the AlphaFold PKD2L1 channel model. Expanded views of the pore module are shown in the inset, and complete channel structure is shown in the outset. Side chains of high‐impact sites are represented as spheres of graduated color intensity, and those from low impact sites are omitted.

- A
Heat maps of ΔG° applied on to a single PKD2L1 subunit model by AlphaFold.
- B
Exemplar tail currents from mutant channels where the energetics of opening are disassociated with the rate of channel closure—mutations that cause slower closure (+Δτclose) while also increasing the free energy opening (+ΔG°).
- C, D
Mutations sites that alter Δτclose mapped onto a single PKD2L1 subunit modeled using AlphaFold. Insets, expanded views of the intra‐subunit salt‐bridge formed between the S6 and S4‐S5 linker, and the intersubunit hydrogen bond network formed between finger 2 of the TOP domain and PH2 of the adjacent subunits pore module.

- A
General topology and amino acid alignment of the pore module of PKD2 and PKD2L1. Location of the conserved inner and outer gates and other sites of interest are boxed in yellow with italicized residue numbers. The sequence alignment was generated Clustal‐omega and rendered in JalView using the default color scheme relating amino acid character.
- B
A scheme representing the proposed PKD2L1 channel states and transition kinetics. Blue box indicates kinetics likely controlled by structural conformations within the pore module. Gray box indicates voltage‐dependent kinetics controlled by the conformations within the voltage senor domain.
- C
Voltage protocol (Top) and example tail currents (Itail, Bottom) used to determine the voltage dependence of opening.
- D
Perturbation in the free energy of opening (ΔG°). Resulting normalized tail current relationships from WT and mutant channels fit to a Boltzmann equation, as described in methods. Example data sets mutants that positively (+ΔG°) and negatively change (−ΔG°) the free energy of opening are shown in red and blue, respectively. Error bars are equal to SD. The number of cells (N) voltage‐clamped for WT and the example mutant channels was 11 and 7, respectively.
- E
Change in the rate of channel closure (Δτclose) as estimated by the difference in the rate of decay of the tail current (τclose) measured from a mutant channel from those measured from WT channels. Example tail currents fit to a single exponential recorded from cells expressing mutant channels that positively and negatively change the rate of channel closure.


- A
Structural alignment of the PKD2L1 structures determined by cryo‐EM (PDB: 5Z1W, 6DU8; Hulse et al, ; Su et al, 2018b) and the AlphaFold closed‐state model. Transmembrane view of single PKD2L1 subunits (left) and homotetrameric quaternary assemblies (right). Note the absence of the C‐terminal S6 pore helix and the S4‐S5 linker in the cryo‐EM structures.
- B
Analysis of the PKD2L1 pore diameters using the HOLE program.
- C
PKD2L1 AlphaFold closed‐state models (left), and Rosetta open‐state models (right) meeting selection criteria.
- D
Structural overlay of the top scoring models from AlphaFold closed‐state model (colored in gray) and Rosetta open‐state models (colored in violet) meeting selection criteria.
- E, F
Views of the inner and outer gates of the AlphaFold closed (gray) and Rosetta open (violet) states. Locations of the inner gate (F556, L557, A558) and outer gate residues (D523) are indicated.

- A
AlphaFold and Rosetta modeled PKD2L1 in the open and closed states. Transmembrane view of the channel and an expanded view of the pore domain with the outer and inner gates indicated.
- B
Left, intracellular structural view of the inner gate with an expanded view of the homotypic intersubunit hydrogen bond formed between the carboxamide side chains of N561. Right, the linear decreasing relationship between ΔG° and Δhydropathy induced by mutations to D523.
- C
Left, extracellular structural view of the outer gate with an expanded view of the intersubunit hydrogen bond formed between the backbone carbonyl of F524 and the side chain carboxylate of D523. Right, linear increasing relationship between ΔG° and change in hydropathy (ΔHydropathy) induced by mutations. Side chains of mutations, which are incapable of forming hydrogen bonds, are indicated in blue.
- D
Comparing voltage‐dependent opening based on normalized tail currents measured from WT, single, and double mutant channels. Top, single and double mutant channels including mutations to the outer and inner gate. Middle and bottom, control groups comparing tail currents from non‐gate S4‐S5 linker mutations (D476A and G479A) and those from the outer and inner gates.
- E
The coupling energy (ΔΔG°) resulting from the mutant cycle analysis resulting from the data shown in (D).
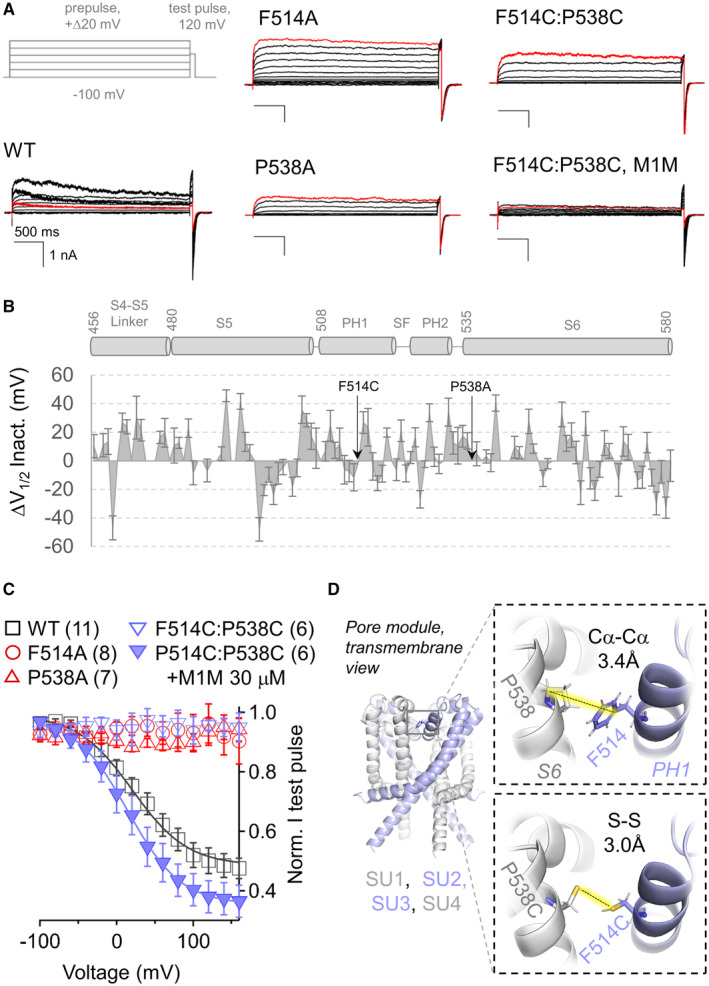
- A
Gray, voltage protocol used to measure voltage‐dependent inactivation. Black trace, PKD2L1 currents were activated by a 4 s “prepulse” depolarization in 20 mV increments. A “test pulse” to 120 mV was used to assess the mount of available (non‐inactivated) current after the prepulse. Red trace, currents activated by the prepulse depolarization to 160 mV. Note, the decrease of the test pulse tail currents (arrow) for the WT and F514C:P538C treated with M2M, whereas the other channel currents remain stable (non‐inactivating).
- B
Summary of the change in voltage‐dependent inactivation (ΔV1/2 Inact.) of pore mutant channels. ΔV1/2 Inact., as measured in Fig EV2 and tabulated in Appendix Table S1, are plotted relative to the pore module topology of the channel.
- C
Voltage‐dependent inactivation of test pulse tail currents recorded from WT, single and double mutant channels.
- D
Outset, transmembrane view of the AlphaFold PKD2L1 structural model identifying the non‐inactivating mutant sites at the intersubunit interface of the pore turret. Inset, expanded views showing Cα‐Cα distance between F538 (S6) and F514 (PH1) and modeled sulfur–sulfur distances when cysteine substitutions are made (F514C:P538C).


- A
Schematics of the calcium condition (Black) and voltage protocol (Gray) that induces Ca2+‐dependent desensitization.
- B
Exemplar WT PKD2L1 current (Top) activated by a train of depolarizations to the 0, 3, and 7 min time points. The average time course of PKD2L1 tail current desensitization over 8 min (N = 6 cells, gray = SD).
- C
Exemplar whole cell currents (Top) at the 0, 3, and 7 min time points. Current records (Bottom) from cells expressing the F514C:P538C and treated with extracellular 100 μM 1,2‐methanediyl bismethanethiosulfonate (M2M).
- D
Box (SEM) and whisker (SD) plots comparing tail currents normalized to their initial amplitude at 3 min (Left) and 7‐min time points (Right). N = 6 cells per group. Results from each individual cells are indicated by gray open circles, and the average for the channel is indicated by a horizontal line. P‐value results from a one‐way ANOVA statistical analysis are shown above the plots. Dashed lines the level normalcy, no change in Itail relative to time point zero.
References
-
- Basora N, Nomura H, Berger UV, Stayner C, Guo L, Shen X, Zhou J (2002) Tissue and cellular localization of a novel polycystic kidney disease‐like gene product, polycystin‐L. J Am Soc Nephrol 13: 293–301 - PubMed
-
- Bers DM, Patton CW, Nuccitelli R (2010) A practical guide to the preparation of Ca(2+) buffers. Methods Cell Biol 99: 1–26 - PubMed
Publication types
MeSH terms
Substances
Grants and funding
LinkOut - more resources
Full Text Sources
Miscellaneous
