. 2023 May 9:12:e85307.
doi: 10.7554/eLife.85307.

Tryptophan metabolism determines outcome in tuberculous meningitis: a targeted metabolomic analysis

Affiliations

Tryptophan metabolism determines outcome in tuberculous meningitis: a targeted metabolomic analysis

Edwin Ardiansyah et al. Elife. .

Abstract

Background: Cellular metabolism is critical for the host immune function against pathogens, and metabolomic analysis may help understand the characteristic immunopathology of tuberculosis. We performed targeted metabolomic analyses in a large cohort of patients with tuberculous meningitis (TBM), the most severe manifestation of tuberculosis, focusing on tryptophan metabolism.

Methods: We studied 1069 Indonesian and Vietnamese adults with TBM (26.6% HIV-positive), 54 non-infectious controls, 50 with bacterial meningitis, and 60 with cryptococcal meningitis. Tryptophan and downstream metabolites were measured in cerebrospinal fluid (CSF) and plasma using targeted liquid chromatography-mass spectrometry. Individual metabolite levels were associated with survival, clinical parameters, CSF bacterial load and 92 CSF inflammatory proteins.

Results: CSF tryptophan was associated with 60-day mortality from TBM (hazard ratio [HR] = 1.16, 95% confidence interval [CI] = 1.10-1.24, for each doubling in CSF tryptophan) both in HIV-negative and -positive patients. CSF tryptophan concentrations did not correlate with CSF bacterial load nor CSF inflammation but were negatively correlated with CSF interferon-gamma concentrations. Unlike tryptophan, CSF concentrations of an intercorrelating cluster of downstream kynurenine metabolites did not predict mortality. These CSF kynurenine metabolites did however correlate with CSF inflammation and markers of blood-CSF leakage, and plasma kynurenine predicted death (HR 1.54, 95% CI = 1.22-1.93). These findings were mostly specific for TBM, although high CSF tryptophan was also associated with mortality from cryptococcal meningitis.

Conclusions: TBM patients with a high baseline CSF tryptophan or high systemic (plasma) kynurenine are at increased risk of death. These findings may reveal new targets for host-directed therapy.

Funding: This study was supported by National Institutes of Health (R01AI145781) and the Wellcome Trust (110179/Z/15/Z and 206724/Z/17/Z).

Keywords: central nervous system; cerebrospinal fluid; human; immunology; inflammation; metabolomics; plasma; survival; tuberculous meningitis.


Conflict of interest statement

EA, JA, LN, SD, DV, HH, KB, BA, RE, TT, JD, DH, TC, NB, AG, RR, VK, RH, DI, KM, VK, CC, Rv, GT, Av, NT No competing interests declared, MN has received consulting fees from Scientific Board TTxD and is a scientific founder of TTxD, Lemba and BioTRIP. The author has no other competing interests to declare

Figures

Figure 1.
Figure 1.. Tryptophan metabolism pathway.
Tryptophan is metabolized mainly through the kynurenine pathway through indoleamine 2,3-dioxygenase 1 (IDO1), generating kynurenine and its downstream metabolites (blue box). IDO1 is partly stimulated by M. tuberculosis-induced interferon gamma (IFN-γ) production by T helper 1cells.
Figure 2.
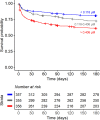
Figure 2.. Six-month survival curve of tuberculous meningitis (TBM) patients.
Patients were stratified by cerebrospinal fluid (CSF) tryptophan concentrations tertiles.
Figure 2—figure supplement 1.
Figure 2—figure supplement 1.. Cerebrospinal fluid (CSF) parameters of tuberculous meningitis (TBM) patients in Indonesia and Vietnam.
Distributions of leukocytes, polymorphonuclear cells, mononuclear cells, protein, and the ratio of CSF/blood glucose in Indonesian (purple) and Vietnamese (yellow) patients are depicted by violin plots.
Figure 2—figure supplement 2.
Figure 2—figure supplement 2.. Stability of metabolites over-time.
The concentrations of tryptophan metabolites (in log2 scale) were measured in cerebrospinal fluid (CSF) samples from Indonesian (purple) and Vietnamese (yellow) tuberculous meningitis (TBM) patients were recruited between 2007 and 2018.
Figure 2—figure supplement 3.
Figure 2—figure supplement 3.. Six-month survival curve of tuberculous meningitis (TBM) patients stratified by HIV status.
Patients were stratified by tertiles based on cerebrospinal fluid (CSF) tryptophan concentrations (red = high tryptophan, gray = intermediate tryptophan, blue = low tryptophan).
Figure 2—figure supplement 4.
Figure 2—figure supplement 4.. In-hospital mortality for 17 HIV-positive patients with cryptococcal meningitis.
Holm-adjusted Wilcoxon rank-sum test p-values are presented :*p<0.05, **p<0.01.
Figure 2—figure supplement 5.
Figure 2—figure supplement 5.. Cerebrospinal fluid (CSF) tryptophan distributions according to mycobacterial load.
(A) Comparing CSF culture-negative versus -positive patients and (B) among patients with a positive CSF Xpert, in culture-positive and -negative tuberculous meningitis (TBM) patients, CSF tryptophan was associated with CSF Xpert Ct-values from a low (high Ct-value) to low (low Ct-value) load.
Figure 3.
Figure 3.. Cerebrospinal fluid and plasma metabolites concentrations in tuberculous meningitis (TBM) and all controls for the tryptophan metabolites associated with outcome: tryptophan and kynurenine.
(A) Relative concentrations based on peak ion intensity and (B) absolute concentrations in μM. Boxplots are shown with Holm-adjusted Wilcoxon rank-sum test p-values are presented: (*p<0.05, **p<0.01, ***p<0.001, ****p<0.0001). No measurements were excluded for these graphs. Note: plasma measurements were available for a subset of 300 TBM patients and all controls.
Figure 3—figure supplement 1.
Figure 3—figure supplement 1.. Boxplots of cerebrospinal fluid (CSF) and plasma metabolites concentrations in tuberculous meningitis (TBM) and controls.
Relative concentrations based on peak ion intensities are shown. CSF and plasma concentrations are not directly comparable. Boxplots are shown with Holm-adjusted Wilcoxon rank-sum test p-values are presented: *p<0.05, **p<0.01, ***p<0.001, ****p<0.0001. Note: plasma measurements were available for a subset of 300 TBM patients and all controls.
Figure 4.
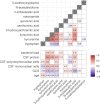
Figure 4.. Correlation between tryptophan metabolites and with clinical and cerebrospinal fluid (CSF) parameters.
Significant Spearman’s correlation coefficients are presented in the correlation matrix, while the ones with not significant correlations were blank. Red indicates positive correlations, and blue indicates negative ones. The color gradient shows the strength of the associations.
Figure 4—figure supplement 1.
Figure 4—figure supplement 1.. Associations between cerebrospinal fluid (CSF)/plasma metabolite ratios (y-axis) and CSF protein levels (as a proxy of CSF barrier leakage, x-axis).
Of note, 71 patients had undetectable plasma levels of 3-indolacetic acid and were removed from this graph.
Figure 5.
Figure 5.. Associations of cerebrospinal fluid (CSF) tryptophan with IFN-γ (A) and with TNF-α (B) in 176 Indonesian (left) and 304 (Vietnamese) tuberculous meningitis (TBM) patients.
The boxplots on the left of each plot show the association of metabolites with cytokines below the detection limit. Abbreviations: IFN-γ: interferon gamma, TNF-α: tumor necrosis factor alpha, LOD: lower limit of detection.
Figure 5—figure supplement 1.
Figure 5—figure supplement 1.. Correlation between cerebrospinal fluid (CSF) tryptophan metabolites and inflammatory markers measured with O-link in Indonesian (A) and Vietnamese (B) tuberculous meningitis patients.
Inflammatory markers were clustered based on their correlation coefficients using hierarchical clustering. Red indicates positive correlation, and blue indicated negative correlation.

Update of

References

    1. Adu-Gyamfi CG, Savulescu D, George JA, Suchard MS. Indoleamine 2, 3-dioxygenase-mediated tryptophan catabolism: a leading StAR or supporting act in the tuberculosis and HIV pas-de-deux? Frontiers in Cellular and Infection Microbiology. 2019;9:372. doi: 10.3389/fcimb.2019.00372. - DOI - PMC - PubMed
    1. Assarsson E, Lundberg M, Holmquist G, Björkesten J, Thorsen SB, Ekman D, Eriksson A, Rennel Dickens E, Ohlsson S, Edfeldt G, Andersson A-C, Lindstedt P, Stenvang J, Gullberg M, Fredriksson S. Homogenous 96-plex pea immunoassay exhibiting high sensitivity, specificity, and excellent scalability. PLOS ONE. 2014;9:e95192. doi: 10.1371/journal.pone.0095192. - DOI - PMC - PubMed
    1. Boado RJ, Li JY, Nagaya M, Zhang C, Pardridge WM. Selective expression of the large neutral amino acid transporter at the blood–brain barrier. PNAS. 1999;96:12079–12084. doi: 10.1073/pnas.96.21.12079. - DOI - PMC - PubMed
    1. Coutinho LG, Christen S, Bellac CL, Fontes FL, de Souza FRS, Grandgirard D, Leib SL, Agnez-Lima LF. The kynurenine pathway is involved in bacterial meningitis. Journal of Neuroinflammation. 2014;11:169. doi: 10.1186/s12974-014-0169-4. - DOI - PMC - PubMed
    1. Dodd PJ, Osman M, Cresswell FV, Stadelman AM, Lan NH, Thuong NTT, Muzyamba M, Glaser L, Dlamini SS, Seddon JA, Balcells ME. The global burden of tuberculous meningitis in adults: a modelling study. PLOS Global Public Health. 2021;1:e0000069. doi: 10.1371/journal.pgph.0000069. - DOI - PMC - PubMed

Publication types