. 2023 May 9:2023:baad027.
doi: 10.1093/database/baad027.

SyntenyViewer: a comparative genomics-driven translational research tool

Affiliations

SyntenyViewer: a comparative genomics-driven translational research tool

Raphael Flores et al. Database (Oxford). .

Abstract

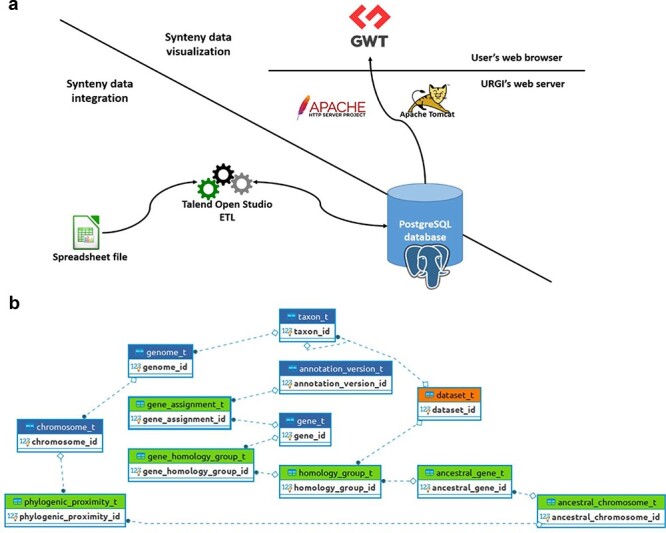
SyntenyViewer is a public web-based tool relying on a relational database available at https://urgi.versailles.inrae.fr/synteny delivering comparative genomics data and associated reservoir of conserved genes between angiosperm species for both fundamental (evolutionary studies) and applied (translational research) applications. SyntenyViewer is made available for (i) providing comparative genomics data for seven major botanical families of flowering plants, (ii) delivering a robust catalog of 103 465 conserved genes between 44 species and inferred ancestral genomes, (iii) allowing us to investigate the evolutionary fate of ancestral genes and genomic regions in modern species through duplications, inversions, deletions, fusions, fissions and translocations, (iv) use as a tool to conduct translational research of key trait-related genes from model species to crops and (v) offering to host any comparative genomics data following simplified procedures and formats Database URL https://urgi.versailles.inrae.fr/synteny.


Conflict of interest statement

The authors declare no conflict of interest.

Figures

Figure 1.
Figure 1.
Procedure for reconstructing ancestral karyotypes. Ancestral genomes are inferred from (see the Materials and methods section) conserved genes (Step 1), orthologous relationships (Step 2), SBs (Step 3) and CARs (Step 4), to provide the best scenario explaining the transition between ancestral and modern genomes. Types of tabular files derived from each step are illustrated at the right to help readers to properly follow the procedure (described in and adapted from (20)).
Figure 2.
Figure 2.
SyntenyViewer data processing and database description. (a) Illustration of theSyntenyViewer architecture including the data integration step into a PostgreSQL instance, and the data visualization based on GWT powered by Apache Tomcat and Apache HTTP server. (b) Illustration of the SyntenyViewer database model with for each box a table named with its primary key term (referenced below). Tables colored in green store data in an append only fashion when a new synteny dataset is submitted, blue tables contain new data as well as data shared between different datasets, orange table stores new data as well as updated data from a previously inserted dataset (i.e. ‘dataset_t’ that handles several versions of a dataset: a new tuple is inserted for Version 2 of Dataset A, while the tuple with Version 1 is marked obsolete). Some technical relationships between tables have been hidden for clarity. The database is structured below.
Figure 3.
Figure 3.
SyntenyViewer, a comparative genomics-driven translational research tool. (a) ‘Plant genome evolution from reconstructed ancestors’. The present-day angiosperm species (bottom) are represented along the evolutionary tree of the Angiosperms from founder ancestors (AGK, AEK, AcuK, ASK, ARK, ABK and ALK) of major botanical families with the time scale shown on the left (in million years). The polyploidization events that have shaped the structure of modern plant genomes during their evolution from inferred ancestors are indicated by red dots (duplication) and blue dots (triplication). (b) ‘SyntenyViewer screen capture’. SyntenyViewer tool with the setting parameters (search by gene name and ancestral or modern chromosomes) illustrated at the left and the derived comparative genomics data visualization, as detailed in the text, at the right (here for cereals). Genes are illustrated as colored boxes for each species (in lines), so that conserved genes are linked with colored lines between species. (c) ‘Synteny-based translational research of FZP gene in grasses’. FZP gene characterization in grasses with orthologs from SyntenyViewer (Panel b) and functional validation in wheat and Brachypodium (in mutants compared to wild type) in deriving similar SS phenotypes (adapted from (47)).

References

    1. Bell C.D., Soltis D.E. and Soltis P.S. (2005) The age of the angiosperms: a molecular timescale without a clock. Evolution, 59, 1245–1258. - PubMed
    1. Magallon S. (2010) Using fossils to break long branches in molecular dating: a comparison of relaxed clocks applied to the origin of angiosperms. Syst. Biol., 59, 384–399. - PubMed
    1. Barba-Montoya J., Dos Reis M., Schneider H.. et al. (2018) Constraining uncertainty in the timescale of angiosperm evolution and the veracity of a Cretaceous Terrestrial Revolution. New Phytol., 218, 819–834. - PMC - PubMed
    1. Friis E.M., Pedersen K.R. and Crane P.R. (2006) Cretaceous angiosperm flowers: innovation and evolution in plant reproduction. Palaeogeogr Palaeoclimatol Palaeoecol, 232, 251–293.
    1. Friis E.M., Pedersen K.R. and Crane P.R. (2010) Diversity in obscurity: fossil flowers and the early history of angiosperms. Philos. Trans. R. Soc. Lond., B, Biol. Sci., 365, 369–382. - PMC - PubMed

Publication types