. 2023 Apr 24;3(4):100459.
doi: 10.1016/j.crmeth.2023.100459.

TCR sequencing and cloning methods for repertoire analysis and isolation of tumor-reactive TCRs

Affiliations

TCR sequencing and cloning methods for repertoire analysis and isolation of tumor-reactive TCRs

Raphael Genolet et al. Cell Rep Methods. .

Abstract

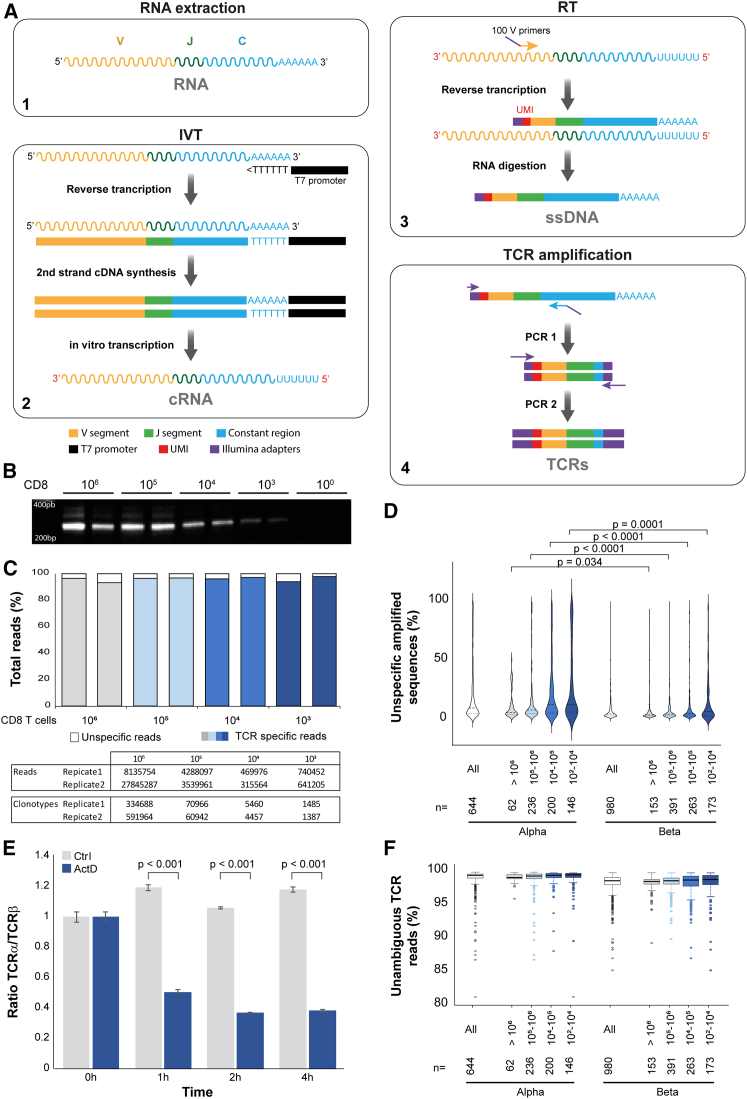
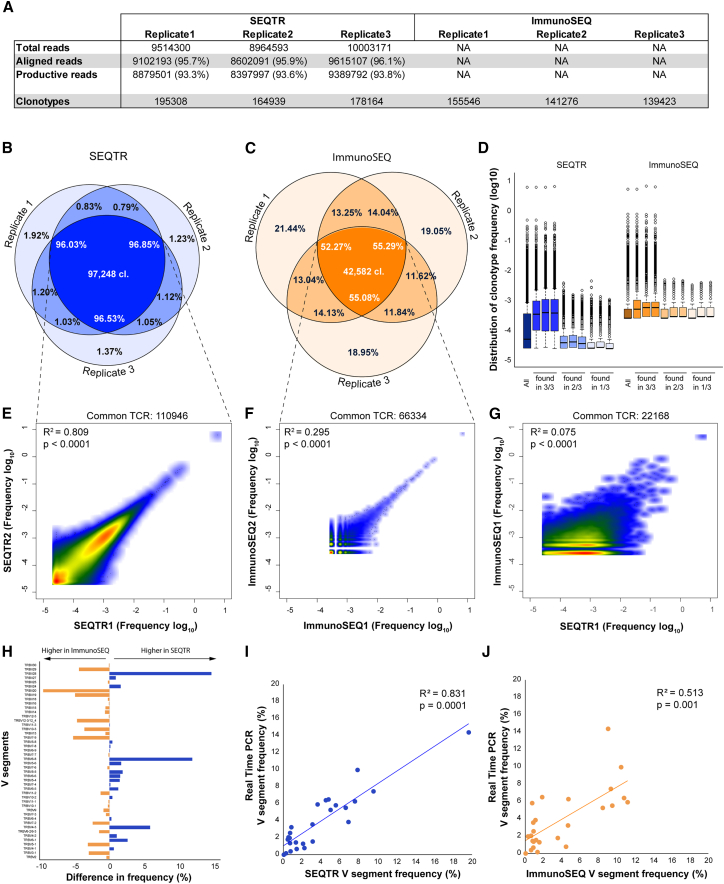
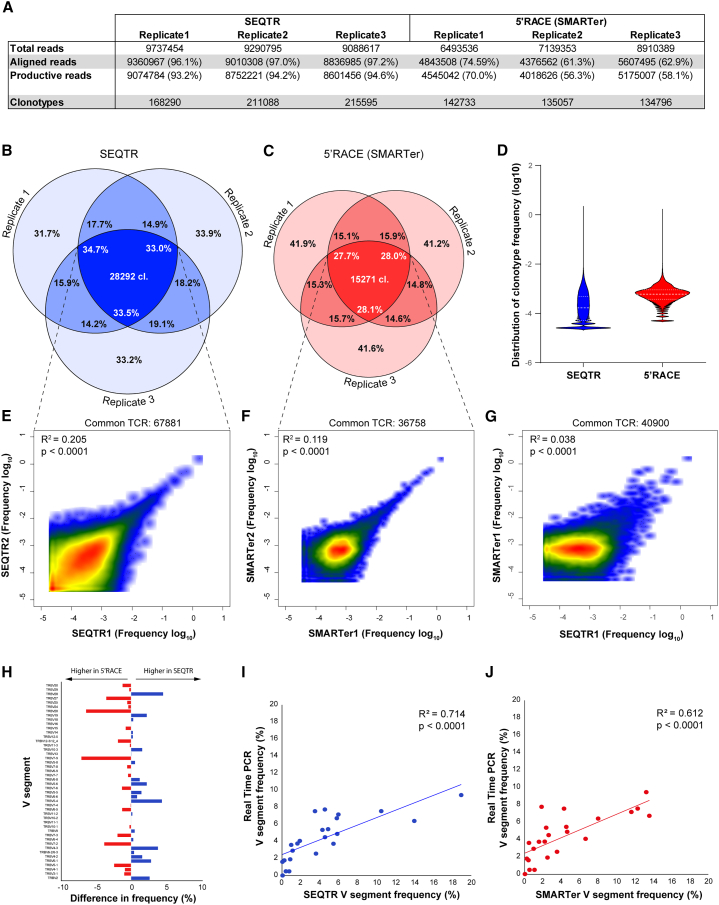
T cell receptor (TCR) technologies, including repertoire analyses and T cell engineering, are increasingly important in the clinical management of cellular immunity in cancer, transplantation, and other immune diseases. However, sensitive and reliable methods for repertoire analyses and TCR cloning are still lacking. Here, we report on SEQTR, a high-throughput approach to analyze human and mouse repertoires that is more sensitive, reproducible, and accurate as compared with commonly used assays, and thus more reliably captures the complexity of blood and tumor TCR repertoires. We also present a TCR cloning strategy to specifically amplify TCRs from T cell populations. Positioned downstream of single-cell or bulk TCR sequencing, it allows time- and cost-effective discovery, cloning, screening, and engineering of tumor-specific TCRs. Together, these methods will accelerate TCR repertoire analyses in discovery, translational, and clinical settings and permit fast TCR engineering for cellular therapies.

Keywords: T cell engineering; T cell receptor; TCR cloning; TCR repertoire; cancer; immune diversity; immune repertoire; immunotherapy; repertoire profiling.


Conflict of interest statement

The University of Lausanne and Ludwig Institute for Cancer Research have filed for patent protection on the technology described herein. R.G. is named as inventor on this patent. G.C. has received grants from Celgene, Boehringer-Ingelheim, Roche, Bristol Myers Squibb, Iovance Therapeutics, and Kite Pharma. The institution with which G.C. is affiliated has received fees for G.C.’s participation on advisory boards or for presentation at a company-sponsored symposium from Genentech, Roche, Bristol Myers Squibb, AstraZeneca, NextCure, Geneos Tx, and Sanofi/Avensis. The Center Hospitalier Universitaire Vaudois (CHUV) and the Ludwig Institute for Cancer Research have filed for patent protection on the technology related to T cell expansion. S.B., A.H., and G.C. are named as inventors on this patent. G.C. has patents in the domain of antibodies and vaccines targeting the tumor vasculature as well as technologies related to T cell engineering for T cell therapy. G.C. holds patents around antibodies and receives royalties from the University of Pennsylvania regarding technology licensed to Novartis.

Figures

None
Graphical abstract
Figure 1
Figure 1
Variability of TCR expression levels (A) Schematic description of single-cell TCR-seq analysis performed on TILs from three melanoma patients and the analysis of the number of TCR RNA molecules per cell. (B) Violin plots showing the distribution of the number of RNA molecules per cell normalized to the median for TCR α and β chains in three patients. The numbers in violin plots indicate the average mRNA molecules per cell for each patient. The number of single cells analyzed is indicated at the bottom of the graph. (C) Heatmaps showing TCR mRNA expression levels of the 20 most frequent clonotypes (y axis). Each square represents one cell from each clonotype. Color scale highlights the number of mRNA molecules per cell. For readability, only 20 cells of the clonotype are presented. The TCR expression distribution of all the cells of the clonotypes are shown in Figure S1B. (D) The average TCR expression levels (number of mRNA molecules per cell) were determined for each clonotype and plotted according to the number of cells per clonotype. Each dot shows an individual clonotype. Red lines represent median expression levels; dotted lines and gray zones represent the 2-fold variations from medians. The graph depicted here shows data of patient 1 and is representative of the three patients. (E) All clonotypes with an average expression level of TCR mRNA >2-fold relative to medians (present in the gray zone of D) were deconvoluted according to the number of cells per clonotype. (F and G) Correlations between TCR mRNA frequencies (y axis) and clonotype frequencies (number of cells/clonotype, x axis) based on single-cell data. p values and R2 were calculated using Spearman correlation after logarithmic transformation of the data. The graphs depicted here show the data of patient 1. Data from patients 2 and 3 are shown in Figures S1E and S1F.
Figure 2
Figure 2
Validation of SEQTR (A) Illustration of the different steps for TCR amplification using SEQTR. Sinusoidal lines represent RNA molecules and straight lines DNA or cDNA molecules. (B) The amplified TCRs were run on an agarose gel to visualize the bands. The amplification was performed in duplicates with decreasing amounts of starting T cells. (C) Frequencies of unspecific sequences (i.e., reads that do not align against TCR sequences) obtained after sequencing analyses of the repertoires amplified in (B). The table below summarizes the number of reads and the number of clonotypes identified in each sample. (D) Violin plot showing the percentages of unspecific sequences identified in TCR α and β repertoires displayed according to the number of cells analyzed (x axis). Numbers at the bottom indicate the samples sequenced for repertoires analysis. p values were calculated by two-tailed t tests. (E) RNA from PBMCs treated or not with actinomycin D was extracted at different time points, and TCRα/β RNA were quantified by real-time PCR. The graph shows TCRα/TCRβ RNA ratio. Each experiment was run in triplicate; the data shown are representative of the three independent experiments performed. p values were calculated by two-tailed unpaired t tests. (F) The whisker plot shows the percentage of ambiguous V/J sequences (i.e., reads where several V or J segments are possible based on the sequencing and cannot be differentiated) identified in TCRα/β repertoires. Boxplots and box limits represent medians (line) and 25%–75% confidence limit, respectively. Whiskers are calculated as Q3 ± 1.5× interquartile range (IQR). Individual dots show outliers. Data were grouped according to the amount of starting cells. Numbers at the bottom indicate the number of repertoire samples analyzed.
Figure 3
Figure 3
Reproducibility and sensitivity of SEQTR RNA from 106 PBMCs (donor1) was extracted and used to perform three technical replicates with either SEQTR or ImmunoSEQ. (A) The table summarizes the number of reads performed for each replicate, the number of aligned reads (i.e., those containing TCR sequences) and the productive reads (i.e., those where complete and unambiguous TCR was identified). The number of unique clonotypes identified is also indicated. (B and C) Venn diagrams showing frequencies of overlapping TCR repertoires (frequency of common clonotypes) for SEQTR (B) and ImmunoSEQ (C). The number indicates the number of clonotypes identified in the three replicates. (D) Distribution of clonotype frequencies calculated from the triplicates for complete repertoires (all) and for the fractions of clonotypes found in 3/3, 2/3, or 1/3 triplicates. Boxplots and box limits represent medians (line) and 25%–75% confidence limit, respectively. Whiskers are calculated as Q3 ± 1.5× IQR. Individual dots show outliers. (E and F) Density plot showing frequencies of shared clonotypes from replicates 1 and 2 of SEQTR (D) and ImmunoSEQ (E). (G) Density plot showing frequencies of clonotypes shared between SEQTR and ImmunoSEQ. p value and R2 were calculated using Spearman correlation after logarithmic transformation of the data. Only one representative comparison is shown in the figure. (H) Frequencies of the different V segments were calculated for each method. The graph shows the difference in V frequencies between SEQTR and ImmunoSEQ. (I and J) Cross-comparison between TCRβ-chain variable (TRBV) frequencies quantified by real-time PCR on the original RNA or by SEQTR (I) or ImmunoSEQ (J). V segments that could not be differentiated by real-time PCR were amplified with a common primer and corresponding sequencing frequencies pooled together. p values and R2 were calculated using Spearman correlation.
Figure 4
Figure 4
Reproducibility and sensitivity of SEQTR RNA from 3 × 106 PBMCs (donor3) was extracted and used to perform three technical replicates with either SEQTR or the 5′-RACE assay SMARTer. (A) The table summarizes the number of reads performed for each replicate, the number of aligned reads (i.e., those contained TCR sequences), and the productive reads (i.e., those where a complete and unambiguous TCR was identified). Number of unique clonotypes identified is also indicated. (B and C) Venn diagrams showing frequencies of overlapping TCR repertoires (frequency of common clonotypes) for SEQTR (B) and SMATer (C). The number indicates the number of clonotypes identified in the three replicates. (D) Violin plot showing the frequency distribution of all clonotypes identified. Only one representative replicate is represented. (E and F) Density plots showing frequencies of shared clonotypes from replicates 1 and 2 of SEQTR (E) and SMARTer (F). (G) Density plots showing frequencies of clonotypes shared between SEQTR and SMARTer. p value and R2 were calculated using Spearman correlation after logarithmic transformation of the data. Only one representative comparison is shown in the figure. (H) Frequencies of the different V segments were calculated for each method. The graph shows the difference in V frequencies between SEQTR and SMARTer. (I and J) Cross-comparison between TRBV frequencies quantified by real-time PCR on the original RNA or by SEQTR (I) or SMARTer (J). V segments that could not be differentiated by real-time PCR were amplified with a common primer and corresponding sequencing frequencies pooled together. p values and R2 were calculated using Spearman correlation.
Figure 5
Figure 5
Impact of methods on TCR metrics (A) Description of the impact of methods on TCR metrics measurement. (B and C) TCR metrics were calculated on the replicate used to benchmark SEQTR. Analysis of the richness, Shannon entropy, clonality, and CL50 calculated from technical replicate repertoires (n = 3 replicates) obtained with SEQTR or ImmunoSEQ (B) or with SEQTR and SMARTer (C). Bars show medians. p values were calculated by two-tailed unpaired t tests. (D and E) Eight PBMCs (D) and ten TILs (E) from melanoma patients were used for TCR-seq with SEQTR or our custom multiplex PCR amplification. TCR metrics were calculated, and the results obtained with the two methods are presented on estimation plots. The left part shows metrics data, and the right part shows the mean of differences between paired samples. Mean and the upper and lower 95% confidence intervals are shown on right panels. The dotted lines show means of SEQTR (blue) and of our custom multiplex assay (orange). Samples above and below the 95% confidence interval are highlighted in green and red, respectively. p values were calculated by two-tailed paired t tests. (F) Metrics calculated with SEQTR, multiplex, or single-cell approach were normalized to the SEQTR sample with lowest Shannon entropy or highest clonality. Colors illustrate sample over or below the 95% confidence interval of (D). Euclidian distance and mean of differences were calculated between single-cell and SEQTR or single-cell and multiplex.
Figure 6
Figure 6
TCR cloning (A) Illustration of the different steps to clone TCR from scTCR-seq library or bulk RNA. (B and C) V and J recombinations for both TCRα (B) and TCRβ (C) chains are shown for cytomegalovirus (CMV)-tetramer-positive T cells (FACS plot in B). V/J segments are represented according to their chromosomal location on the x and y axis, respectively. The frequency of each recombination is shown on the z axis. The color code highlights recombination frequency. (D) TCR-transduced T cells were stained with CD8 and tetramer loaded with CMV peptide (left panels) or CD8 and the mouse β constant region (right panels).
Figure 7
Figure 7
Identification of tumor-reactive TCRs from TILs (A) Description of the TCR identification process. Tumor-reactive bulk TILs (CD137+ after tumor recognition) were purified and sequenced. The most frequent TCRs were amplified from bulk RNA and tested in vitro for tumor recognition. Functional TCRs were tested for tumor control in vivo. (B) Representative example of CD137+ TILs alone or after 6 h of exposure to autologous tumor cells (patient 1). (C and D) V/J recombinations for both TCRα and TCRβ chains are shown for non-tumor-reactive (CD137) (C) and tumor-reactive (CD137+) (D) repertoires. V/J segments are represented according to their chromosomal location on the x and y axis, respectively. The frequency of each recombination is shown on the z axis. The color code highlights recombination frequency. (E) Relative magnitude of tumor reactivity of transduced PBMCs with candidate TCRα/β chains from (C) and (D) measured by IFN-γ ELISpot assay in the absence (filled columns) or presence (open columns) of anti-HLA-class-I blocking antibody. “SC” indicates TCRs (cognate α- and β-chain pairs) found within matching single-cell TCR-seq data. Mean values and standard deviation (SD) are shown. (F) Tumor control of adoptively transferred α1β1 TCR-transduced T cells against autologous patient 1-derived tumor xenografts. Mean values and SD are shown; p values were calculated by tow-tailed unpaired t tests.

References

    1. Babel N., Stervbo U., Reinke P., Volk H.D. The identity card of T cells-clinical utility of T-cell receptor repertoire analysis in transplantation. Transplantation. 2019;103:1544–1555. doi: 10.1097/TP.0000000000002776. - DOI - PubMed
    1. Li N., Yuan J., Tian W., Meng L., Liu Y. T-cell receptor repertoire analysis for the diagnosis and treatment of solid tumor: a methodology and clinical applications. Cancer Commun. 2020;40:473–483. doi: 10.1002/cac2.12074. - DOI - PMC - PubMed
    1. Jacobsen L.M., Posgai A., Seay H.R., Haller M.J., Brusko T.M. T cell receptor profiling in type 1 diabetes. Curr. Diab. Rep. 2017;17:118. doi: 10.1007/s11892-017-0946-4. - DOI - PMC - PubMed
    1. Woodsworth D.J., Castellarin M., Holt R.A. Sequence analysis of T-cell repertoires in health and disease. Genome Med. 2013;5:98. doi: 10.1186/gm502. - DOI - PMC - PubMed
    1. Arnaud M., Duchamp M., Bobisse S., Renaud P., Coukos G., Harari A. Biotechnologies to tackle the challenge of neoantigen identification. Curr. Opin. Biotechnol. 2020;65:52–59. doi: 10.1016/j.copbio.2019.12.014. - DOI - PubMed

Publication types

Substances