. 2023 Apr 24;3(4):100456.
doi: 10.1016/j.crmeth.2023.100456.

Generation of left ventricle-like cardiomyocytes with improved structural, functional, and metabolic maturity from human pluripotent stem cells

Affiliations

Generation of left ventricle-like cardiomyocytes with improved structural, functional, and metabolic maturity from human pluripotent stem cells

Nicola Dark et al. Cell Rep Methods. .

Abstract

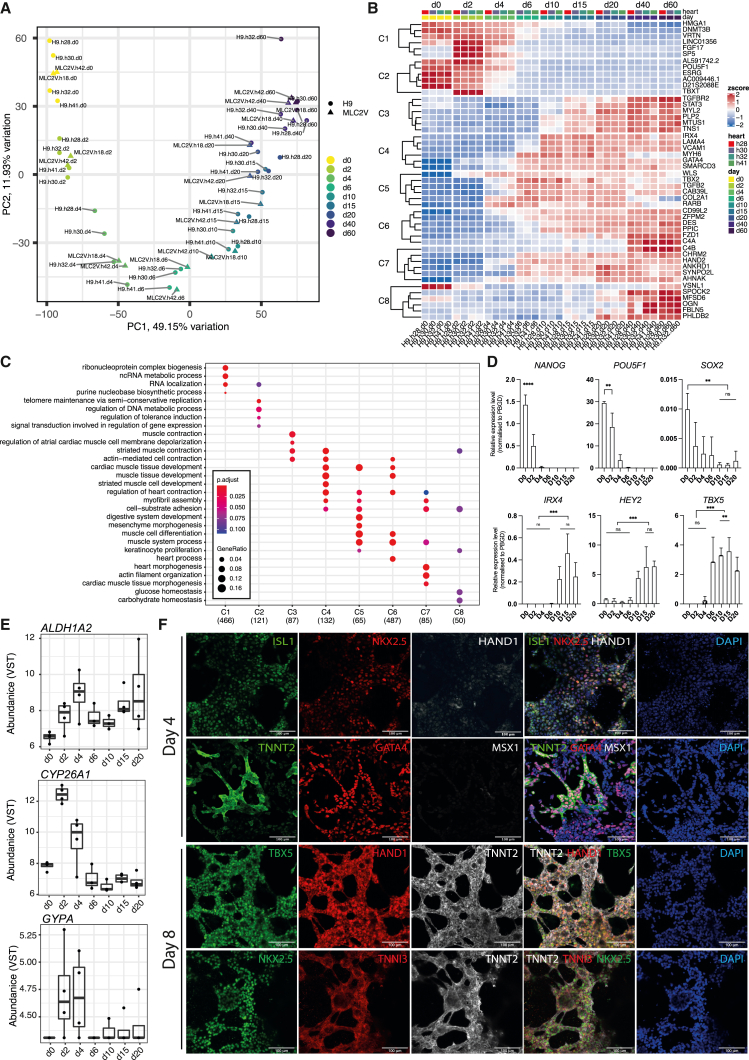
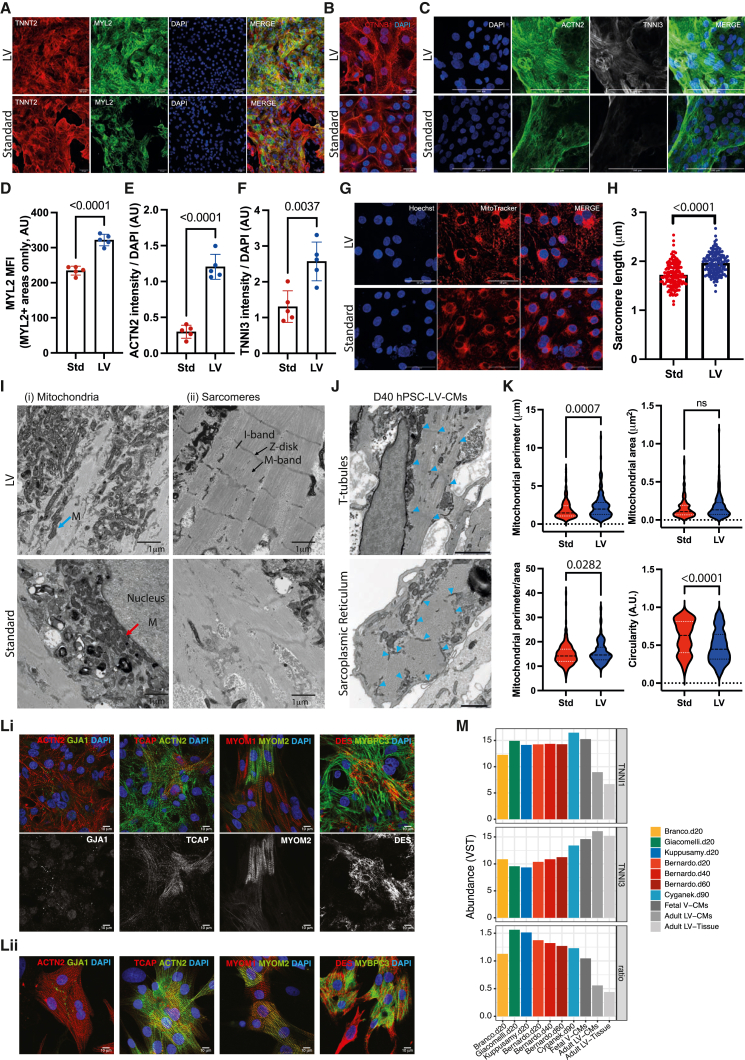
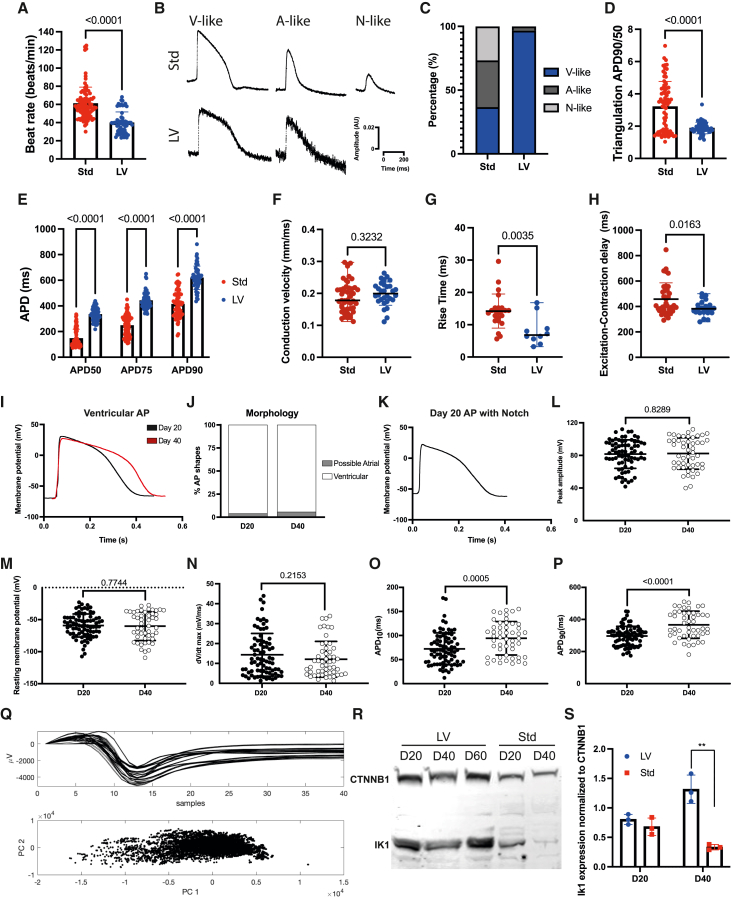
Decreased left ventricle (LV) function caused by genetic mutations or injury often leads to debilitating and fatal cardiovascular disease. LV cardiomyocytes are, therefore, a potentially valuable therapeutical target. Human pluripotent stem cell-derived cardiomyocytes (hPSC-CMs) are neither homogeneous nor functionally mature, which reduces their utility. Here, we exploit cardiac development knowledge to instruct differentiation of hPSCs specifically toward LV cardiomyocytes. Correct mesoderm patterning and retinoic acid pathway blocking are essential to generate near-homogenous LV-specific hPSC-CMs (hPSC-LV-CMs). These cells transit via first heart field progenitors and display typical ventricular action potentials. Importantly, hPSC-LV-CMs exhibit increased metabolism, reduced proliferation, and improved cytoarchitecture and functional maturity compared with age-matched cardiomyocytes generated using the standard WNT-ON/WNT-OFF protocol. Similarly, engineered heart tissues made from hPSC-LV-CMs are better organized, produce higher force, and beat more slowly but can be paced to physiological levels. Together, we show that functionally matured hPSC-LV-CMs can be obtained rapidly without exposure to current maturation regimes.

Keywords: cardiac progenitors; cardiomyocyte maturation; cardiomyocytes; differentiation; engineered heart tissues; human pluripotent stem cells; left ventricle; mesoderm; retinoic acid; ventricular.


Conflict of interest statement

N.A.-G. is the vice president of research and development at AnaBios, San Diego. P.E.M. is a founding partner and the chief corporate development officer of AnaBios, San Diego. The Francis Crick Institute has filed a patent application related to this work (WO 2020/245612), and A.S.B. is listed as an inventor. The Francis Crick Institute has granted an exclusive license to Axol Bioscience to commercialize the protocol for the generation and sale of cardiomyocytes for R&D and the provision of contract research services. N.D., C.B., J.C.S., and A.S.B. may benefit from this license.

Figures

None
Graphical abstract
Figure 1
Figure 1
Generation of hPSC-LV-CMs using a two-step approach (A) Depiction of the standard WNT-ON/WNT-OFF protocol; modifications to this protocol (±) and critical feeding steps are indicated. CHIR, CHIR99021; BMP, BMP4; A, activin A; FGF, FGF2; LAA, L-ascorbic acid; IWR1, WNT pathway inhibitor; AGN, AGN193109, a pan-retinoic acid (RA) inhibitor; VitA, vitamin A. (B) Immunostaining micrographs of day 20 hPSC-CMs generated from mesoderm cells exposed to activin A, FGF2, and varying amounts of BMP4 and CHIR, demonstrating the cardiac corridor for making LV-like cardiomyocytes (red box). Scale bar: 100 μm. (C) Flow cytometry plot of day 20 hPSC-LV-CM cultures. (D and E) Day 20 hPSC-CMs generated in the presence or absence of RA signaling (±AGN, ±vitamin A, ±RA). (D) Immunostaining micrographs; scale bar: 100 μm. (E) qRT-PCR analysis. (F and G) Cardiomyocyte quantification in day 20 hPSC-CM cultures differentiated using the standard (Std) or LV protocols. Cells were co-stained with ACTN2, MYL2, and HAND1. DAPI was used to normalize the data. See also Figure S2.
Figure 2
Figure 2
hPSC-LV-CMs arise from first heart field progenitors (A) Principal-component analysis (PCA) of hPSC-LV-CM differentiation time course; days are indicated (d). (B) Heatmap of the top 6 genes enriched in each cluster (C). (C) GO-term analysis showing the top 4 terms in each cluster. (D) qRT-PCR analysis for the indicated days (D). ∗∗p ≤ 0.01 ∗∗∗p ≤ 0.001, ∗∗∗∗p ≤ 0.0001. (E) Expression levels as variance-stabilizing counts (VSTs). (F) Immunostaining micrographs of day 4 and 8 cultures generated using the hPSC-LV-CM protocol. Scale bar: 100 μm. See also Figure S3 and Table S1.
Figure 3
Figure 3
hPSC-LV-CMs mature fast in vitro Cytoarchitecture characterization of day 20 hPSC-CMs differentiated using the Std or LV differentiation protocols. (A–C) Immunostaining micrographs. Scale bars: 50 μm (A), 21 μm (B), and 100 μm (C). (D–F) Fluorescence intensity quantification. (G) Micrographs showing hPSC-CMs where mitochondria were stained with MitoTracker. Scale bar: 50 μm. (H) Sarcomere length quantification. (I) Transmission electron micrographs. (i) Examples of mitochondria (M) next to sarcomeres (blue arrow) or nucleus (red arrow) are indicated. (ii) Sarcomere structures are indicated: Z-disk, I-band, and M-line. Scale bar: 1 μm. (J) Transmission electron micrographs of day (D) 40 hPSC-LV-CMs showing T-tubules and sarcoplasmic reticulum networks (blue arrow heads). Scale bars: 1 μm (top) or 500 nm (bottom). (K) Analysis of mitochondria based on TEM images. (L) Immunostaining micrographs. Top panel (i) is hPSC-LV-CMs, and bottom panel (ii) is rat neonatal CMs. Scale bar: 10 μm. (M) Expression levels (VSTs) and TNNI1/TNNI3 ratio within different RNA-seq datasets. See also Figure S4.
Figure 4
Figure 4
hPSC-LV-CMs are more mature than time-matched cardiomyocytes generated using alternative protocols (A) PCA of human adult ventricular tissues, human adult isolated ventricular cardiomyocytes, human fetal ventricular tissues, and hPSC-CMs of various origins. Ex vivo samples were from the right (R), left (L), or both ventricles (V). (B) Heatmap showing expression levels of a selection of genes involved in the pathways indicated. (C) Immunostaining micrographs of day 20 hPSC-CMs (standard [Std] and LV). Scale bar: 100 μm. (D) Graph showing the quantification of Ki67+ cardiomyocytes in day 20 hPSC-CMs. (E) (i)Western blot analysis of oxphos proteins in day 20 hPSC-CMs. (ii)Quantification of oxphos protein expression in hPSC-CM cultures. (F) Oxygen consumption rate (OCR) graph for day 20 hPSC-CMs (Std and LV). (G–J) Graphs showing the respiration analysis (G), ATP production (H), proton leak (I), and coupling efficiency (J) of hPSC-CMs (Std and LV) based on OCR. See also Figure S5.
Figure 5
Figure 5
hPSC-LV-CMs display ventricular action potentials with hallmarks of electrophysiology maturity Electrophysiology characterization of day 20 hPSC-CMs differentiated using the standard (Std) or LV differentiation protocols (A–H) using optical mapping (A–E) or microelectrode arrays (MEA) (F–H). (A) Transient rate. (B) Representative action potential (AP) shapes; V, ventricular; A, atrial; N, nodal. (C) AP shape morphology assessment. (D) Triangulation results. (E) AP duration (APD) at different repolarization times (50%, 75%, or 90% to baseline). (F) Conduction velocity. (G) AP rise time. (H) Excitation-contraction delay. (I–P) Current-clamping analysis of day (D) 20 or 40 hPSC-LV-CMs. (I) Representative AP traces. (J) AP shape morphology assessment. (K) Example of an AP with a notch. (L) Peak AP amplitude. (M) Resting membrane potential. (N) dV/dt max. (O) ADP at 10% repolarization. (P) ADP at 90% repolarization. (Q) Spike sorting analysis of field potentials from day 40 hPSC-LV-CMs. Top panel shows the field potentials as determined using MEA. Bottom panel shows PC1 and PC2 from the spike sorting analysis. (R) Western blot analysis showing IK1 expression in hPSC-CMs. (S) Quantification of IK1 expression. See also Figure S6.
Figure 6
Figure 6
hPSC-LV-CMs have more adult-like calcium transients Calcium function characterization of day 20 hPSC-CMs differentiated using the standard (Std) or LV differentiation protocols. Data were analyzed using optical mapping. (A) Representative calcium transients (CaTs). (B) CaT amplitude. (C) CaT time to peak (TTP). (D) CaT time to baseline 90 (TTB90). (E) Immunostaining micrographs of hPSC-CMs. Scale bar: 50 μm. (F) Study of RYR inhibition using ryanodine. (i and ii) Representative CaTs after exposure to 5 μM ryanodine. (iii) CaT amplitude after 15 min exposure to different ryanodine concentrations. (G) (i) Western blot analysis showing PLN expression. (ii) Quantification of PLN expression. (H) (i) Western blot analysis showing ATPA2 expression. (ii) Quantification of ATPA2 expression. (I) Study of ATPA2 inhibition using thapsigargin. (i and ii) Representative CaTs after exposure to 5 μM thapsigargin. (iii) CaT amplitude after 15 min exposure to different thapsigargin concentrations. See also Figure S6.
Figure 7
Figure 7
hPSC-LV-CMs generate more functional engineered heart tissues (EHTs) Characterization of EHTs generated from day 40 hPSC-CMs differentiated using the standard (Std) or LV protocols. (A) Light microscopy micrographs showing the overall structure of EHTs. Scale bar: 1 mm. (B) Micrographs showing the ultrastructure of EHTs as obtained by X-ray microscopy. Top panels show longitudinal images. Bottom panels show transverse images. Scale bar: 100 μm. (C and D) Immunostaining micrographs of EHTs. Images represent a single focal plane. Zoomed view (D). Scale bar: 100 μm. (E) Transmission electron micrographs of LV-EHTs showing T-tubules (top) and sarcoplasmic reticulum networks (bottom) (blue arrow heads). Scale bar: 500 nm. (F and G) Graphs showing the sarcomere length (F) and beat rate (G). (H and I) Calcium transient (CaT) analysis of day 14/15 EHTs; CaT time to peak (H) and CaT time to decay 90 (I). (J–L) Graphs showing contraction time to peak (J), contraction relaxation time (K), and contraction duration (L) of day 14/15 EHTs. (M) Force generated at the indicated days post-EHT generation. See also Figure S7.

References

    1. Takasuna K., Asakura K., Araki S., Ando H., Kazusa K., Kitaguchi T., Kunimatsu T., Suzuki S., Miyamoto N. Comprehensive in vitro cardiac safety assessment using human stem cell technology: overview of CSAHi HEART initiative. J. Pharmacol. Toxicol. Methods. 2017;83:42–54. doi: 10.1016/j.vascn.2016.09.004. - DOI - PubMed
    1. Yang X., Papoian T. Moving beyond the comprehensive in vitro proarrhythmia assay: use of human-induced pluripotent stem cell-derived cardiomyocytes to assess contractile effects associated with drug-induced structural cardiotoxicity. J. Appl. Toxicol. 2018;38:1166–1176. doi: 10.1002/jat.3611. - DOI - PubMed
    1. Soma Y., Morita Y., Kishino Y., Kanazawa H., Fukuda K., Tohyama S. The present state and future perspectives of cardiac regenerative therapy using human pluripotent stem cells. Front. Cardiovasc. Med. 2021;8:774389. doi: 10.3389/fcvm.2021.774389. - DOI - PMC - PubMed
    1. Burridge P.W., Matsa E., Shukla P., Lin Z.C., Churko J.M., Ebert A.D., Lan F., Diecke S., Huber B., Mordwinkin N.M., et al. Chemically defined generation of human cardiomyocytes. Nat. Methods. 2014;11:855–860. doi: 10.1038/nmeth.2999. - DOI - PMC - PubMed
    1. Lian X., Zhang J., Azarin S.M., Zhu K., Hazeltine L.B., Bao X., Hsiao C., Kamp T.J., Palecek S.P. Directed cardiomyocyte differentiation from human pluripotent stem cells by modulating Wnt/beta-catenin signaling under fully defined conditions. Nat. Protoc. 2013;8:162–175. doi: 10.1038/nprot.2012.150. - DOI - PMC - PubMed

Publication types