

Comparative review of ambient air PM2.5 source apportioning studies in Tehran
- PMID: 37159743
- PMCID: PMC10163186
- DOI: 10.1007/s40201-023-00855-0
Comparative review of ambient air PM2.5 source apportioning studies in Tehran
Abstract
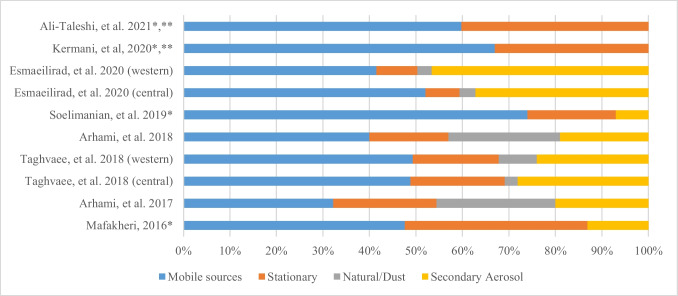
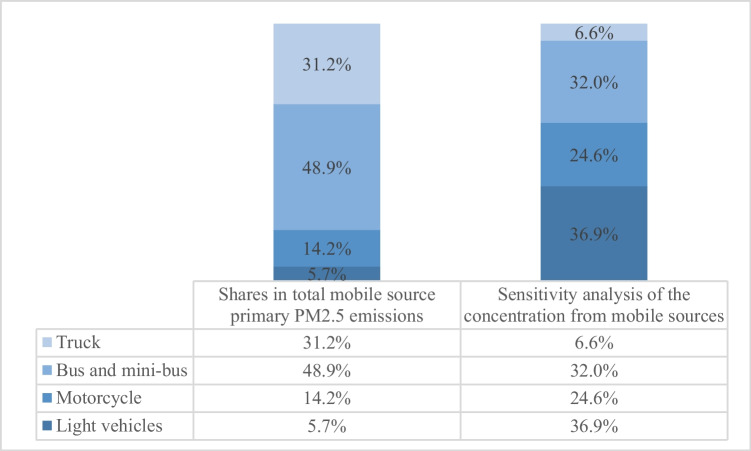
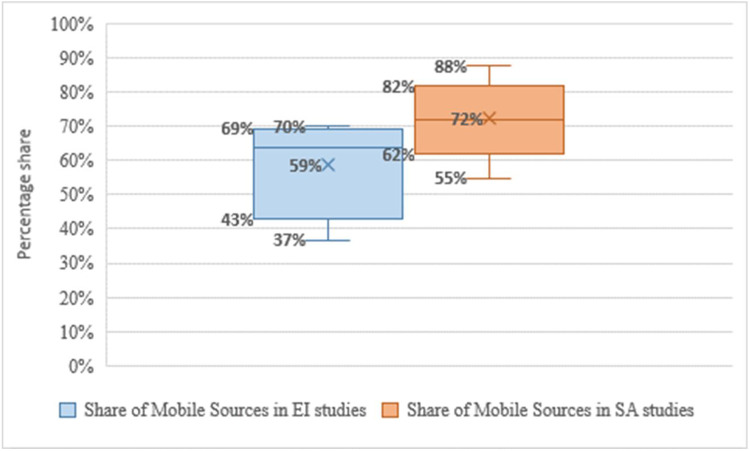
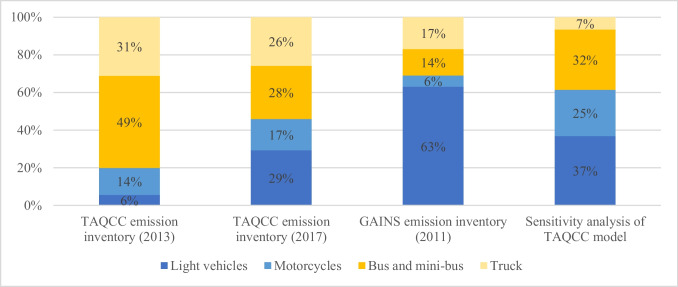
Rapid urbanization and consuming lifestyles have intensified air pollution in urban areas. Air pollution in megacities has imposed severe environmental damages to human health. Proper management of the issue necessitates identification of the share of emission sources. Therefore, numerous research works have studied the apportionment of the total emissions and observed concentrations among different emissions sources. In this research, a comprehensive review is conducted to compare the source apportioning results for ambient air PM2.5 in the megacity of Tehran, the capital of Iran. One hundred seventy-seven pieces of scientific literatures, published between 2005 and 2021, were reviewed. The reviewed research are categorized according to the source apportioning methods: emission inventory (EI), source apportionment (SA), and sensitivity analysis of the concentration to the emission sources (SNA). The possible reasons for inconsistency among the results are discussed according to the scope of the studies and the implemented methods. Although 85% of the reviewed original estimates identify that mobile sources contribute to more thant 60% of Tehran air pollution, the distribution of vehicle types and modes are clearly inconsistent among the EI studies. Our review suggests that consistent results in the SA studies in different locations in central Tehran may indicate the reliability of this method for the identification of the type and share of the emission sources. In contrast, differences among the geographical and sectoral coverage of the EI studies and the disparities among the emission factors and activity data have caused significant deviations among the reviewed EI studies. Also, it is shown that the results of the SNA studies are highly dependent on the categorization type, model capabilities and EI presumptions and data input to the pollutant dispersion modelings. As a result, integrated source apportioning in which the three methods complement each other's results is necessary for consistent air pollution management in megacities.
Supplementary information: The online version contains supplementary material available at 10.1007/s40201-023-00855-0.
Keywords: Air pollution; Emission inventory; PM2.5; Sensitivity analysis; Source apportioning; Source apportionment; Tehran.
© The Author(s), under exclusive licence to Tehran University of Medical Sciences 2023, Springer Nature or its licensor (e.g. a society or other partner) holds exclusive rights to this article under a publishing agreement with the author(s) or other rightsholder(s); author self-archiving of the accepted manuscript version of this article is solely governed by the terms of such publishing agreement and applicable law.
Conflict of interest statement
Conflict of interestThe authors declare that they have no conflicts of interest.
Figures
References
-
- Faridi S, et al. Source apportionment, identification and characterization, and emission inventory of ambient particulate matter in 22 Eastern Mediterranean Region countries: a systematic review and recommendations for good practice. Environ Pollut. 2022;310:119889. doi: 10.1016/j.envpol.2022.119889. - DOI - PubMed
Publication types
LinkOut - more resources
Full Text Sources
Research Materials
