. 2023 Jul 11;56(7):1502-1514.e8.
doi: 10.1016/j.immuni.2023.04.013. Epub 2023 May 8.

Interleukin-3 coordinates glial-peripheral immune crosstalk to incite multiple sclerosis

Affiliations

Interleukin-3 coordinates glial-peripheral immune crosstalk to incite multiple sclerosis

Máté G Kiss et al. Immunity. .

Abstract

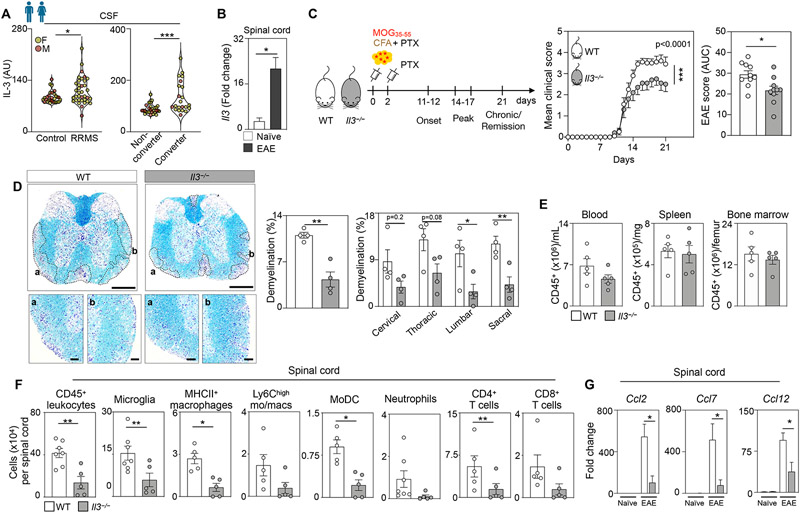
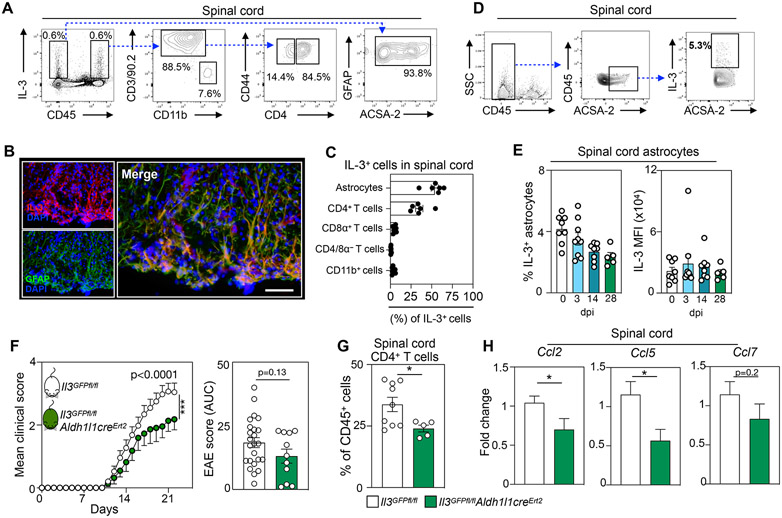
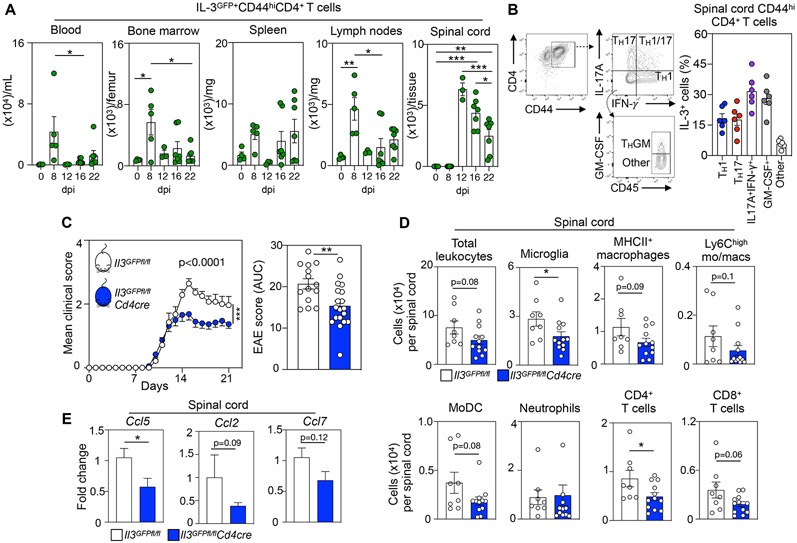
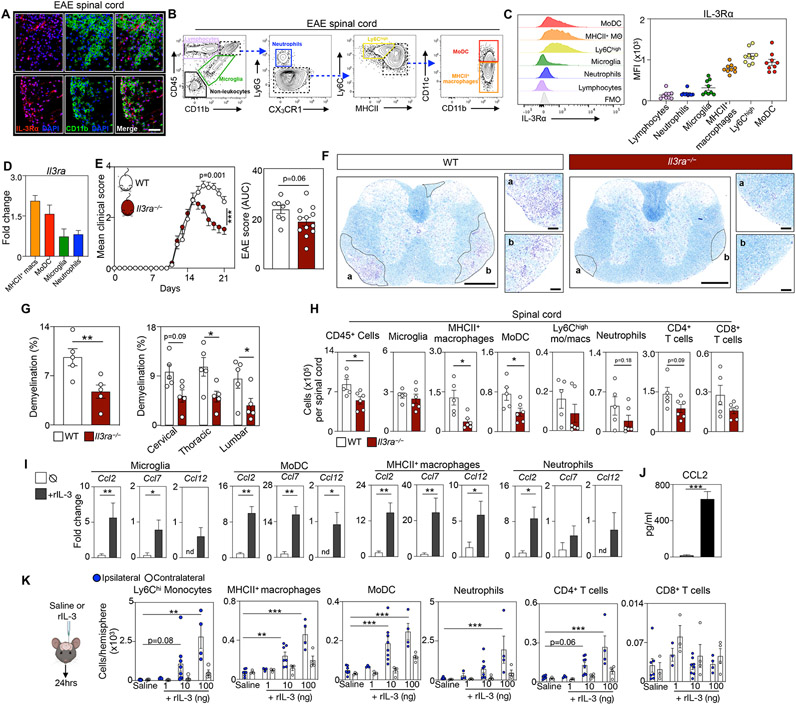
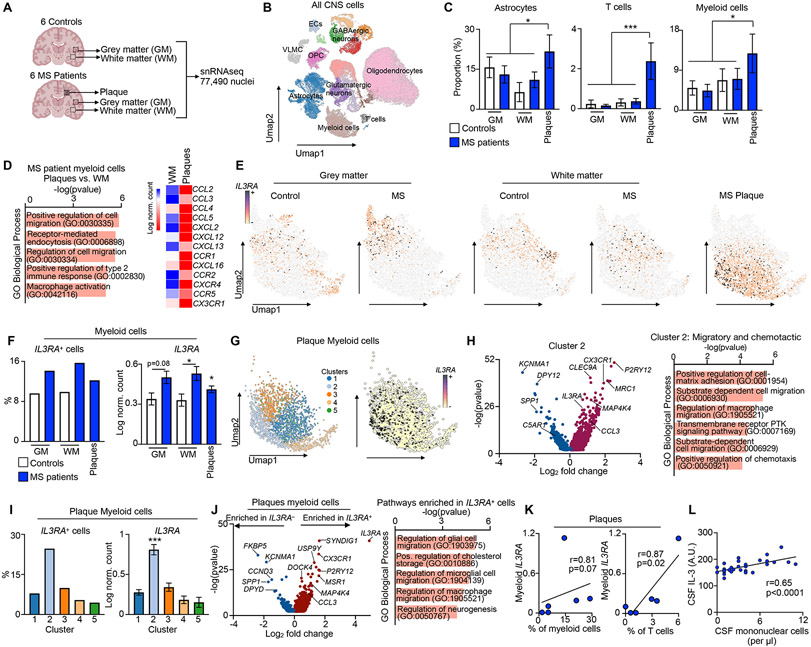
Glial cells and central nervous system (CNS)-infiltrating leukocytes contribute to multiple sclerosis (MS). However, the networks that govern crosstalk among these ontologically distinct populations remain unclear. Here, we show that, in mice and humans, CNS-resident astrocytes and infiltrating CD44hiCD4+ T cells generated interleukin-3 (IL-3), while microglia and recruited myeloid cells expressed interleukin-3 receptor-ɑ (IL-3Rɑ). Astrocytic and T cell IL-3 elicited an immune migratory and chemotactic program by IL-3Rɑ+ myeloid cells that enhanced CNS immune cell infiltration, exacerbating MS and its preclinical model. Multiregional snRNA-seq of human CNS tissue revealed the appearance of IL3RA-expressing myeloid cells with chemotactic programming in MS plaques. IL3RA expression by plaque myeloid cells and IL-3 amount in the cerebrospinal fluid predicted myeloid and T cell abundance in the CNS and correlated with MS severity. Our findings establish IL-3:IL-3RA as a glial-peripheral immune network that prompts immune cell recruitment to the CNS and worsens MS.

Keywords: astrocyte; chemokine; interleukin-3; microglia; monocyte; multiple sclerosis; neuroinflammation; recruitment.


Conflict of interest statement

Declaration of interests B.P.K. is an inventor on patents and/or patent applications filed by Mass General Brigham that describe genome engineering technologies. B.P.K. is a consultant for EcoR1 capital and is an advisor to Acrigen Biosciences, Life Edit Therapeutics, and Prime Medicine.

Figures

Figure 1.
Figure 1.. Interleukin-3 associates with human RRMS and exacerbates spinal cord inflammation, demyelination, and EAE.
(A) Left panel - IL-3 amount in the CSF of male and female unaffected control subjects and patients with RRMS. Right panel - Baseline CSF IL-3 amount in male and female non-converters and patients who converted to MS diagnosis over a 2 year follow up (n=29 controls, 36 RRMS patients, 28 non-converters, 22 converters; Mann–Whitney U-tests). (B) Il3 gene expression in the spinal cord in WT EAE mice at disease peak and naive mice (n=4-5 mice/group; Mann–Whitney U-test). (C) Schematic diagram of the experimental design. EAE was induced in WT and Il3−/− mice by administering myelin oligodendrocyte glycoprotein (MOG35-55) peptide emulsified in complete CFA by subcutaneous injection on day 0 and PTX by intraperitoneal injections on days 0 and 2. Mean clinical disease scores and corresponding AUC analysis of WT and Il3−/− mice over the course of 21 dpi (n=10 mice/group; two-way ANOVA and Mann–Whitney U-test). (D) Representative histological sections of 4 mice per group and quantification of demyelinated area in diseased spinal cords from WT and Il3−/− mice stained for myelin by Luxol fast blue and counterstained with Cresyl Echt Violet Solution at disease peak. Scale bars represent 500 μm for overview images and 100 μm for the inset images (n=4 mice/group; two-way ANOVA and Mann–Whitney U-test). (E) Quantification of CD45+ leukocyte numbers in the blood, spleen and bone marrow of WT and Il3−/− mice at the disease peak (n=5 mice/group). (F) Quantification of leukocyte subsets in the spinal cord of WT and Il3−/− mice at the disease peak (n=5-7 mice/group; Mann–Whitney U-tests). (G) qPCR analysis of chemokine transcript expression in the spinal cord of healthy and EAE WT and Il3−/− mice (n=4-5 mice/group; one-way ANOVA). Mean±s.e.m., *p<0.05, **p<0.01, ***p<0.001. CSF, cerebrospinal fluid; RRMS, relapsing remitting multiple sclerosis; AU, arbitrary units; IL-3, interleukin-3; WT, wildtype; EAE, experimental autoimmune encephalomyelitis; CFA, Freund’s adjuvant; PTX, pertussis toxin; MOG, myelin oligodendrocyte glycoprotein; AUC, area under the curve; dpi, days post immunization. See also Figures S1 and S2.
Figure 2.
Figure 2.. CD44hi CD4+ T cells and astrocytes generate IL-3 in the CNS and astrocytic IL-3 potentiates EAE.
(A) Flow cytometric analysis of IL-3-producing cells in the spinal cords of WT mice at the peak of EAE. (B) Representative immunofluorescent images of the spinal cord of 4 mice showing IL-3 co-localization with the astrocyte marker GFAP in WT EAE mice at peak disease. Scale bar represents 50 μm. (C) Flow cytometric quantification of IL-3-producing cells in the spinal cord of WT EAE mice at disease peak (n=6 mice). (D) Flow cytometric gating strategy identifying IL-3-producing astrocytes in the spinal cord. (E) Quantification of IL-3 production by spinal cord astrocytes during the course of EAE development (n=5-9 mice/group). (F) Mean clinical disease scores and corresponding AUC analysis of Il3GFPfl/fl and Il3GFPfl/flAldh1l1creErt2 male and female mice injected with tamoxifen and induced with EAE (n=11-24 mice/group; two-way ANOVA and Mann–Whitney U-test). (G) Flow cytometric quantification of infiltrating CD4+ T cells in the spinal cord of Il3GFPfl/fl and Il3GFPfl/flAldh1l1creErt2 mice injected with tamoxifen and induced with EAE (n=5-9 mice/group; Mann–Whitney U-test). (H) qPCR analysis of chemokine transcript expression in the spinal cord of Il3GFPfl/fl and Il3GFPfl/flAldh1l1creErt2 mice injected with tamoxifen and exposed to EAE (n=9-13 mice/group; Mann–Whitney U-tests). Mean±s.e.m., *p<0.05, **p<0.01, ***p<0.001. WT, wildtype; EAE, experimental autoimmune encephalomyelitis; GFAP, glial fibrillary acidic protein; DAPI, 4′,6-diamidino-2-phenylindole; AUC, area under the curve; dpi, days post immunization; MFI, mean fluorescence intensity. See also Figure S3.
Figure 3.
Figure 3.. IL-3 production by CD4+ CD44hi effector TH cells promotes EAE development.
(A) Flow cytometric quantification of IL-3GFP+CD44hiCD4+ T cells in the blood, bone marrow, spleen, lymph nodes, and spinal cord throughout the course of EAE (n=3-7 mice/ group; two-way ANOVA). (B) Flow cytometric analysis of IL-3+ cell frequency among TH1 (IFN-γ+), TH17(IL-17A+), IL-17A+IFN-γ+ (IFN-γ+ IL-17A+), GM-CSF+ (GM-CSF+ IFN-γ+ IL-17A), and other (GM-CSF IFN-γ IL-17A) CD44hi CD4+ TH cells in the spinal cord at the peak of EAE (n=6 mice). (C) Mean clinical scores and corresponding AUC analysis of Il3GFPfl/fl and Il3GFPfl/flCd4cre male and female mice exposed to EAE (n=14-19 mice/group; two-way ANOVA and Mann–Whitney U-test). (D) Quantification of leukocyte subsets in the spinal cord of Il3GFPfl/fl and Il3GFPfl/flCd4cre mice at the disease peak by flow cytometry (n=8-12 mice/group; Mann–Whitney U-tests). (E) qPCR analysis of chemokine transcript expression in the spinal cord of Il3GFPfl/fl and Il3GFPfl/flCd4cre mice subjected to EAE (n=6-12 mice/group; Mann–Whitney U-tests). Mean±s.e.m., *p<0.05, **p<0.01, ***p<0.001. EAE, experimental autoimmune encephalomyelitis; AUC, area under the curve; dpi, days post immunization. See also Figure S3.
Figure 4.
Figure 4.. Spinal cord myeloid cells express IL-3Rɑ and aggravate EAE by instigating immune cell recruitment to the CNS.
(A) Representative immunofluorescent images of IL-3Rɑ (CD123) and CD11b on spinal cord sections of 4 WT EAE mice at disease peak. Scale bar is 100 μm. (B) Flow plots showing the cell gating strategy for leukocytes and non-leukocytes in the spinal cords of WT EAE mice at peak disease. (C) Flow cytometric analysis and quantification of IL-3Rɑ expression by spinal cord cells at peak disease (n=9 mice). (D) qPCR analysis of Il3rɑ expression by myeloid cells sorted from the spinal cord at disease peak (n=4-5 mice). (E) Mean clinical score and corresponding AUC analysis of WT and Il3rɑ−/− mice during EAE (n=8-12 mice/group; two-way ANOVA and Mann–Whitney U-test). (F) Representative histological sections of demyelination in diseased spinal cords from 5 WT and 5 Il3rɑ−/− mice stained for myelin by Luxol fast blue and counterstained with Cresyl Echt Violet Solution at disease peak. Scale bars represent 500 μm for overview images and 100 μm for the inset images. (G) Quantification of demyelination area in diseased spinal cords from WT and Il3rɑ−/− mice (n=5 mice/group; two-way ANOVA and Mann–Whitney U-test). (H) Flow cytometric analysis of spinal cord CD45+ leukocyte subsets in WT and Il3rɑ−/− mice at peak disease (n=5-6 mice/group; Mann–Whitney U-tests). (I) Transcript expression analysis in myeloid cells sorted from the spinal cord of WT EAE mice at the peak of disease and stimulated with rIL-3 (n=5 group; Mann–Whitney U-tests). (J) Measurement of CCL2 in the media of monocyte cultures exposed to rIL-3 (n=5 group; Mann–Whitney U-test). (K) Enumeration of immune cells in the brain of mice 24 hours after stereotactic injection of 0, 1, 10, or 100 ng of rIL-3 (n=3-8 mice/group; one-way ANOVA). Mean±s.e.m., *p<0.05, **p<0.01, ***p<0.001. WT, wildtype; EAE, experimental autoimmune encephalomyelitis; MFI, mean fluorescence intensity; rIL-3, recombinant interleukin-3. See also Figure S4.
Figure 5.
Figure 5.. IL-3:IL-3RA promotes migratory and chemotactic myeloid cell subsets in CNS plaques of MS patients.
(A) Schematic of human study and snRNAseq analysis of white matter (WM) and gray matter (GM) from unaffected control subjects and MS patients along with plaques from MS patients. (B) Umap visualization of all CNS cells across all tissue regions and subjects. (C) Proportion of astrocytes, T cells, and myeloid cells in white matter, grey matter, and plaque of control subjects and MS patients (one-way ANOVA). (D) Pathway analysis of genes enriched in myeloid cells and expression of chemotactic genes and receptors in myeloid cells deriving from the plaques vs. adjacent white matter of MS patients. (E) Umap visualizations of IL3RA-expressing myeloid cells across tissue regions and subjects. (F) Proportion of IL3RA-expressing myeloid cells (left) and relative myeloid IL3RA expression (right) across tissue regions and disease states (one-way ANOVA). (G) Umap visualization of myeloid clusters and IL3RA expression in MS plaques. (H) Volcano plot of up and down regulated genes in MS plaque myeloid cluster 2 and GO Biological pathway analysis of upregulated genes. (I) Proportion of IL3RA expressing myeloid cells (left) and IL3RA expression (right) among myeloid clusters of MS plaques. (J) Volcano plot of genes enriched in IL3RA expressing and non-expressing plaque myeloid cells and pathway analysis of genes upregulated in IL3RA expressing plaque myeloid cells. (K) Correlation of plaque myeloid IL3RA expression with the proportion of plaque myeloid and T cells (Spearman correlation). (L) Correlation of CSF IL-3 amount with CSF mononuclear cell abundance in MS patients (Spearman correlation). n=6 unaffected control and 6 MS patients; except L n=28 MS patients Mean±s.e.m., *p<0.05, **p<0.01, ***p<0.001. WM, white matter; GM, grey matter; MS, multiple sclerosis; CNS, central nervous system; Umap, Uniform manifold approximation and projection; ECs, endothelial cells; VLMCs, vascular leptomeningeal cells; OPC, oligodendrocyte progenitor cells; AU, arbitrary unit. See also Figure S5.

Comment in

  • IL-3 finds its home in the brain.
    Bertocchi A, Dougan SK. Bertocchi A, et al. Immunity. 2023 Jul 11;56(7):1431-1433. doi: 10.1016/j.immuni.2023.06.009. Immunity. 2023. PMID: 37437533

References

    1. Reich DS, Lucchinetti CF, and Calabresi PA (2018). Multiple Sclerosis. N. Engl. J. Med 378, 169–180. 10.1056/NEJMra1401483. - DOI - PMC - PubMed
    1. Baecher-Allan C, Kaskow BJ, and Weiner HL (2018). Multiple Sclerosis: Mechanisms and Immunotherapy. Neuron 97, 742–768. 10.1016/j.neuron.2018.01.021. - DOI - PubMed
    1. Lassmann H (2018). Multiple Sclerosis Pathology. Cold Spring Harb. Perspect. Med 8. 10.1101/cshperspect.a028936. - DOI - PMC - PubMed
    1. McGinley MP, Goldschmidt CH, and Rae-Grant AD (2021). Diagnosis and Treatment of Multiple Sclerosis: A Review. JAMA 325, 765–779. 10.1001/jama.2020.26858. - DOI - PubMed
    1. Dougan M, Dranoff G, and Dougan SK (2019). GM-CSF, IL-3, and IL-5 Family of Cytokines: Regulators of Inflammation. Immunity 50, 796–811. 10.1016/j.immuni.2019.03.022. - DOI - PubMed

Publication types