. 2023 Jun 13;56(6):1187-1203.e12.
doi: 10.1016/j.immuni.2023.04.005. Epub 2023 May 8.

cis-B7:CD28 interactions at invaginated synaptic membranes provide CD28 co-stimulation and promote CD8+ T cell function and anti-tumor immunity

Affiliations

cis-B7:CD28 interactions at invaginated synaptic membranes provide CD28 co-stimulation and promote CD8+ T cell function and anti-tumor immunity

Yunlong Zhao et al. Immunity. .

Abstract

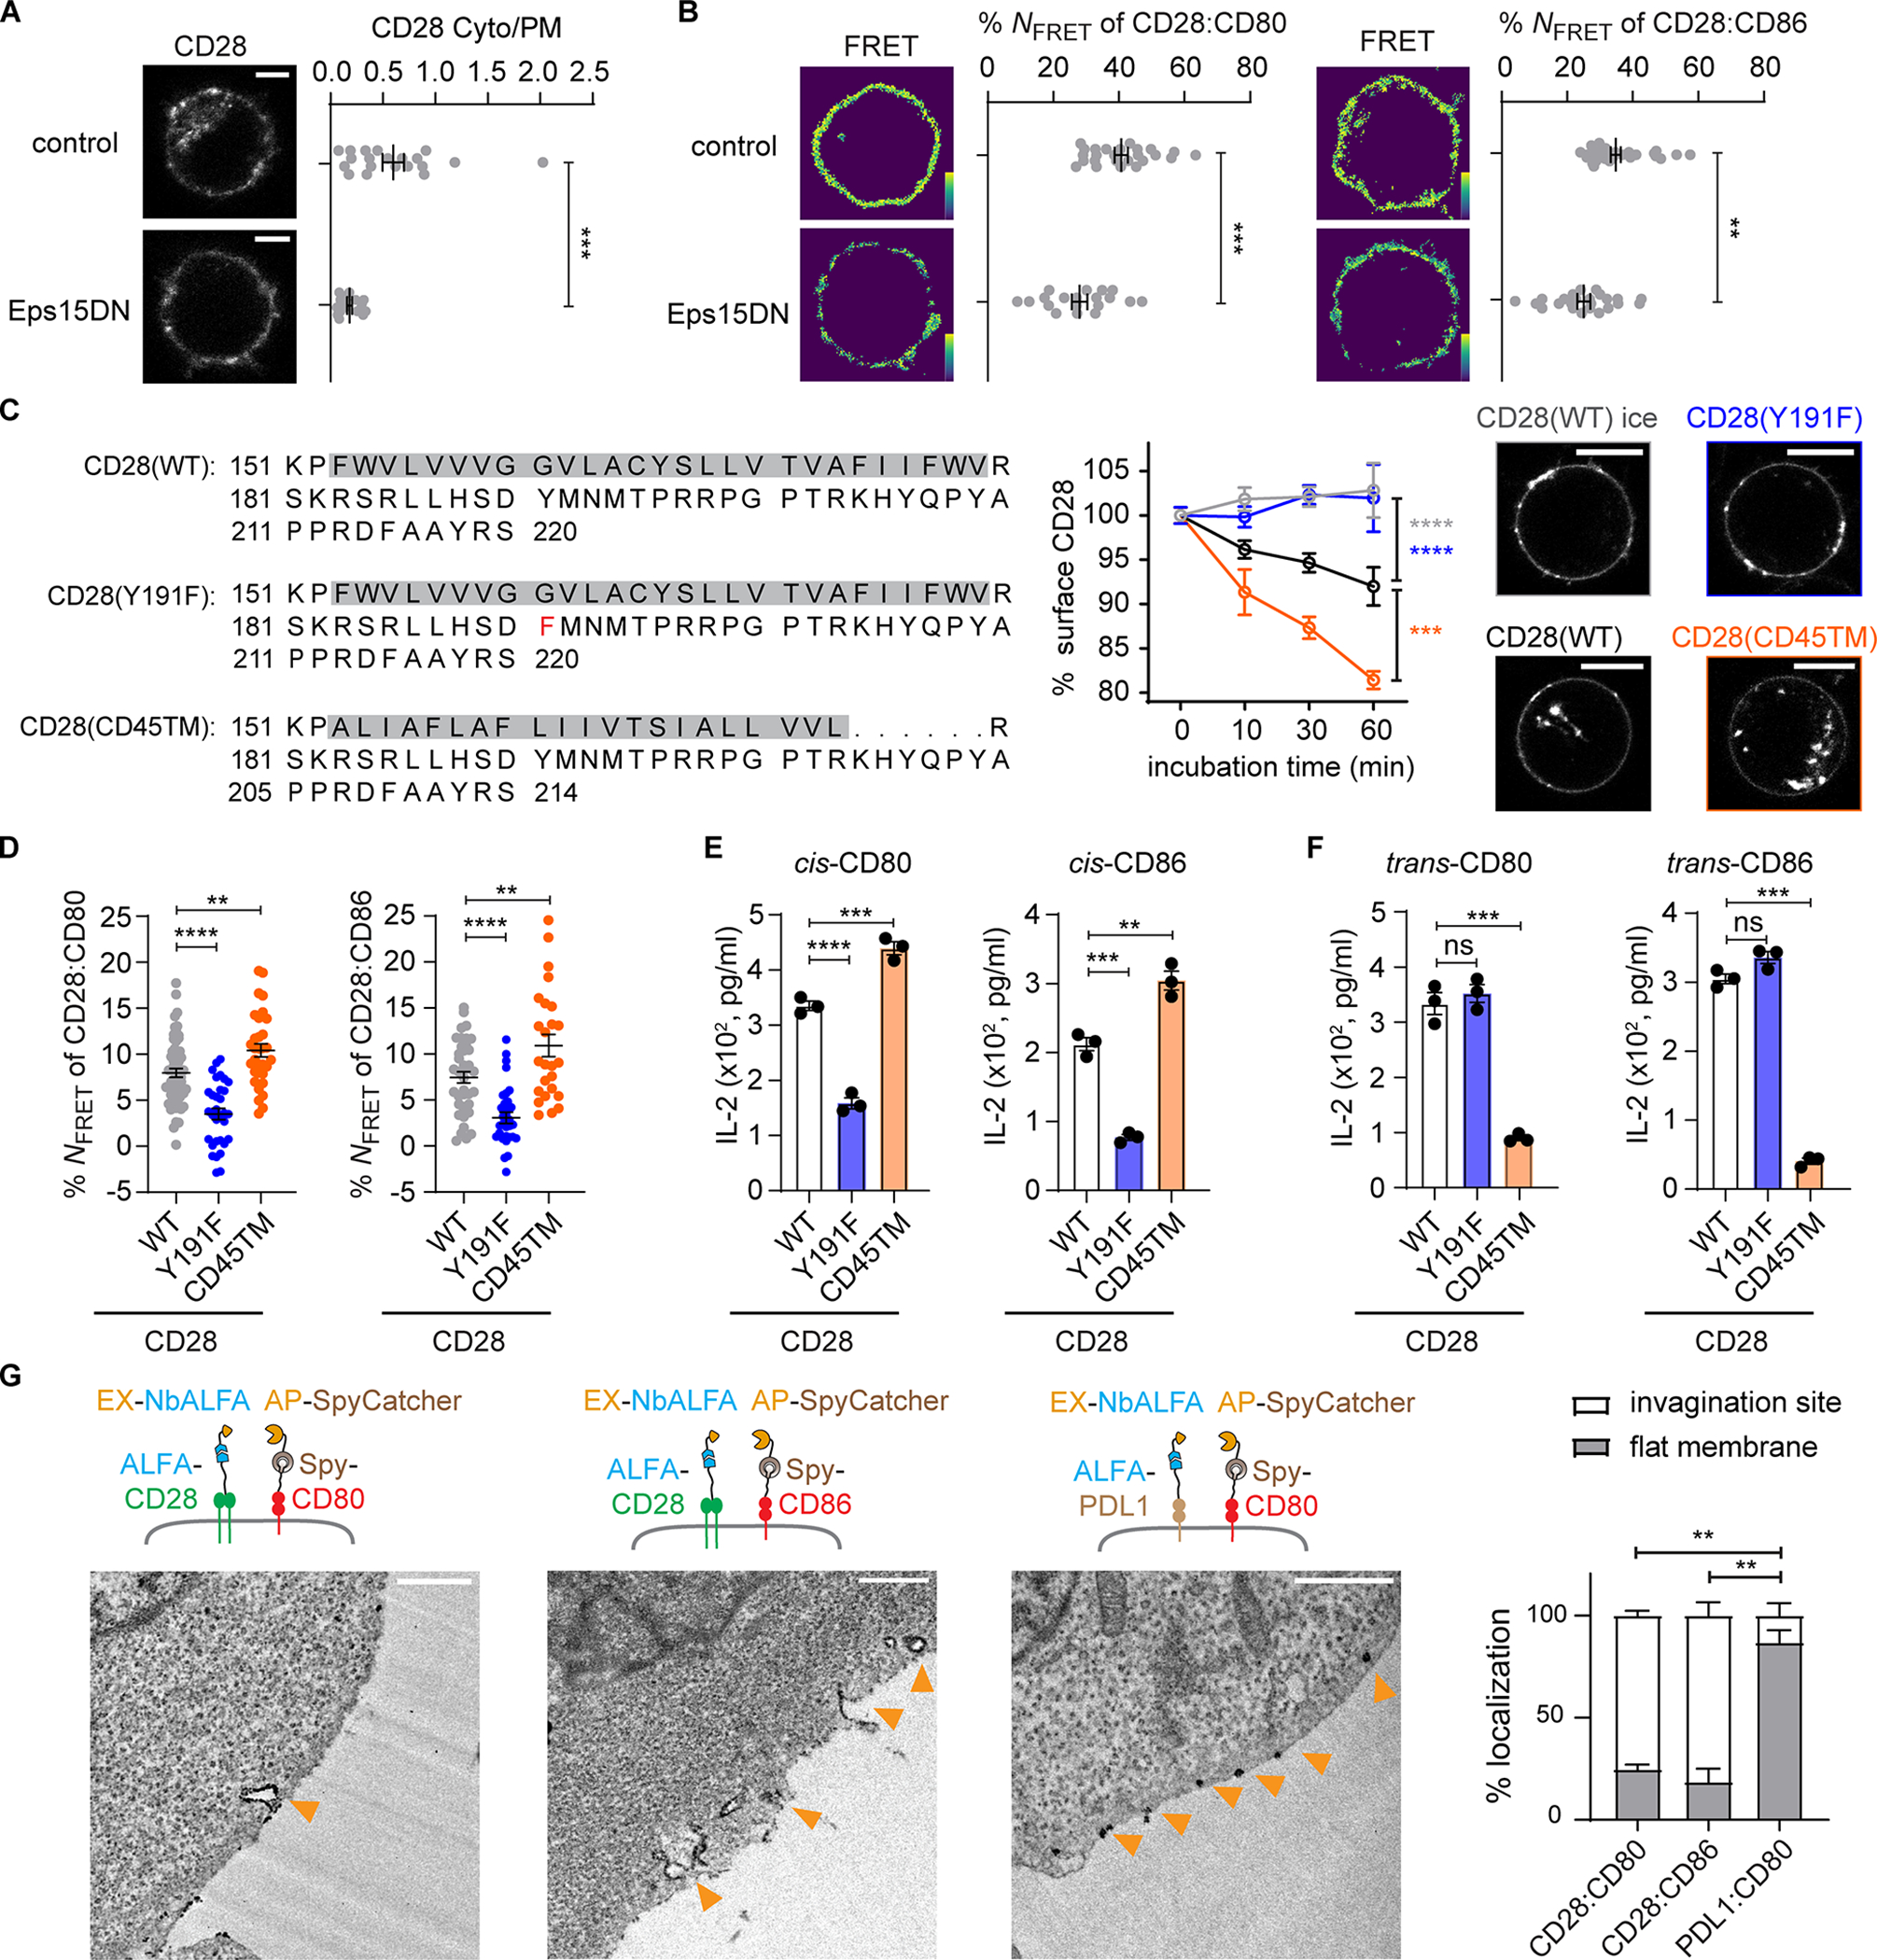
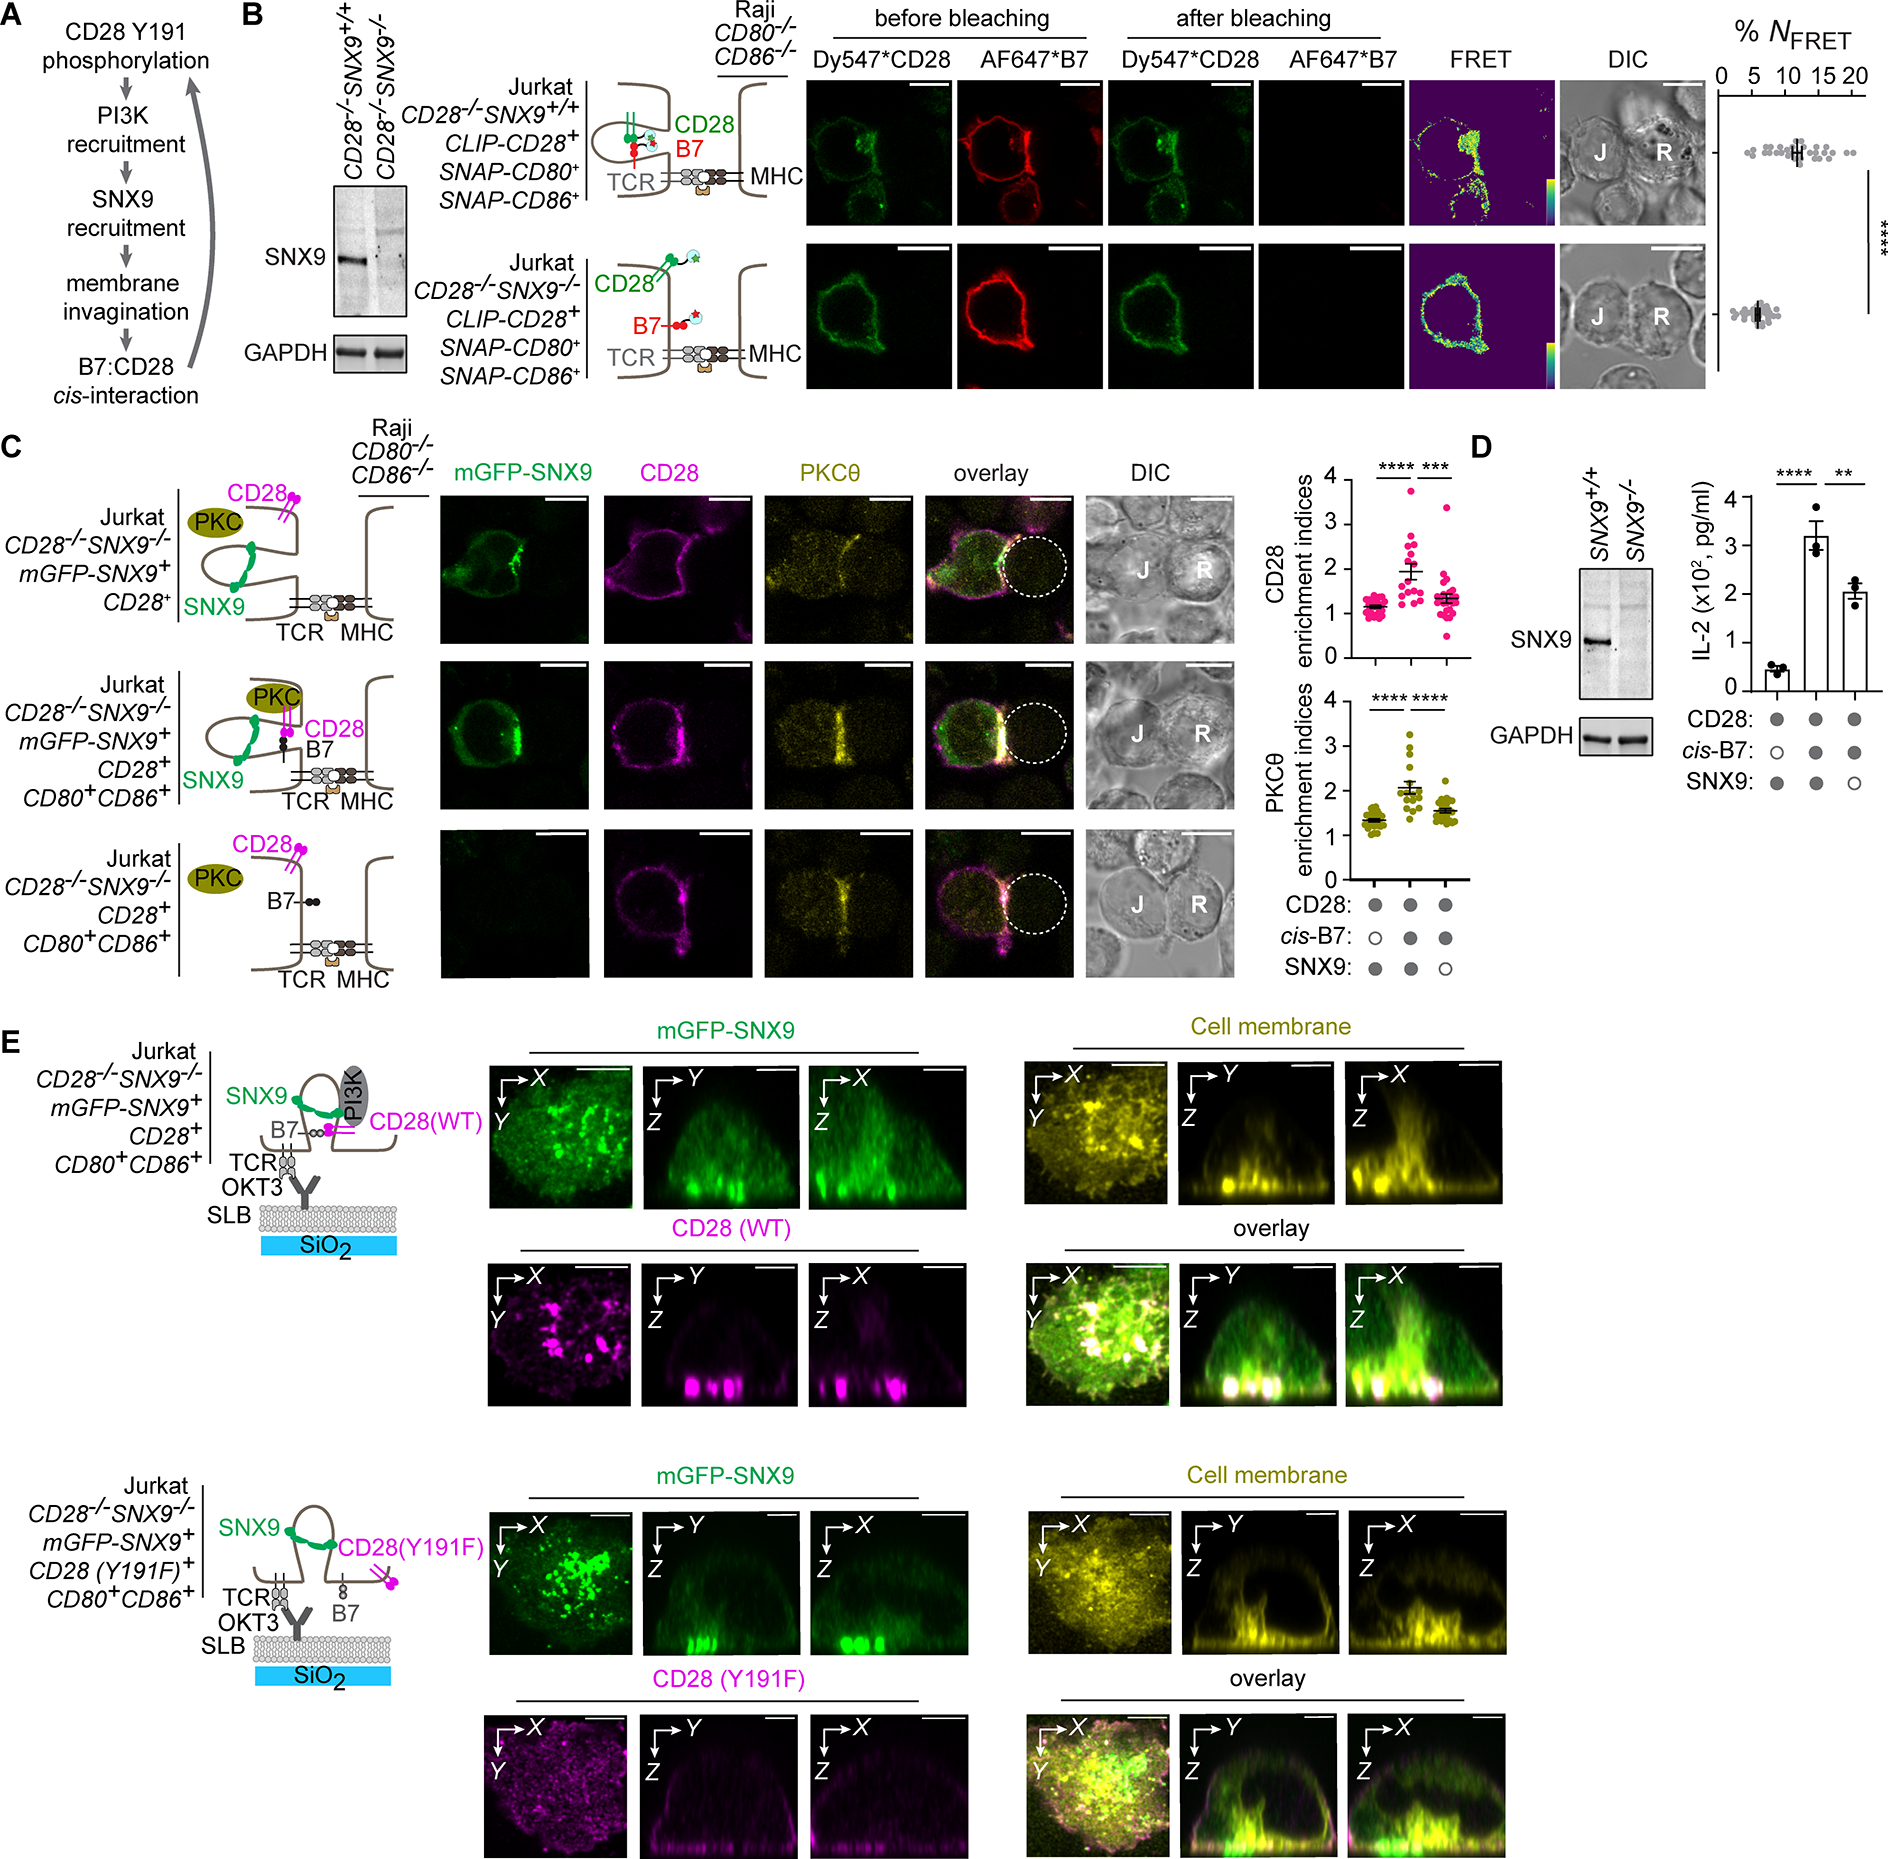
B7 ligands (CD80 and CD86), expressed by professional antigen-presenting cells (APCs), activate the main co-stimulatory receptor CD28 on T cells in trans. However, in peripheral tissues, APCs expressing B7 ligands are relatively scarce. This raises the questions of whether and how CD28 co-stimulation occurs in peripheral tissues. Here, we report that CD8+ T cells displayed B7 ligands that interacted with CD28 in cis at membrane invaginations of the immunological synapse as a result of membrane remodeling driven by phosphoinositide-3-kinase (PI3K) and sorting-nexin-9 (SNX9). cis-B7:CD28 interactions triggered CD28 signaling through protein kinase C theta (PKCθ) and promoted CD8+ T cell survival, migration, and cytokine production. In mouse tumor models, loss of T cell-intrinsic cis-B7:CD28 interactions decreased intratumoral T cells and accelerated tumor growth. Thus, B7 ligands on CD8+ T cells can evoke cell-autonomous CD28 co-stimulation in cis in peripheral tissues, suggesting cis-signaling as a general mechanism for boosting T cell functionality.

Keywords: B7; CD28; PI3K; PKCθ; SNX9; T cell; anti-tumor immunity; cis-interactions; endocytosis; membrane curvatures.


Conflict of interest statement

Declaration of interests The authors declare no competing interests.

Figures

Figure 1
Figure 1. CD28 and B7 are co-expressed on CD8+ T cells, colocalize on plasma membranes, and interact in cis.
A) Flow cytometry histograms showing expression of CD80 and CD86 in OT-1 T cells during in vitro priming using OVA257–264. The line plot shows the percentages of CD28+CD80+, CD28+CD86+, and CD28+CD80+CD86+ OT-1 T cells during priming. Mean ± SEM from three OT-1 mice. (B) STORM of CD28 and Spy-CD80, CD28 and Spy-CD86, or CD28 and Spy-PDL1 on the plasma membranes of HEK293T cells. Leftmost cartoons depict the experimental scheme: CD28 stained with anti-CD28 1st antibody (Ab) and CF568-labeled 2nd Ab; SpyTagged proteins stained with JF646-labeled SpyCatcher. 2nd column: raw two-color STORM images of indicated proteins. Bars = 1 μm. 3rd column: point rendering for two-color localizations computed by Coloc-Tesseler. Blue: CD28 colocalized with B7 or PDL1. Cyan: CD28 not colocalized with B7 or PDL1. Red: B7 or PDL1 colocalized with CD28. Yellow: B7 or PDL1 not colocalized with CD28. Upper dot plot: Manders coefficients calculated using CD28 as a reference (orange) or using CD80, CD86, or PDL1 as a reference (cyan), based on 2–3 random 3 × 3 μm areas from each cell, n ≥ 6 areas from three independent experiments. Lower dot plot: number of molecules counted from each area, grey lines connect data points within the same areas. (C) FRET data of cis-B7:CD28 interactions. Leftmost cartoons show cells co-expressing CLIP-CD28 (Dy547 labeled) and SNAP-tagged CD80, CD86, or PDL1 (AF647 labeled), ± abatacept (Abata). Columns 2–5: confocal images of Dy547 and AF647 channels before and after AF647 photobleaching. Bar = 5 μm. Column 6: calculated pseudo-color FRET efficiency image (yellow to violet denotes strong to weak FRET). Column 7: DIC image. Dot plot: FRET efficiencies (NFRET) from n > 33 cells in ≥ three independent experiments. Mean ± SEM. One-way ANOVA: ****p < 0.0001. See also Figure S1.
Figure 2
Figure 2. Cis-B7:CD28 interactions promote NFκB, AP1, IL-2, and IFNγ expression in T cells.
(A) Cartoons on the left depict CD28+/+NFκB:GFP+AP1:mCherry+ reporter Jurkat cell cocultured with Raji APCs, with CD80 or CD86 expressed on either Jurkat cell (cis) or Raji cell (trans), ± Abatacept. Flow cytometry histograms show GFP and mCherry expression with the mean fluorescence intensity (MFI) indicated. Histograms in condition 2 are shown as dashed lines in conditions 3–10 as references. Green and red bars summarize GFP (NFκB) and mCherry (AP1) MFI respectively. Bar graph: IL-2 concentration in media after 16 h coculture. Data obtained from ≥5 independent experiments. (B) Left, CD28, CD80 and CD86 expression on primed mouse T cells. Right, scheme of primed T cells cocultured with anti-CD3ε-loaded splenocytes. Bar graph: % IFNγ+ T cells after 6 h coculture. Data obtained from 3 independent experiments. (C) Left, CD28, CD80 and CD86 expression on primed human T cells and gating strategy. Right, scheme of primed T cells cocultured with SEB-loaded Raji cell. Bar graph: % IFNγ+ T cells after 6 h coculture. Data obtained from 3 technical replicates using T cells from one donor. Data shown as mean ± SEM. One-way ANOVA (A) and unpaired two-tailed Student’s t test (B, C): *p < 0.05, **p < 0.01, ***p < 0.001, ****p < 0.0001. See also Figure S2.
Figure 3
Figure 3. Cis-B7:CD28 interactions occur head-to-head and are promoted by negative membrane curvatures.
(A) Dot plots summarizing cis-CD80:CD28 FRET and cis-CD86:CD28 FRET when indicated CD28 and B7 were co-expressed in HEK293T cells. Fluorophores coupled to ECDs as in Figure 1C. n > 20 cells from three independent experiments. (B) Ribbon diagrams of predicted CD80:CD28 and CD86:CD28 structures. Dash circles: indicate B7:CD28 binding interfaces. Red residues crucial for interactions. (C) FRET efficiency images and dot plots summarizing cis-CD28:B7 FRET, cis-CD28:PDL1 FRET, and cis-PDL1:CD80 FRET, when the indicated protein pairs were co-expressed in HEK293T cells, with the fluorophores coupled to their ICDs, indicated in the cartoons. n > 36 cells from ≥ 3 independent experiments. (D) A BiLC assay probing the CD28-ICD:B7-ICD proximity with LgBiT and SmBiT fused to the C-terminus of ICDs. Cartoon depicts the theoretical outcomes of head-to-head versus side-by-side binding. Low transfection efficiency allowed untransfected cells to serve as filler cells, limiting trans-contact of double positive cells. Positive control: PDL1:CD80 pair. Bar graphs show luminescence intensity ± blockade drug (Abatacept for cis-B7:CD28, atezolizumab for cis-CD80:PDL1). (E) Same as D except that LgBiT and SmBiT were coupled to the N-terminus of ECDs, to probe ECD proximity within a cis-complex. Cartoon depicts the theoretical outcomes. Bar graph summarizes the experimental data. (F) Control experiments showing limited trans-B7:CD28 interactions due to excess filler cells. LgBiT-CD28 singly-transfected cells incubated with SmBiT-B7 singly-transfected cells in the presence of excess untransfected filler cells. Luminescence data summarized in the bar graph as mean ± SEM from four independent experiments. (E) Effects of FBP17-induced membrane curvatures on cis-B7:CD28 FRET. HEK293T cells expressed CLIP-CD28, SNAP-B7, FKBP-TagBFP-CAAX, and mGFP-FRB-FBP17. Cartoon depicts a likely series of molecular events: Rapa induces membrane recruitment mGFP-FRB-FBP17, which invaginates the membranes to promote cis-CD28:B7 interactions. Confocal images show Rapa effects on mGFP-FRB-FBP17 localizations. Dot plot summarizes cis-B7:CD28 and cis-CD80:PDL1 FRET of HEK293T cells treated with DMSO or Rapa, ± Abata from n > 21 cells from ≥ 3 independent experiments. Unpaired two-tailed Student’s t test (D, E) and One-way ANOVA (B-F): *p < 0.05, **p < 0.01, ***p < 0.001, ****p < 0.0001. See also Figure S3.
Figure 4
Figure 4. Cis-B7:CD28 interactions depend on CD28 endocytosis.
(A) Effects of Eps15DN on cis-B7:CD28 interactions. Left, confocal images of Dy547*CLIP-CD28 expressed in HEK293T cells with or without co-transfection with Eps15DN. Dot plot: ratio of intracellular CD28 to cell surface CD28 of n > 16 cells from three independent experiments. (B) Left, Dy547*CLIP-CD28:AF647*SNAP-CD80 FRET in HEK293T cells (control) and HEK293T cells co-transfected with Eps15DN. Dot plot: NFRET of n > 20 cells from three independent experiments. Right, same as Left except replacing CD80 with CD86, n > 23 cells from three independent experiments. Bar = 5 μm. (C) Internalization kinetics of CD28 mutants. Jurkat cells transduced with Spy-CD28, Spy-CD28(Y191F), or Spy-CD28(CD45TM), with amino acid (AA) sequence of TMD and ICD shown, were labeled with biotinylated SpyCatcher on ice, followed by incubation at 37 °C or on ice. Cell surface CD28 stained by AF647-conjugated streptavidin, measured by flow cytometry, normalized to AF647 MFI at 0 min, and plotted against time (mean ± SEM, n > 5). Confocal images of indicated Jurkat cell taken after 60 min incubation at 37 °C upon staining Spy-CD28 proteins with JF646*SpyCatcher. Bar = 10 μm. (D) Dot plots summarizing the FRET between indicated CLIP-CD28 variants and SNAP-B7. n > 24 cells in ≥ 3 independent experiments. (E) Effects of CD28 endocytosis mutants on cis-B7 induced IL-2 secretion. Jurkat co-expressing CD28(WT) or indicated mutant with CD80 or CD86 cocultured with excess SEE-loaded CD80−/−CD86−/− Raji APCs. Bar graphs summarize IL-2 in the media in three independent experiments. (F) Effects of CD28 endocytosis mutants on trans-B7 induced IL-2 secretion. Same as E except that CD80 or CD86 was expressed in Raji cell rather than in Jurkat cell. (G) Localizing cis-B7:CD28 complexes and cis-CD80:PDL1 complexes using Split-APEX2 and TEM. Jurkat cells co-expressing ALFA-CD28 and Spy-B7, or ALFA-PDL1 and Spy-CD80 were labeled by EX-NbALFA and AP-SpyCatcher. Functional APEX2 detected by DAB staining, observed using TEM, denoted by orange arrows. Bar graph: % DAB stains on flat membrane and invaginated membrane of n > 17 cells from two independent experiments. Bar = 0.5 μm. Unpaired two-tailed Student’s t test (A), One-way ANOVA (C-F) and Two-way ANOVA (B): *p < 0.05, **p < 0.01, ***p < 0.001, ****p < 0.0001. See also Figure S4.
Figure 5
Figure 5. Cis-B7 promotes the synaptic enrichment of CD28 and PKCθ and decreases the membrane association of CD28 ICD.
(A) Effects of cis-B7 on CD28 and PKCθ localizations. Cartoon on top: AA sequence of human CD28 ICD with PI3K, Lck, and PKCθ binding motifs highlighted. Leftmost cartoons depict a CD80−/−CD86−/− Raji cell contacting a CD28+ Jurkat cell, a CD28+B7+ Jurkat cell, an Abata-treated CD28+B7+ Jurkat cell, a CD28(Y191F)+B7+ Jurkat cell or a CD28(Y209F)+B7+ Jurkat cell. Immediate right are confocal images of immunostained CD28 and PKCθ acquired 30 min after Jurkat:Raji cell contact. Dashed circles indicate Raji cells conjugated to Jurkat cells. Dot plots: synaptic enrichment indices of CD28 (magenta) and PKCθ (green), n > 27 conjugates from three independent experiments. Bar = 10 μm. (B) Bar graph summarizing IL-2 secretion by Jurkat cells expressing indicated CD28 variants cocultured with SEE-loaded Raji cells, with CD80 expressed either on Jurkat cell (in cis) or on Raji cell (in trans). Data from two independent experiments with two technical replicates each. (C) A FRET assay showing effects of cis-B7 on CD28-ICD:membrane binding, depicted in cartoon on top. Leftmost cartoons depict a CD80−/−CD86−/− Raji cell contacting a CD28-mTFP1+ Jurkat cell, a CD28-mTFP1+B7+ Jurkat cell, or an Abata-treated CD28-mTFP1+B7+ Jurkat cell. Immediate right are confocal images of CD28-mTFP1 and R18 before and after R18 photobleaching, and pseudo-color FRET efficiency images. Dot plots: NFRET calculated based on the Jurkat:Raji cell contact zone from n > 23 conjugates in three independent experiments. Data shown as mean ± SEM. One-way ANOVA: *p < 0.05, **p < 0.01, ***p < 0.001, ****p < 0.0001.
Figure 6
Figure 6. SNX9-induced membrane invagination at the T:APC interface promotes cis-B7:CD28 interactions and T cell activation.
(A) Model by which CD28:PI3K interaction promotes cis-B7:CD28 interactions via SNX9-driven membrane invagination. (B) A FRET assay showing effects of SNX9 deficiency on cis-B7:CD28 interactions. Leftmost western blot shows SNX9 and GAPDH expression in indicated Jurkat cells. Immediate right are cartoons showing indicated Jurkat cells conjugated with CD80−/−CD86−/− Raji cell. Further right are confocal images of Dy547 and AF647 channels before and after AF647 photobleaching, FRET efficiency image, and DIC image. Bar = 10 μm. Dot plot: cis-B7:CD28 NFRET from n > 30 cells in three independent experiments. Mean ± SEM. (C) Effects of SNX9 deficiency on cis-B7-induced synaptic enrichment of CD28 and PKCθ. Leftmost cartoons depict a CD80−/−CD86−/− Raji cell contacting Jurkat cell with indicated genotype. Further right are confocal images of immunostained CD28 and PKCθ acquired 30 min after Jurkat:Raji cell contact, with Raji cell denoted by a dash circle. Dot plots: synaptic enrichment indices of CD28 (magenta) and PKCθ (yellow), n > 16 conjugates in three independent experiments. Bar = 10 μm. (D) Effects of SNX9 deficiency on cis-B7 induced IL-2 secretion. Western blot shows SNX9 and GAPDH expression in indicated Jurkat cells. Bar graph on the right summarizes IL-2 secretion from WT or SNX9−/− Jurkat cell with or without B7 transduced upon coculture with excess SEE-loaded CD80−/−CD86−/− Raji cell in three independent experiments. (E) 3D reconstructed Z-stack confocal images of SNX9, T cell membranes, and CD28 in the presence of cis-B7 upon TCR stimulation. Leftmost cartoons depict Jurkat cell with indicated genotype triggered by an anti-CD3ε (OKT3) containing SLB. On the right are 3D reconstruction images of mGFP-SNX9, R18-stained Jurkat cell membranes, and immunostained CD28(WT) or CD28(Y191F) acquired 30 min after Jurkat:SLB contact. Bar = 5 μm. Unpaired two-tailed Student’s t test for (B), One-way ANOVA for (C, D). **p < 0.01, ***p < 0.001, ****p < 0.0001.
Figure 7
Figure 7. Disruption of cis-B7:CD28 interactions attenuates cytokine production, cytotoxicity, survival, migration and anti-tumor activity of CD8+ T cells.
(A) Dot plots summarizing IL-2, IFNγ, and GzmB productions from primed OT-1 cells after 24 h coculture with five-fold excess B7-negative B16F10 or B16OVA, in the presence of Abata or IgG control. (B) Dot plots summarizing Bcl-xL expression and % live population of OT-1 cells after 72 h of OT-1:B16 cell co-culture depicted in A. (C) OT-1 cell migration cross a FN-coated transwell in the presence of Abata or IgG control. OT-1 cells were pre-conditioned by IL-2 or IL-15 as depicted. Dot plots: % cells migrated to the bottom well in 4 h. (D) Effects of cis-B7:CD28 interactions on actin foci formation. Left, TIRF images of actin foci in LifeAct-mCherry-transduced, IL-15 conditioned OT-1 cells seeded on an ICAM1-coated plate, in the presence of Abata or IgG control. Dot plot summarizes numbers of actin foci per cell from two independent experiments. n > 52 cells, bar = 5 μm. (E) Effects of cis-B7:CD28 interactions on OT-1 cell proliferation. Same as (A) except measuring Ki67 expression. (F) Effects of Abata on B16OVA tumor growth in Cd80−/−Cd86−/− C57BL/6J mice adoptively transferred with OT-1 cells. Left, experimental scheme. Middle, tumor volume plotted against time for individual mice that received either Abata or IgG control. Right, mean tumor volume plotted against time for all mice in the indicated treatment group. (G, H) Effects of Abata on total and Tcm OT-1 cells adoptively transferred to CD80−/−CD86−/−, B16OVA-bearing C57BL/6J mice, measured in tumor and blood at the end point. (I) Effects of Abata on TNFα and IFNγ expression in tumor-infiltrating OT-1 cells. Data shown as mean ± SEM, n = 12 for IgG condition and n = 9 for Abata condition. (J) Left, CD28, CD80 and CD86 expressions on Cd28−/− OT-1 cells reconstituted with Cd28(WT) or Cd28(Y170F). Right, IL-2, IFNγ and GzmB production by indicated OT-1 cells upon 24 h coculture with OVA-loaded B16F10 cells. Data from 2 mice with 2 technical replicates each. (K) B16OVA tumor growth in WT C57BL/6J mice transferred with Cd28(WT)+ OT-1 cell or Cd28(Y170F)+ OT-1 cell. Left, experimental scheme. Middle, tumor volume plotted against time for individual mice that received indicated OT-1 cell or PBS alone. Right, mean tumor volume plotted against time. (L, M) Total and Tcm Cd28(WT)+ OT-1 cells or Cd28(Y170F)+ OT-1 cells in tumor and blood of OT-1 cell transferred mice at the end point. (N) TNFα and IFNγ expression in tumor-infiltrating Cd28(WT)+ OT-1 cell and Cd28(Y170F)+ OT-1 cell. Data shown as mean ± SEM, n = 10 for each condition. Unpaired two-tailed Student’s t test for (C, D, G-I, L-N), One-way ANOVA for (A, B, E, J), Two-way ANOVA for (F, K). ns, p > 0.05, *p < 0.05, **p < 0.01, ***p < 0.001, ****p < 0.0001. See also Figures S5–S7.

Comment in

References

    1. Hansen JA, Martin PJ, and Nowinski RC (1980). Monoclonal antibodies identifying a novel T-Cell antigen and Ia antigens of human lymphocytes. Immunogenetics 10, 247–260. 10.1007/BF01561573. - DOI
    1. Gmünder H, and Lesslauer W (1984). A 45-kDa human T-cell membrane glycoprotein functions in the regulation of cell proliferative responses. Eur J Biochem 142, 153–160. 10.1111/j.1432-1033.1984.tb08263.x. - DOI - PubMed
    1. Esensten Jonathan H., Helou Ynes A., Chopra G, Weiss A, and Bluestone Jeffrey A. (2016). CD28 Costimulation: From Mechanism to Therapy. Immunity 44, 973–988. 10.1016/j.immuni.2016.04.020. - DOI - PMC - PubMed
    1. Boomer JS, and Green JM (2010). An enigmatic tail of CD28 signaling. Cold Spring Harbor perspectives in biology 2, a002436. 10.1101/cshperspect.a002436. - DOI - PMC - PubMed
    1. Weng N-P, Akbar AN, and Goronzy J (2009). CD28(−) T cells: their role in the age-associated decline of immune function. Trends Immunol 30, 306–312. 10.1016/j.it.2009.03.013. - DOI - PMC - PubMed

Publication types