FDA approval, clinical trial evidence, efficacy, epidemiology, and price for non-orphan and ultra-rare, rare, and common orphan cancer drug indications: cross sectional analysis
- PMID: 37160306
- PMCID: PMC10167557
- DOI: 10.1136/bmj-2022-073242
FDA approval, clinical trial evidence, efficacy, epidemiology, and price for non-orphan and ultra-rare, rare, and common orphan cancer drug indications: cross sectional analysis
Abstract
Objective: To analyze the US Food and Drug Administration (FDA) approval, trials, unmet needs, benefit, and pricing of ultra-rare (<6600 affected US citizens), rare (6600-200 000 citizens), and common (>200 000 citizens) orphan cancer drug indications and non-orphan cancer drug indications.
Design: Cross sectional analysis.
Setting: Data from Drugs@FDA, FDA labels, Global Burden of Disease study, and Medicare and Medicaid.
Population: 170 FDA approved drugs across 455 cancer indications between 2000 and 2022.
Main outcome measures: Comparison of non-orphan and ultra-rare, rare, and common orphan indications regarding regulatory approval, trials, epidemiology, and price. Hazard ratios for overall survival and progression-free survival were meta-analyzed.
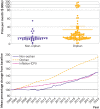
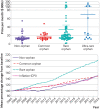
Results: 161 non-orphan and 294 orphan cancer drug indications were identified, of which 25 were approved for ultra-rare diseases, 205 for rare diseases, and 64 for common diseases. Drugs for ultra-rare orphan indications were more frequently first in class (76% v 48% v 38% v 42%; P<0.001), monotherapies (88% v 69% v 72% v 55%; P=0.001), for hematologic cancers (76% v 66% v 0% v 0%; P<0.001), and supported by smaller trials (median 85 v 199 v 286 v 521 patients; P<0.001), of single arm (84% v 44% v 28% v 21%; P<0.001) phase 1/2 design (88% v 45% v 45% v 27%; P<0.001) compared with rare and common orphan indications and non-orphan indications. Drugs for common orphan indications were more often biomarker directed (69% v 26% v 12%; P<0.001), first line (77% v 39% v 20%; P<0.001), small molecules (80% v 62% v 48%; P<0.001) benefiting from quicker time to first FDA approval (median 5.7 v 7.1 v 8.9 years; P=0.02) than those for rare and ultra-rare orphan indications. Drugs for ultra-rare, rare, and common orphan indications offered a significantly greater progression-free survival benefit (hazard ratio 0.53 v 0.51 v 0.49 v 0.64; P<0.001), but not overall survival benefit (0.50 v 0.73 v 0.71 v 0.74; P=0.06), than non-orphans. In single arm trials, tumor response rates were greater for drugs for ultra-rare orphan indications than for rare or common orphan indications and non-orphan indications (objective response rate 57% v 48% v 55% v 33%; P<0.001). Disease incidence/prevalence, five year survival, and the number of available treatments were lower, whereas disability adjusted life years per patient were higher, for ultra-rare orphan indications compared with rare or common indications and non-orphan indications. For 147 on-patent drugs with available data in 2023, monthly prices were higher for ultra-rare orphan indications than for rare or common orphan indications and non-orphan indications ($70 128 (£55 971; €63 370) v $33 313 v $16 484 v $14 508; P<0.001). For 48 on-patent drugs with available longitudinal data from 2005 to 2023, prices increased by 94% for drugs for orphan indications and 50% for drugs for non-orphan indications on average.
Conclusions: The Orphan Drug Act of 1983 incentivizes development of drugs not only for rare diseases but also for ultra-rare diseases and subsets of common diseases. These orphan indications fill significant unmet needs, yet their approval is based on small, non-robust trials that could overestimate efficacy outcomes. A distinct ultra-orphan designation with greater financial incentives could encourage and expedite drug development for ultra-rare diseases.
© Author(s) (or their employer(s)) 2019. Re-use permitted under CC BY-NC. No commercial re-use. See rights and permissions. Published by BMJ.
Conflict of interest statement
Competing interests: All authors have completed the ICMJE uniform disclosure form at https://www.icmje.org/disclosure-of-interest/ and declare: support from the Open Access Publication Fund of the University of Wuppertal; no financial relationships with any organizations that might have an interest in the submitted work in the previous three years; no other relationships or activities that could appear to have influenced the submitted work.
Figures


Comment in
-
US Orphan Drug Act.BMJ. 2023 May 9;381:928. doi: 10.1136/bmj.p928. BMJ. 2023. PMID: 37160304 No abstract available.
References
-
- 21 US Code Part B. Drugs for Rare Diseases or Conditions.
MeSH terms
Substances
LinkOut - more resources
Full Text Sources
Medical
