. 2023 May 9;14(1):2661.
doi: 10.1038/s41467-023-38323-w.

In situ continuous Dopa supply by responsive artificial enzyme for the treatment of Parkinson's disease

Affiliations

In situ continuous Dopa supply by responsive artificial enzyme for the treatment of Parkinson's disease

Xiao Fang et al. Nat Commun. .

Abstract

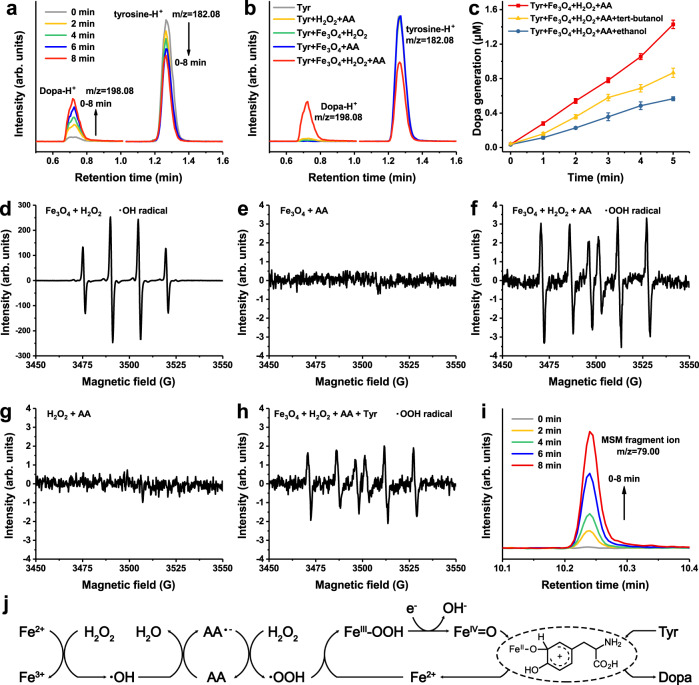
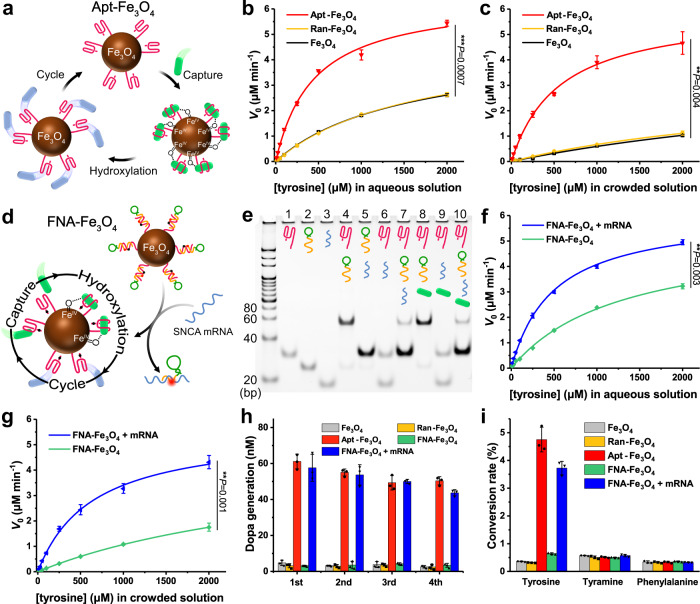
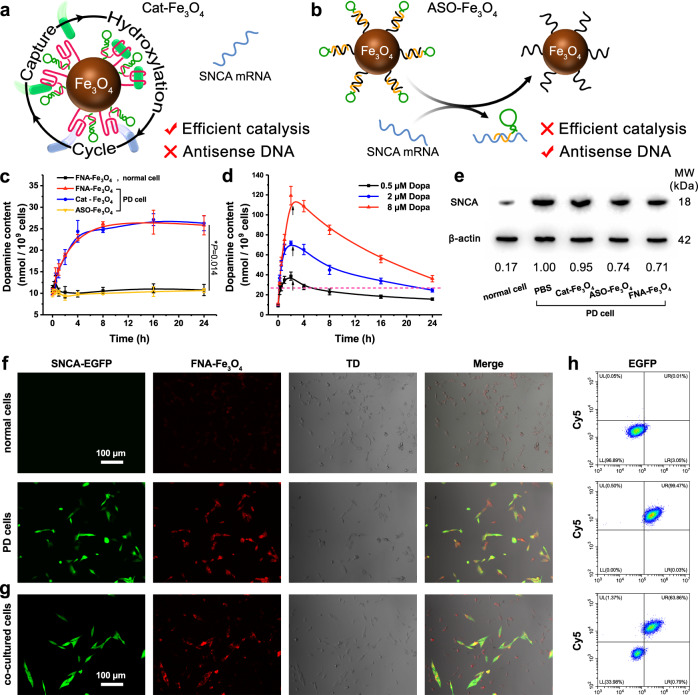
Oral dihydroxyphenylalanine (Dopa) administration to replenish neuronal dopamine remains the most effective treatment for Parkinson's disease (PD). However, unlike the continuous and steady dopamine signaling in normal neurons, oral Dopa induces dramatic fluctuations in plasma Dopa levels, leading to Dopa-induced dyskinesia. Herein, we report a functional nucleic acid-based responsive artificial enzyme (FNA-Fe3O4) for in situ continuous Dopa production. FNA-Fe3O4 can cross the blood-brain barrier and target diseased neurons relying on transferrin receptor aptamer. Then, FNA-Fe3O4 responds to overexpressed α-synuclein mRNA in diseased neurons for antisense oligonucleotide treatment and fluorescence imaging, while converting to tyrosine aptamer-based artificial enzyme (Apt-Fe3O4) that mimics tyrosine hydroxylase for in situ continuous Dopa production. In vivo FNA-Fe3O4 treatment results in recovery of Dopa and dopamine levels and decrease of pathological overexpressed α-synuclein in PD mice model, thus ameliorating motor symptoms and memory deficits. The presented functional nucleic acid-based responsive artificial enzyme strategy provides a more neuron friendly approach for the diagnosis and treatment of PD.


Conflict of interest statement

The authors declare no competing interests.

Figures

Fig. 1
Fig. 1. Schematic diagram of FNA-Fe3O4 for the treatment of PD.
a Catalytic mechanism of Fe3O4 nanozymes on the hydroxylation of tyrosine to produce Dopa (Phase I), illustration of the functions of Apt-Fe3O4 (Phase II) and FNA-Fe3O4 (Phase III). b Illustration of FNA-Fe3O4 for synergistic treatment of PD.
Fig. 2
Fig. 2. The tyrosine hydroxylase-mimicking activity of Fe3O4 nanoparticles.
a Time-dependent UPLC-MS peak intensities changes of reactant tyrosine and product Dopa in the presence of 10 μg mL−1 Fe3O4 nanoparticles, 100 μM tyrosine, 5 mM H2O2, and 5 mM AA. Peaks at m/z = 182.08 and m/z = 198.08 represent tyrosine and Dopa respectively. b UPLC-MS peak intensities of reactant tyrosine and product Dopa in systems with different reaction conditions. c Dopa generation in the reaction system (10 μg mL−1 Fe3O4 nanoparticles, 100 μM tyrosine, 5 mM H2O2 and 5 mM AA) in the presence of 1 mM tert-butanol or ethanol. The results were expressed as mean ± SD (n = 3 independent experiments). dh ESR spectra corresponding to the ·OH generated by Fe3O4 nanoparticles in the presence of H2O2 (d), no free radical generated by Fe3O4 nanoparticles in the presence of AA (e), the ·OOH generated by Fe3O4 nanoparticles in the presence of H2O2 and AA (f), no free radical generated in the mixture of H2O2 and AA (g), the ·OOH generated by Fe3O4 nanoparticles in the presence of H2O2 and AA with added tyrosine (h). i Time-dependent GC-MS peak intensities of MSM in the presence of 10 μg mL−1 Fe3O4 nanoparticles, 1 mM DMSO, 5 mM H2O2 and 5 mM AA. Peak at m/z = 79.00 represent MSM formation. j Schematic suggested mechanism for the production of Fe(IV) = O intermediate by Fe3O4 nanoparticles in the presence of H2O2 and AA and the catalytic process of hydroxylation of tyrosine to Dopa. a, b, di one representative data was shown from three independently repeated experiments. Source data are provided as a Source Data file.
Fig. 3
Fig. 3. Characterizations of artificial enzymes and their catalytic and fluorescence imaging performances.
a Schematic diagram of Apt-Fe3O4 catalysis. b, c Rates of hydroxylation of tyrosine to Dopa by Fe3O4, Apt-Fe3O4 and Ran-Fe3O4 in the presence of H2O2, AA and variable concentrations of tyrosine in aqueous solution (b) and in crowded solution (c). d Schematic diagram of strand displacement responsiveness and catalysis of FNA-Fe3O4. e PAGE analysis of the functional nucleic acids structure and the strand displacement reaction (red strand: tyrosine aptamer; green-yellow strand: block strand; blue strand: SNCA mRNA; green substrate: tyrosine). Gel was representative of n = 3 independent experiments. f, g Rates of hydroxylation of tyrosine to Dopa by FNA-Fe3O4 with or without mRNA in the presence of H2O2, AA and variable concentrations of tyrosine in aqueous solution (f) and in crowded solution (g). h The typical cyclic process of tyrosine capture and hydroxylation by 10 μg mL−1 artificial enzymes in the presence of 100 μM tyrosine, 5 mM H2O2 and 5 mM AA. i Catalytic selectivity of 10 μg mL−1 artificial enzymes for hydroxylation of 100 μM tyrosine and interference molecules in the presence of 5 mM H2O2 and 5 mM AA. b, c, f, g, h and i The results were expressed as mean ± SD (n = 3 independent experiments). b, c, f and g P-values were calculated by two-tailed t-test. Source data are provided as a Source Data file.
Fig. 4
Fig. 4. Cellular availability of the artificial enzymes.
a Schematic of FNA-Fe3O4 crossing the in vitro BBB model. b Transport efficiency of the artificial enzymes across the BBB in vitro. c Flow cytometry analysis of cellular uptake of the artificial enzymes. d Confocal fluorescence images of the gradual cellular internalization of FNA-Fe3O4 at different time interval. e, Cell viability of BV2 cells incubated with the artificial enzymes at different concentrations. b, e The results were expressed as mean ± SD (n = 3 biologically independent samples). b P-values were calculated by two-tailed t-test. c, d One representative data was shown from three independently repeated experiments. Source data are provided as a Source Data file.
Fig. 5
Fig. 5. Intracellular biological effects of the artificial enzymes.
a Schematic diagram of Cat-Fe3O4 Catalysis. b Schematic diagram of strand displacement of ASO-Fe3O4. c Artificial enzymes mediated changes in intracellular dopamine levels. d Dopa incubation induced dramatic fluctuations in intracellular dopamine levels. Arrows represent Dopa removal time point (adding fresh culture medium). e SNCA expression in diffierent treated SH-SY5Y cells. f, g Confocal imaging of normal cells (without EGFP fluorescence) and PD cells (express EGFP fluorescence) (f) and co-cultured cells by FNA-Fe3O4 (g). h Flow cytometry analysis corresponding to each panel in (f) and (g). c, d The results were expressed as mean ± SD (n = 3 biologically independent samples). c P-values were calculated by two-tailed t-test. e-h one representative data was shown from three independently repeated experiments. Source data are provided as a Source Data file.
Fig. 6
Fig. 6. In vivo biological effects of the artificial enzymes.
a In vivo fluorescence imaging of FNA-Fe3O4 in normal mice and PD mice. b, c Artificial enzymes mediated changes in Dopa levels (b) and dopamine levels (c) in mice striatal microdialysates (arrows represent dosing time point, each line represent one mouse). d Dopa administration induced dramatic fluctuations in dopamine levels in mice striatal microdialysates (dash line represents the mean dopamine level of normal mice in (c), each line represent one mouse). e Schematic timeline of microdialysis, injections and behavioral tests. f The expression of SNCA in the brain tissue of differently treated mice. g Descent time spent by the mice in the pole test. h Wire suspension time of the mice in the wire suspension test. i Step-through latency time of the mice in the step-through passive avoidance test. a, f One representative data was shown from three independently repeated experiments. bd each line represent one mouse, n = 3 biologically independent animals. gi The results were expressed as mean ± SD (n = 3 biologically independent animals), P-values were calculated by two-tailed t-test. Source data are provided as a Source Data file.

Comment in

References

    1. Bloem BR, Okun MS, Klein C. Parkinson’s disease. Lancet. 2021;397:2284–2303. doi: 10.1016/S0140-6736(21)00218-X. - DOI - PubMed
    1. Maiti P, Manna J, Dunbar GL. Current understanding of the molecular mechanisms in Parkinson’s disease: targets for potential treatments. Transl. Neurodegener. 2017;6:35. doi: 10.1186/s40035-017-0099-z. - DOI - PMC - PubMed
    1. Wu T, Hallett M. The cerebellum in Parkinson’s disease. Brain. 2013;136:696–709. doi: 10.1093/brain/aws360. - DOI - PMC - PubMed
    1. Klein MO, et al. Dopamine: functions, signaling, and association with neurological diseases. Cell. Mol. Neurobiol. 2019;39:31–59. doi: 10.1007/s10571-018-0632-3. - DOI - PMC - PubMed
    1. Cotzias GC, Papavasiliou PS, Gellene R. L-Dopa in Parkinson’s syndrome. New Engl. J. Med. 1969;281:272. doi: 10.1056/NEJM196907312810517. - DOI - PubMed

Publication types