. 2023 May 10;8(1):183.
doi: 10.1038/s41392-023-01401-y.

A ribosomal gene panel predicting a novel synthetic lethality in non-BRCAness tumors

Affiliations

A ribosomal gene panel predicting a novel synthetic lethality in non-BRCAness tumors

Chao Zhang et al. Signal Transduct Target Ther. .

Abstract

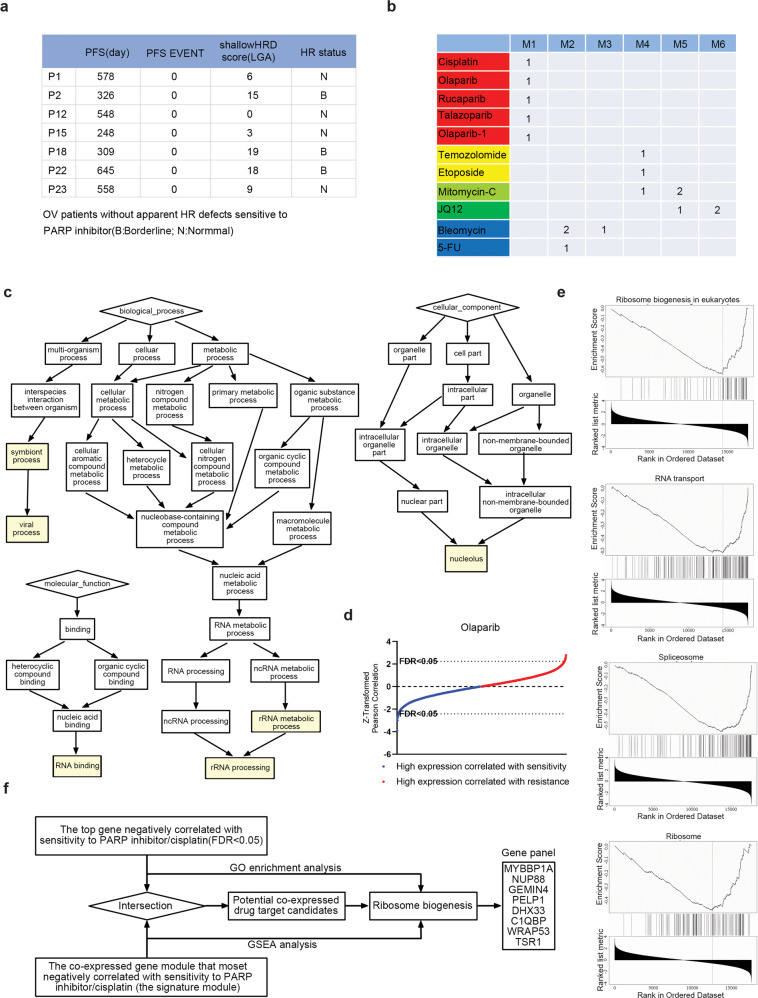
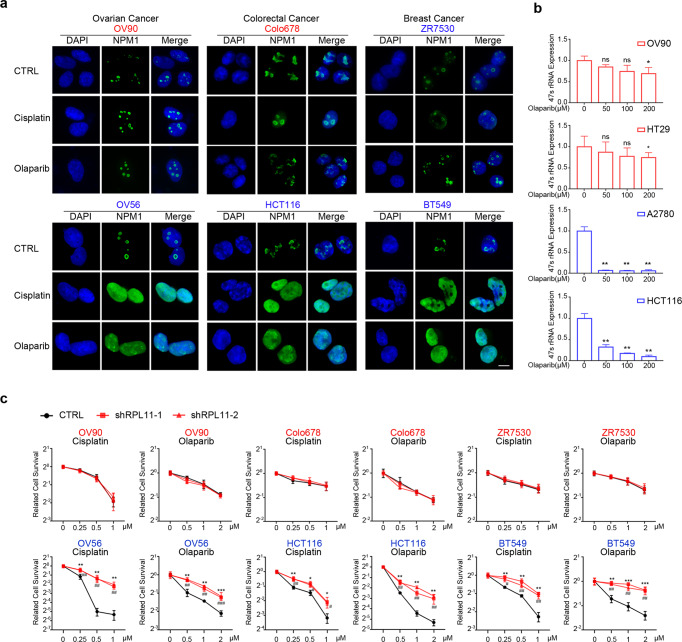
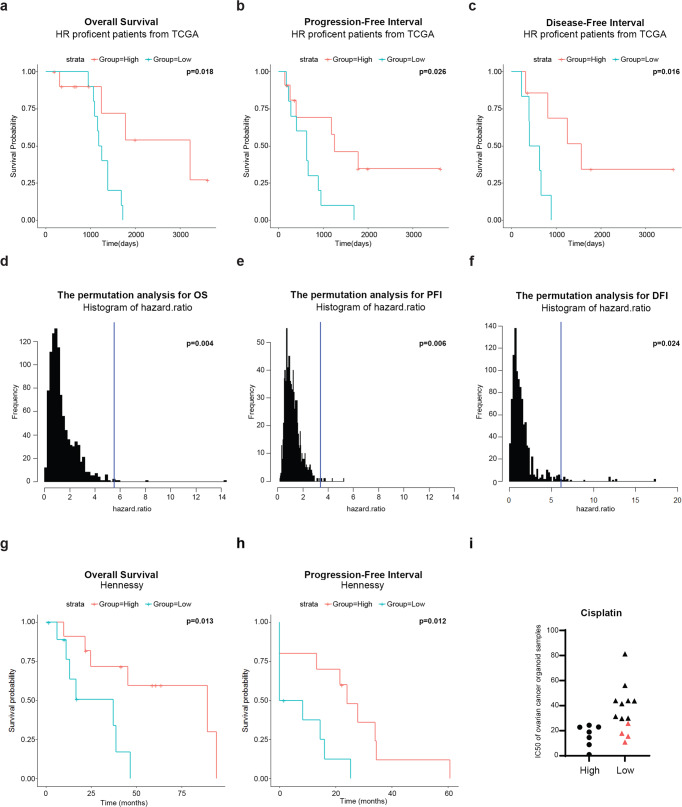
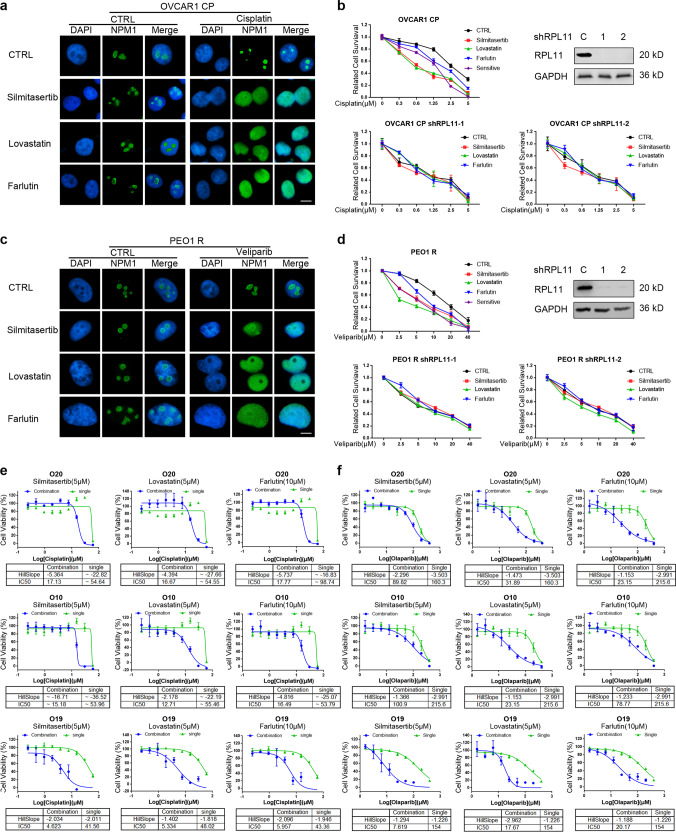
Poly (ADP-ribose) polymerase (PARP) inhibitors are one of the most exciting classes of targeted therapy agents for cancers with homologous recombination (HR) deficiency. However, many patients without apparent HR defects also respond well to PARP inhibitors/cisplatin. The biomarker responsible for this mechanism remains unclear. Here, we identified a set of ribosomal genes that predict response to PARP inhibitors/cisplatin in HR-proficient patients. PARP inhibitor/cisplatin selectively eliminates cells with high expression of the eight genes in the identified panel via DNA damage (ATM) signaling-induced pro-apoptotic ribosomal stress, which along with ATM signaling-induced pro-survival HR repair constitutes a new model to balance the cell fate in response to DNA damage. Therefore, the combined examination of the gene panel along with HR status would allow for more precise predictions of clinical response to PARP inhibitor/cisplatin. The gene panel as an independent biomarker was validated by multiple published clinical datasets, as well as by an ovarian cancer organoids library we established. More importantly, its predictive value was further verified in a cohort of PARP inhibitor-treated ovarian cancer patients with both RNA-seq and WGS data. Furthermore, we identified several marketed drugs capable of upregulating the expression of the genes in the panel without causing HR deficiency in PARP inhibitor/cisplatin-resistant cell lines. These drugs enhance PARP inhibitor/cisplatin sensitivity in both intrinsically resistant organoids and cell lines with acquired resistance. Together, our study identifies a marker gene panel for HR-proficient patients and reveals a broader application of PARP inhibitor/cisplatin in cancer therapy.


Conflict of interest statement

A patent is pending for J-S.Z., C.Z., and Q.G. Patent applicant: J-S.Z.; the name of inventors: Zhang Jin-San, Zhang Chao, Guo Qiang; application number: 2021102042329; status of application: under application; specific aspect of manuscript covered in patent application: the gene panel predicting patients’ response to PARP inhibitor and cisplatin.

Figures

Fig. 1
Fig. 1
A gene panel was constructed based on the pathway analysis that identified ribosome biogenesis pathway as a potential predictor of cell response to PARP inhibitor/cisplatin. a A cohort of 50 ovarian cancer patients without apparent HR defects were enrolled as detailed in Materials and Methods. They are platinum-sensitive relapsed patients who were subsequently treated with PARP inhibitor maintenance monotherapy. b Classification for multiple DNA-damaging agents from GDBC according to their corresponding signature modules derived from WGCNA analysis. Among these datasets, there are two datasets of olaparib with drug ID 1017 and 1495, which were generated at two research centers (Massachusetts General Hospital and Wellcome Sanger Institute), respectively. We defined the olaparib with drug ID 1495 to be olaparib-1. The yellow-green for Mitomycin-C indicates transitional species between the drugs highlighted in yellow and green. M1~M6 represents 6 signature modules that are most negatively correlated with sensitivities to these drugs. c The identified biological processes, molecular functions, and cellular components GO terms of the signature module of PARP inhibitor/cisplatin derived from WGCNA analysis. d Distribution of Z-scaled olaparib sensitivity–gene-expression Pearson correlation values of all analyzed genes. e The top four negative enrichment pathways for olaparib identified by GSEA analysis on the drug sensitivity–gene-expression correlations. f The workflow to construct the gene panel predicting drug response to PARP inhibitor/cisplatin. We took the intersection of genes involved in their drug signature module and the top genes negatively correlated with sensitivity to these drugs (FDR < 0.05), from which eight genes involved in ribosome biogenesis were selected according to the results of both GSEA and GO enrichment analysis
Fig. 2
Fig. 2
Cells showing high expression of genes in the panel were killed via DNA damage-induced ribosome biogenesis stress. a Indicated cells were treated with 50 μM of olaparib or cisplatin for 6 h (scale bar: 5 μm). The NPM1 localization was detected by immunofluorescence, and their nucleoli-restricted or diffused nuclear localization reflected the ribosomal stress level. The three cell lines shown in red were lowly expressed for the gene panel, whereas those in blue were the ones showing high expression for the gene panel. b Cells were treated with indicated concentrations of olaparib for 6 h, and the levels of 47 S pre-rRNA were determined by qRT-PCR to assess the extent of ribosomal stress. c The expression of RPL11 was knocked down with lentivirus-mediated shRNA expression to block the lethal effects of ribosomal stress in indicated cells, followed by colony-formation assay to determine their drug sensitivity to cisplatin or olaparib. *P < 0.05, **P < 0.01, ***P < 0.001, #P < 0.05, ##P < 0.01, ###P < 0.001, ns not significant (compared with CTRL)
Fig. 3
Fig. 3
ATM signaling balances the cell fate by simultaneously controlling both HR repair and ribosomal stress during PARP inhibitor/cisplatin treatment. a OV56 cells were pretreated with KU55933 (ATM inhibitor), VX970 (ATR inhibitor), or AZD7648 (DNA-PK inhibitor) for 1 h (scale bar: 5 μm). The localization of NPM1 was detected by immunofluorescence to indicate the ribosomal stress induced by cisplatin or olaparib. b, c OV56 cells were pretreated with indicated concentrations of KU55933 for 1 h (scale bar: 5 μm). The localization of NPM1 was detected to indicate the ribosomal stress level caused by cisplatin or olaparib. d, e OV90 cells (d) and OV56 cells (e) were pretreated with indicated concentrations of KU55933 for 1 h followed by ionizing radiation (2 Gy) to trigger DNA double-strand breaks. RAD51 foci were stained and quantified to determine the HR status. f, g OV90 cells (f) and OV56 cells (g) were pretreated with indicated concentrations of KU55933, colony-formation assay was performed to determine the drug sensitivity to cisplatin or olaparib. h Proposed model of cell fate in response to PARP inhibitor/cisplatin treatment. Red labels: cell lines with low expression of the gene panel; Blue labels: cell lines with high expression of the gene panel. *P < 0.05, **P < 0.01, (compared with CTRL)
Fig. 4
Fig. 4
The combined examination of gene panel and HR status effectively predicts clinical drug response of cisplatin. a The overall survival analysis via univariate Cox regression with the gene panel for cisplatin-treated HR-proficient patients from TCGA (hazard ratio = 5.54; 95% CI 1.16–26.43; P = 0.018; n = 21). b The progression-free interval analysis using the gene panel for cisplatin-treated HR-proficient patients from TCGA (hazard ratio = 3.412; 95% CI 1.104–10.55; P = 0.026; n = 21). Log-rank P value is displayed. c The disease-free interval analysis with the gene panel for cisplatin-treated HR-proficient patients from TCGA (hazard ratio = 6.143; 95% CI 1.176–32.08; P = 0.016; n = 13). Log-rank P value is displayed. df The permutation test (1000 times) to compare the performance of randomly selected gene lists with our gene panel to predict the overall survival (P = 0.004), progression-free interval (P = 0.006) and disease-free interval (P = 0.024) of cisplatin-treated patients with normal HR function. One-tailed test. g, h The overall survival (hazard ratio = 4.39; 95% CI 1.238–15.56; P = 0.013; n = 21) and progression-free survival analyses (hazard ratio = 3.815; 95% CI 1.216–11.97; P = 0.012; n = 20) via univariate Cox regression with the gene panel for cisplatin-treated patients from Hennessy cohort suggested that patients with high expression of the gene panel are responders to cisplatin. i The combined examination predicts the response of ovarian cancer organoid samples to cisplatin. The red color indicates samples with known HR defects
Fig. 5
Fig. 5
The combined examination of gene panel and HR status effectively predicts clinical drug response of PARP inhibitor. a The combined examination predicts the ex vivo response to PARP inhibitors in BRCA PDTX-derived tumor cells (PDTC) from BcaPE. bd The combined examination predicts the in vivo response to PARP inhibitors in breast PDX models from BcaPE in three independent validation. e The combined examination predicts the in vivo response to PARP inhibitor in ovarian PDX models. ae The values above the dot line represent predicted PDTX-derived tumor cells (PDTCs) or PDX models responsive to PARP inhibitor, while the values below the dot line represent predicted PDTCs or PDX models resistant to PARP inhibitor. Circular: sensitive PDTCs or PDX models; Triangle: resistant PDTCs or PDX models. The red color indicates misclassified PDTCs, blue color represents PDTCs or PDX models with drug-specific mechanism of resistance, and green color indicates the classification for PDTCs or PDX models that is corrected by HR status. f The combined examination predicts the real-world clinical outcomes in patients with platinum-sensitive relapsed ovarian cancer treated with PARP inhibitor maintenance monotherapy. f Circular: sensitive patients; Triangle: resistant patients. All patients were ranked from high to low according to their gene panel expression levels. The y axis values above the dot line (y = 0) represent the duration of progression-free survival of patients relapsed or died, while those below the dot line (y = 0) represent the duration of progression-free survival of patients without PFS events. The red color indicates patients profiled as HR proficiency, black color represents patients profiled as HR deficiency, gray color represents patients with unknown HR status, and blue color indicates patients with borderline HR function. g The combined examination predicts the response of ovarian cancer organoid samples to olaparib. The red color indicates samples with known HR defects
Fig. 6
Fig. 6
Three marketed drugs induced a novel type of synthetic lethality in samples resistant to PARP inhibitor/cisplatin. a, c Cisplatin-resistant OVCAR-1 CP (a) and veliparib-resistant PEO1 R (c) were pretreated with three indicated drugs for 24 h before treatment with veliparib or cisplatin for another 6 h (Scale bar: 5 μm). The localization of NPM1 was detected by immunofluorescence to indicate the ribosomal stress. b, d The expression of RPL11 was suppressed by lentivirus-mediated shRNA to block the lethal effects of ribosomal stress in OVCAR-1 CP (b) and PEO1 R (d). The efficient knockdown of RPL11 expression was confirmed by western blots analysis. The cells were pretreated with the three indicated drugs for 24 h. The parental sensitive OVCAR-1 or PEO1 were used as positive controls. Colony-formation assay was used to determine the drug sensitivity to cisplatin (b) or veliparib (d). e, f Cell viability assay was performed for cisplatin (e) or Olaparib (f) treated ovarian cancer organoids with/without pretreatment with the listed drugs

References

    1. Lord CJ, Ashworth A. PARP inhibitors: synthetic lethality in the clinic. Science. 2017;355:1152–1158. doi: 10.1126/science.aam7344. - DOI - PMC - PubMed
    1. Bryant HE, et al. Specific killing of BRCA2-deficient tumours with inhibitors of poly(ADP-ribose) polymerase. Nature. 2005;434:913–917. doi: 10.1038/nature03443. - DOI - PubMed
    1. Farmer H, et al. Targeting the DNA repair defect in BRCA mutant cells as a therapeutic strategy. Nature. 2005;434:917–921. doi: 10.1038/nature03445. - DOI - PubMed
    1. Bruno PM, et al. A subset of platinum-containing chemotherapeutic agents kills cells by inducing ribosome biogenesis stress. Nat. Med. 2017;23:461. doi: 10.1038/nm.4291. - DOI - PMC - PubMed
    1. Helleday T. The underlying mechanism for the PARP and BRCA synthetic lethality: clearing up the misunderstandings. Mol. Oncol. 2011;5:387–393. doi: 10.1016/j.molonc.2011.07.001. - DOI - PMC - PubMed

Publication types

Substances