. 2023 May 9;14(1):2656.
doi: 10.1038/s41467-023-38259-1.

Resveratrol intervention attenuates chylomicron secretion via repressing intestinal FXR-induced expression of scavenger receptor SR-B1

Affiliations

Resveratrol intervention attenuates chylomicron secretion via repressing intestinal FXR-induced expression of scavenger receptor SR-B1

Juan Pang et al. Nat Commun. .

Abstract

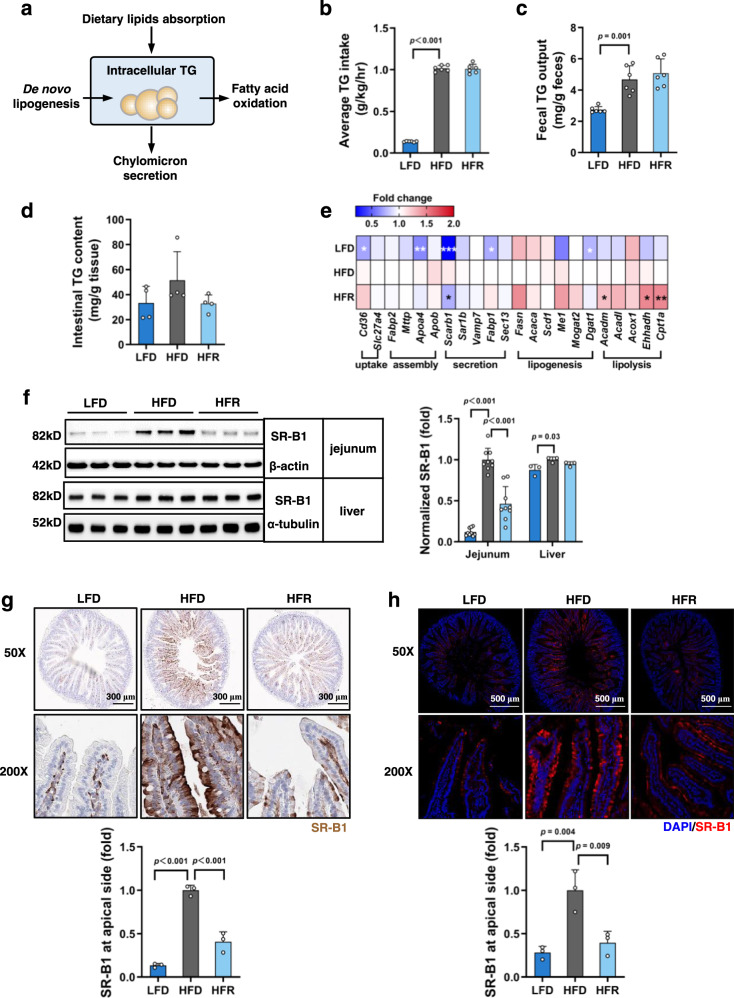
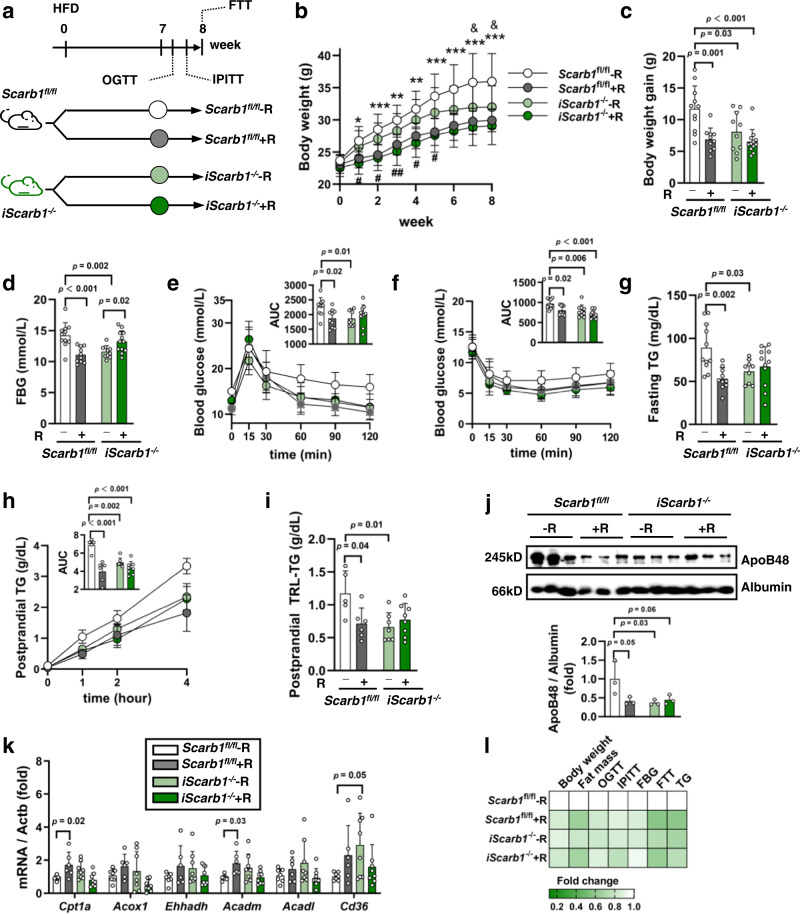
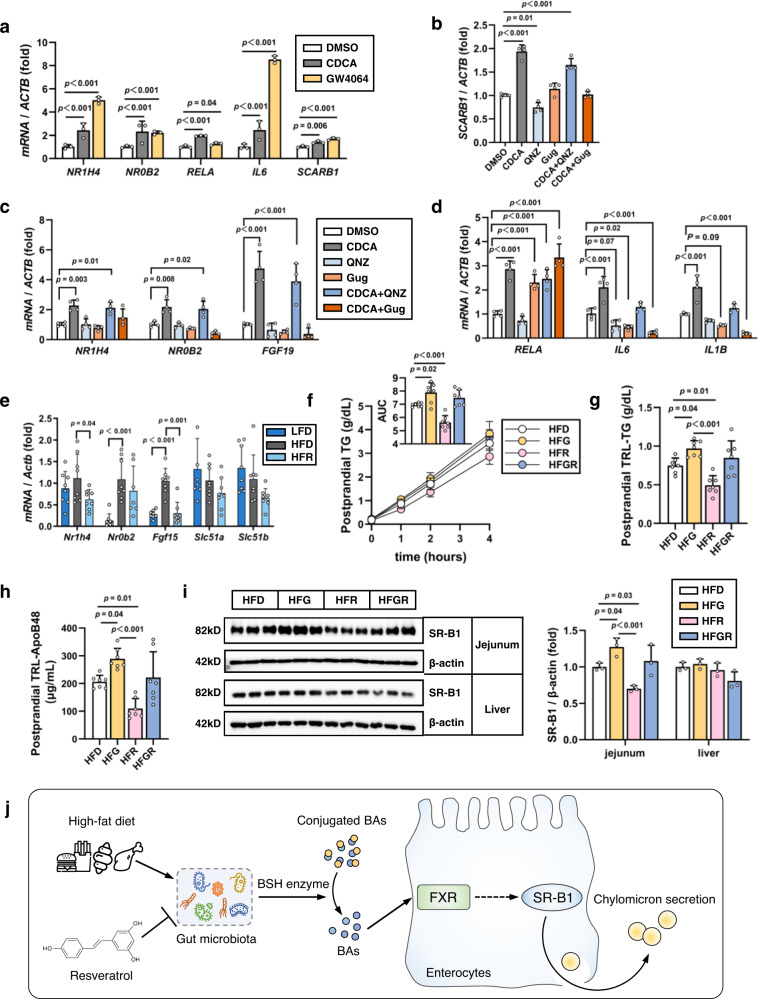
Two common features of dietary polyphenols have hampered our mechanistic understanding of their beneficial effects for decades: targeting multiple organs and extremely low bioavailability. We show here that resveratrol intervention (REV-I) in high-fat diet (HFD)-challenged male mice inhibits chylomicron secretion, associated with reduced expression of jejunal but not hepatic scavenger receptor class B type 1 (SR-B1). Intestinal mucosa-specific SR-B1-/- mice on HFD-challenge exhibit improved lipid homeostasis but show virtually no further response to REV-I. SR-B1 expression in Caco-2 cells cannot be repressed by pure resveratrol compound while fecal-microbiota transplantation from mice on REV-I suppresses jejunal SR-B1 in recipient mice. REV-I reduces fecal levels of bile acids and activity of fecal bile-salt hydrolase. In Caco-2 cells, chenodeoxycholic acid treatment stimulates both FXR and SR-B1. We conclude that gut microbiome is the primary target of REV-I, and REV-I improves lipid homeostasis at least partially via attenuating FXR-stimulated gut SR-B1 elevation.


Conflict of interest statement

The authors declare no competing interests.

Figures

Fig. 1
Fig. 1. REV-I for 8 weeks reduces chylomicron production in HFD-challenged mice.
a Diagram shows experimental procedures. Body weight change (b) and body weight gain (c) of mice after 8-week treatment; n = 13 for the LFD and HFD groups and n = 14 for the HFR group. Blood glucose level and area under the curve (AUC) during OGTT (d) and IPITT (e); n = 5. Fasting blood glucose (FBG) (f) (n = 13–14 as c), fasting blood insulin (FBI) (g) (n = 5), TG (h) (n = 13–14 as c), and non-esterified FA (NEFA) levels (i) (n = 4). j Postprandial TG levels during FTT; n = 4. k, l Postprandial plasma collected 4 h after olive oil gavage was ultracentrifuged for isolating TRL (mainly chylomicron). TG concentrations were then measured (k), while ApoB48 levels were assessed by Western blotting (l); n = 4. m Heatmap summarizes metabolic effects of REV-I presented in this figure (fold change of a given parameter vs. that in HFD-fed mice which is defined as 1-fold). Statistical significance was evaluated by two-sided one-way ANOVA with Dunnett’s post hoc test (compared with HFD group). See also Supplementary Fig. 1. Data are presented as mean ± SD. Source data are provided as a Source Data file.
Fig. 2
Fig. 2. REV-I reduces jejunal but not liver SR-B1.
a Diagram summarizes metabolic processes involved in intestinal lipid (TG) homeostasis. Average TG intake (b) and daily fecal TG loss (c) of mice individually housed in metabolic cages at the end of the 8th week; n = 6. d Jejunal intracellular TG contents; n = 4. e Heatmap shows the expression of genes involved in intestinal lipid metabolism among the three groups of mice (see statistical analysis results of qRT-PCR in Supplementary Table 4); n = 12. f Jejunal (n = 9) and hepatic (n = 3) SR-B1 levels were assessed by Western blotting. g Representative jejunum SR-B1 immunostaining images (brown), along with its quantitative scores at the apical membrane. The scale bar is 300 μm; n = 3. h Representative jejunum SR-B1 immunofluorescence staining images (red), along with its quantitative scores at the apical membrane. The scale bar is 500 μm; n = 3. Statistical significance was evaluated by two-sided one-way ANOVA with Dunnett’s post hoc test (compared with HFD group). *p < 0.05, **p < 0.01, ***p < 0.001. Data are presented as mean ± SD. Source data are provided as a Source Data file.
Fig. 3
Fig. 3. Intestinal mucosa-specific SR-B1 KO mice show lack of further response to REV-I.
a Diagram shows experimental procedures in Scarb1fl/fl and iScarb1−/− mice. Body weight (b) and body weight gain (c) at the end of the 8th week; n = 10 for the iScarb1−/− − R and Scarb1fl/fl + R groups, n = 11 for the Scarb1fl/fl − R group and n = 12 for the iScarb1−/− + R group. d Fasting blood glucose (FBG) levels at the end of the 8th week; n = 10–12 as (b, c). Blood glucose levels and AUC during OGTT (e) and IPITT (f), n = 10–12 as (b, c). g Fasting TG levels at the 8th week; n = 10–12 as (c). h Postprandial TG levels during FTT; n = 5 for the Scarb1fl/fl − R group, n = 6 for the Scarb1fl/fl + R group, n = 7 for the iScarb1−/− − R group and n = 8 for the iScarb1−/− + R group. i, j Postprandial plasma collected 4 h after olive oil gavage was ultracentrifuged for isolating TRL. TG concentrations were then measured (i), and ApoB48 levels were assessed (j) (albumin as loading control); n = 3. k Expression of Cd36 and other genes that are involved in FA β-oxidation; n = 5–8 as (h). l Heatmap summarizes metabolic effects of REV-I presented in this figure. A given parameter in Scarb1fl/fl control mice without REV-I is defined as one-fold. Statistical significance was evaluated by two-sided two-way ANOVA with Šidák post hoc test. For (b), *, **, or ***, Scarb1fl/fl + R vs. Scarb1fl/fl − R; # or ##, iScarb1−/− + R vs. iScarb1−/− − R; &, Scarb1fl/fl − R vs. iScarb1−/− − R. See also Supplementary Fig. 2. Data are presented as mean ± SD. Source data are provided as a Source Data file.
Fig. 4
Fig. 4. BLT-1 gavage generates no additive effect with REV-I.
a Diagram shows the experimental procedures in C57BL/6J mice treated with resveratrol (HFR), or BLT-1 (B), or both (HFR + B). Body weight (b) and body weight gain (c) from week 4–6; n = 5 for the LFD group, n = 6 for the HFD group, n = 7 for the HFR group and n = 8 for the HFD + B and HFR + B groups. Epididymal white adipose tissue (d), liver weight to body weight ratio (e), fasting glucose (f), and TG levels (g) at the end of the 6th week; n = 5–8 as (b, c). h Plasma TG levels during FTT; n = 4. i, j Postprandial plasma collected 4 h after olive oil gavage was ultracentrifuged for isolating TRL. TG concentrations were then measured (i), and ApoB48 levels were assessed by Western blotting (j); n = 3. Statistical significance was evaluated by two-sided one-way ANOVA with Dunnett’s post hoc test (compared with the HFD group). *p < 0.05, **p < 0.01, ***or ###p < 0.001. For (b), *, HFD vs. HFR; ###, LFD vs. HFD. Data are presented as mean ± SD. Source data are provided as a Source Data file.
Fig. 5
Fig. 5. REV-I represses jejunal SR-B1 involving reduced transcriptional activity of NF-κB-p65.
a Jejunum expression of SREBP-1 detected by Western blotting; n = 3. b Comparison of expression of Srebf1 (which encodes SREBP-1) and its target genes in jejunum; n = 8. c Location of the conserved NF-κB p65 binding motif within human, rat and mouse SCARB1/Scarb1 promoters and nucleotide primers utilized in ChIP and qChIP. d Detection of cytoplasmic and nucleus NF-κB-p65 by Western blotting in the jejunum of indicated groups of mice, presented in Fig. 1; n = 4. The blot of NF-κB-p65 was stripped to re-probe for Lamin A. e Heatmap shows the comparison of intestinal inflammatory genes that are known to be regulated by NF-κB in the jejunum; n = 8 (see statistical analysis results of qRT-PCR in Supplementary Table 5). f Western blotting shows the relative expression of inflammasome components in the jejunum. n = 3. The blot of Pro-caspase-1 was stripped and re-probed for β-actin. ChIP shows the binding of NF-κB or RNA Polymerase II to the mouse Scarb1 promoter (g) (n = 6) but not the intron region (h) (n = 3) in the jejunum. qChIP shows the comparison of binding of NF-κB (i) (n = 6) or RNA Polymerase II (j) (n = 3) to mouse Scarb1 promoter in the jejunum. Statistical significance was evaluated by two-sided one-way ANOVA with Dunnett’s post hoc test (compared with the HFD group). *p < 0.05, **p < 0.01, ***p < 0.001. Data are presented as mean ± SD. Source data are provided as a Source Data file.
Fig. 6
Fig. 6. The inhibitory effect of REV-I on SR-B1 involves gut microbiota.
a Diagram shows the design of the short-term FMT. Six-week-old male mice on LFD or HFD for 4 weeks were further divided randomly into three groups, receiving indicated FMT following PEG3350 treatment. b Blood glucose level and AUC during OGTT on day 7. c Basal body weight before FMT. d Body weight gain between day 0 and day 12. e Fasting TG level on day 12. f Postprandial TG level during FTT on day 12. g, h Postprandial plasma collected 4 h after olive oil gavage was ultracentrifuged to isolate TRL. TG concentrations were then measured (g), and ApoB48 levels were assessed by Western blotting (h). i Jejunal SR-B1 level. n = 4 for the LFD-HFD-FMT and HFD-HFD-FMT groups and n = 5 for the other groups in the above test. Statistical significance was evaluated by two-sided two-way ANOVA with Šidák post hoc test. *p < 0.05, **p < 0.01, ***p < 0.001. See also Supplementary Figs. 3 and 4. Data are presented as mean ± SD. Source data are provided as a Source Data file.
Fig. 7
Fig. 7. REV-I attenuates HFD-induced fecal CDCA elevation.
a, b Volcano plots show differential metabolites (determined by Log2FC and −Log10 p value) in designated FEs. CDCA and DCA were annotated in the plot for both panels; n = 5. LCA level is also reduced in HFR-FE and HRH-FE compared to HFD-FE but did not reach statistical significance. c Fecal total bile acid levels. d Fecal CDCA and DCA levels. HRH, heated feces from HFR mice. e Serum levels of unconjugated, taurine-conjugated, and total bile acids. f Serum levels of major unconjugated and taurine-conjugated bile acids in mice. g Expression levels of genes that encode enzymes involved in bile acid biosynthesis in the liver; n = 8. h The concentration of CDCA in the liver. i The activity of BSH in feces is defined by the production of d4-CDCA per mg protein per min. n = 5 for each test. Statistical significance was evaluated by two-sided one-way ANOVA with Dunnett’s post hoc test compared with the HFD group. See also Supplementary Figs. 6 and 7. Data are presented as mean ± SD. Source data are provided as a Source Data file.
Fig. 8
Fig. 8. CDCA and FXR agonist upregulate SR-B1 while FXR agonist administration blocks function of REV-I.
a Relative expression levels of NR1H4 (which encodes FXR), NR0B2 (which encodes SHP), SCARB1, RELA, and IL6 in Caco-2 cells treated with CDCA (200 µM), or GW4064 (25 µM) for 8 h; n = 3. bd The relative expression levels of SCARB1, NR1H4, NR0B2, FGF19, RELA, IL6 and IL1B in Caco-2 cells treated with CDCA, or indicated inhibitor, or CDCA plus indicated inhibitor for 24 h. QNZ, NF-κB inhibitor (100 nM); guggulsterone (Gug), FXR antagonist (20 µM); n = 4. e The relative expression level of genes in the FXR signaling pathway detected by qRT-PCR in jejunum of designated mouse groups; n = 8. f Postprandial TG levels and AUC during FTT in mice treated with HFD, HFR, HFD + GW4064 (HFG) or HFR + GW4064 (HFGR) for 6 weeks. g Postprandial TG levels in TRL. h Postprandial ApoB48 levels in TRL. i Jejunal SR-B1 level in designated mouse groups; n = 7 for above tests. j Diagram shows the effect of HFD challenge and REV-I on fecal bile acid level, involving bacterial produced BSH; as well as their effect on SR-B1 mediated chylomicron secretion, dependent on FXR. Statistical significance was evaluated by two-sided one-way ANOVA with Dunnett’s post hoc test compared with the DMSO group or HFD group. *p < 0.05, **p < 0.01, ***p < 0.001. Data are presented as mean ± SD. Source data are provided as a Source Data file.

References

    1. Li Y, et al. Hepatic SIRT1 attenuates hepatic steatosis and controls energy balance in mice by inducing fibroblast growth factor 21. Gastroenterology. 2014;146:539–549.e37. doi: 10.1053/j.gastro.2013.10.059. - DOI - PMC - PubMed
    1. Anhe FF, et al. A polyphenol-rich cranberry extract protects from diet-induced obesity, insulin resistance and intestinal inflammation in association with increased Akkermansia spp. population in the gut microbiota of mice. Gut. 2015;64:872–883. doi: 10.1136/gutjnl-2014-307142. - DOI - PubMed
    1. Cote CD, et al. Resveratrol activates duodenal Sirt1 to reverse insulin resistance in rats through a neuronal network. Nat. Med. 2015;21:498–505. doi: 10.1038/nm.3821. - DOI - PubMed
    1. Sung MM, et al. Improved glucose homeostasis in obese mice treated with resveratrol is associated with alterations in the gut microbiome. Diabetes. 2017;66:418–425. doi: 10.2337/db16-0680. - DOI - PubMed
    1. Zang M, et al. Polyphenols stimulate AMP-activated protein kinase, lower lipids, and inhibit accelerated atherosclerosis in diabetic LDL receptor-deficient mice. Diabetes. 2006;55:2180–2191. doi: 10.2337/db05-1188. - DOI - PubMed

Publication types