. 2023 May 9;9(1):35.
doi: 10.1038/s41523-023-00539-w.

Reversion of breast epithelial polarity alterations caused by obesity

Affiliations

Reversion of breast epithelial polarity alterations caused by obesity

Julia Holmes et al. NPJ Breast Cancer. .

Abstract

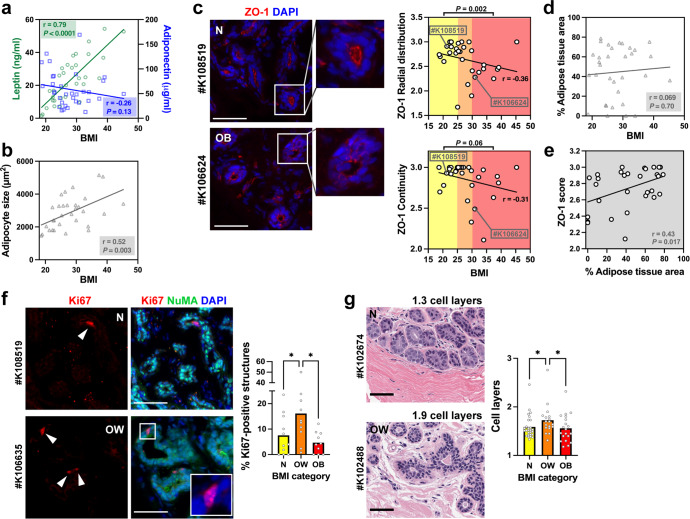
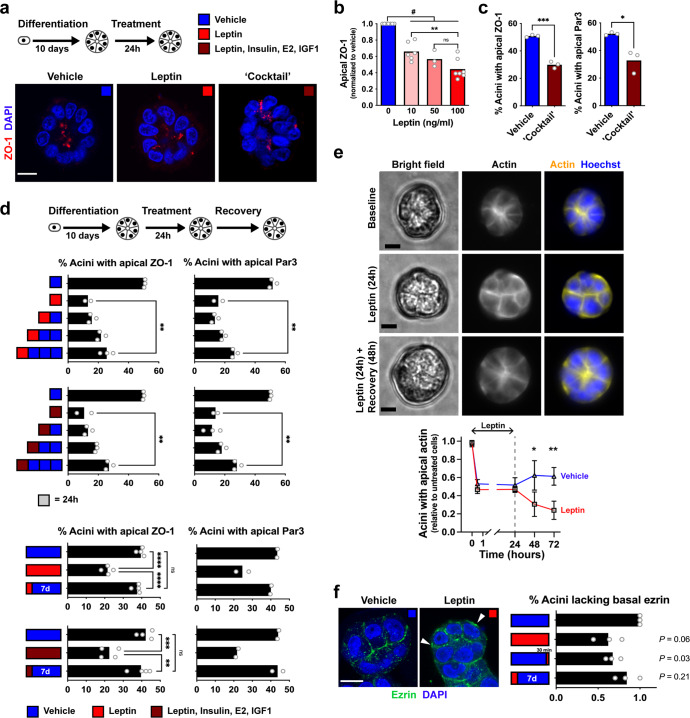
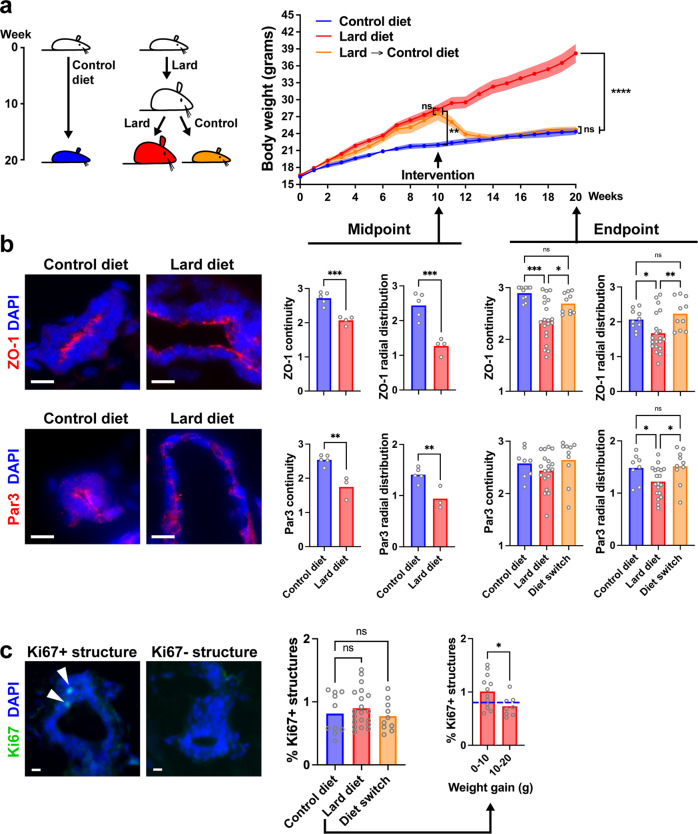
Molecular links between breast cancer risk factors and pro-oncogenic tissue alterations are poorly understood. The goal of this study was to characterize the impact of overweight and obesity on tissue markers of risk, using normal breast biopsies, a mouse model of diet-induced obesity, and cultured breast acini. Proliferation and alteration of epithelial polarity, both necessary for tumor initiation, were quantified by immunostaining. High BMI (>30) and elevated leptin were associated with compromised epithelial polarity whereas overweight was associated with a modest increase in proliferation in human and mice mammary glands. Human serum with unfavorable adipokine levels altered epithelial polarization of cultured acini, recapitulating the effect of leptin. Weight loss in mice led to metabolic improvements and restored epithelial polarity. In acini cultures, alteration of epithelial polarity was prevented by antioxidants and could be reverted by normalizing culture conditions. This study shows that obesity and/or dietary factors modulate tissue markers of risk. It provides a framework to set target values for metabolic improvements and to assess the efficacy of interventional studies aimed at reducing breast cancer risk.


Conflict of interest statement

The authors declare no competing interests.

Figures

Fig. 1
Fig. 1. Effect of the body mass index on epithelial polarity and proliferation in normal breast tissues.
a Leptin and adiponectin levels as a function of BMI in serum from women who donated breast tissue specimens to the Komen Tissue Bank. Spearman correlation coefficients (r) are indicated with corresponding P values. b Cross-sectional size of adipocytes in breast tissue sections from KTB donors. r, Pearson’s correlation coefficient. c ZO-1 radial distribution and continuity in breast tissue sections as a function of BMI. Microscopy images from two different donors are shown for illustration. Cell nuclei were stained with DAPI. Statistical comparisons (normal weight vs. obesity) with Mann Whitney test. d Relative proportion of adipose tissue as a function of BMI. r, Pearson’s coefficient. e ZO-1 score (average of continuity and radial distribution) as a function of the adipose content of the tissues. r, Pearson’s coefficient. f Quantification of epithelial structures (ducts, lobules) with ≥1 Ki67-positive cells according to BMI categories. Representative immunostaining images are shown, with arrowheads pointing to Ki67-positive nuclei. Antibodies against NuMA were used as staining control. *P < 0.05 (ANOVA and Fischer’s LSD test). g Average number of epithelial cell layers in breast epithelia from different BMI categories, assessed on H&E images. *P < 0.05 (Kruskal–Wallis and Dunn’s test). Averages are shown on bar graphs. Scale bars: 50 µm. N normal weight, OW overweight, OB obese. Each symbol on the graphs represents a KTB donors.
Fig. 2
Fig. 2. Epithelial polarity in breast acini treated with human serum.
a Schematic of the method used to assess epithelial polarity. The radial distribution of the TJ protein ZO-1 is summarized with the RP index. b ZO-1 RP as a function of the leptin/adiponectin ratio in serum samples from KTB donors. r, Pearson’s correlation coefficient. c ZO-1 RP in acini exposed to serum with low vs high (median) leptin/adiponectin ratio. Serum was pretreated or not with leptin-neutralizing antibodies. *P < 0.05 (unpaired t test); #P < 0.05 (paired t test); ns, not significant. Error bars represent SEM. d Schematic of the analysis of HELP-PD serum samples. e ZO-1 RP in acini exposed to serum from HELP-PD participants, taken at baseline (BS) or after one year of participation in the study. ****P < 0.0001; ns, not significant (ANOVA and Fischer’s LSD test). f ZO-1 RP values after classifying HELP-PD participants according to serum leptin levels. *P < 0.05 (unpaired t test). Symbols on the graphs correspond to the different serum samples.
Fig. 3
Fig. 3. Loss of epithelial polarity in an in vitro model of adipokine imbalance is reversible.
a Immunodetection of ZO-1 in differentiated HMT-3522 S1 acini exposed for 24 h to vehicle, leptin (100 ng/ml), or a ‘cocktail’ of adipokines, hormones, and growth factors (100 ng/ml leptin; 500 ng/ml insulin, i.e., twice the amount in H14 medium; 0.5 ng/ml β-estradiol (E2), i.e., five time the concentration in H14; and 0.1 µg/ml IGF-1). b Proportion of S1 acini with apical localization of ZO-1 after treatment with a range of leptin concentrations. **P < 0.005; ns, not significant (ANOVA and Tukey’s test); #P < 0.05 (one-sample t test). c Apical localization of ZO-1 and Par3 following the combination treatment. *P < 0.05; ***P < 0.0001 (unpaired t test). d Quantification of ZO-1 and Par3 localization in acini treated with leptin or with the combination treatment, then left to recover for 24 h, 48 h, or 72 h (top), or after a longer seven days recovery period (bottom). **P < 0.01; ***P < 0.001; ****P < 0.0001 (ANOVA and Tukey’s test). e Quantification of cortical actin in live S1 acini. Cells were stained with Sir-Actin and the Hoechst nuclear stain, treated with leptin (100 ng/ml) or vehicle for 24 h, and imaged over a 72 h time period. Apical cortical actin is quantified in the graph. *P < 0.05; **P < 0.01 (unpaired t test). Representative images are shown. f Ezrin immunostaining of S1 acini treated with vehicle or leptin (100 ng/ml). The graph represents the proportion of structures with ezrin mislocalization at the basal domain (arrowheads) upon chronic (8 days) or acute (30 min) leptin exposure, or after leptin treatment (24 h) followed by seven days of recovery. Data are expressed relative to control. Statistics using one-sample t test. Scale bars: 10 µm. Symbols on the graphs represent independent experiments.
Fig. 4
Fig. 4. Reversion of epithelial polarity loss in mice with diet-induced obesity.
a Body weight of C57BL/6 mice fed a control or obesity-inducing (lard) diet. The intervention group was switched from lard to control diet at the midpoint of the study, as illustrated in the schematic. ****P < 0.0001; **P = 0.001; ns, not significant (2-way ANOVA and Bonferroni’s test). b Detection of apical polarity markers ZO-1 and Par3 by immunofluorescence in mammary glands. Apical marker localization at the experiment midpoint and endpoint is quantified in the graphs. Representative confocal images are shown. *P < 0.05; **P < 0.01; ***P < 0.001; ns, not significant (unpaired t test for midpoint and ANOVA and Fischer’s LSD test for endpoint). c Proliferation status of mammary epithelial cells assessed by Ki67 staining. Representative images of positive and negative structures are shown. Ns, not significant (ANOVA and Fischer’s LSD test). The graph on the right categorizes animals on the lard diet according to weight gain at endpoint. *P < 0.05 (unpaired t test). Scale bars: 10 µm. The symbols on the graphs represent individual mice.
Fig. 5
Fig. 5. Redox control of tight junctions.
a Quantification of reactive oxygen species with the DCF ROS sensor in acini after 30 min exposure to leptin (100 ng/ml) and/or elevated β-estradiol levels (E2; 0.5 ng/ml). *P < 0.05 (Kruskal–Wallis and Dunn’s test). b Proportion of S1 acini with apical localization of ZO-1 in acini treated as in a. **P < 0.01 (ANOVA and Tukey’s test). c Apical ZO-1 localization in acini after 30 min treatment with hydrogen peroxide (100 µM) or glucose oxidase (GO; 10 mU/ml), in the absence or presence of leptin. ***P < 0.001 (ANOVA and Tukey’s test). d Apical ZO-1 localization in acini treated with vehicle or leptin and with different amounts of glutathione (GSH). **P < 0.01; ***P < 0.001; ****P < 0.0001 (ANOVA and Tukey’s test). Symbols on the graphs correspond to independent experiments.

References

    1. Lima SM, Kehm RD, Terry MB. Global breast cancer incidence and mortality trends by region, age-groups, and fertility patterns. EClinicalMedicine. 2021;38:100985. doi: 10.1016/j.eclinm.2021.100985. - DOI - PMC - PubMed
    1. Colditz GA, Bohlke K. Preventing breast cancer now by acting on what we already know. NPJ Breast Cancer. 2015;1:15009. doi: 10.1038/npjbcancer.2015.9. - DOI - PMC - PubMed
    1. Schwartz GF, et al. Proceedings of the international consensus conference on breast cancer risk, genetics, & risk management, April, 2007. Cancer. 2008;113:2627–2637. doi: 10.1002/cncr.23903. - DOI - PubMed
    1. Cecchini RS, et al. Body mass index and the risk for developing invasive breast cancer among high-risk women in NSABP P-1 and STAR breast cancer prevention trials. Cancer Prev. Res. 2012;5:583–592. doi: 10.1158/1940-6207.CAPR-11-0482. - DOI - PMC - PubMed
    1. Schairer C, et al. Quantifying the role of circulating unconjugated estradiol in mediating the body mass index-breast cancer association. Cancer Epidemiol. Biomarkers Prev. 2016;25:105–113. doi: 10.1158/1055-9965.EPI-15-0687. - DOI - PMC - PubMed