. 2023 May 9;14(1):2402.
doi: 10.1038/s41467-023-37947-2.

Molecular mechanisms of tubulogenesis revealed in the sea star hydro-vascular organ

Affiliations

Molecular mechanisms of tubulogenesis revealed in the sea star hydro-vascular organ

Margherita Perillo et al. Nat Commun. .

Abstract

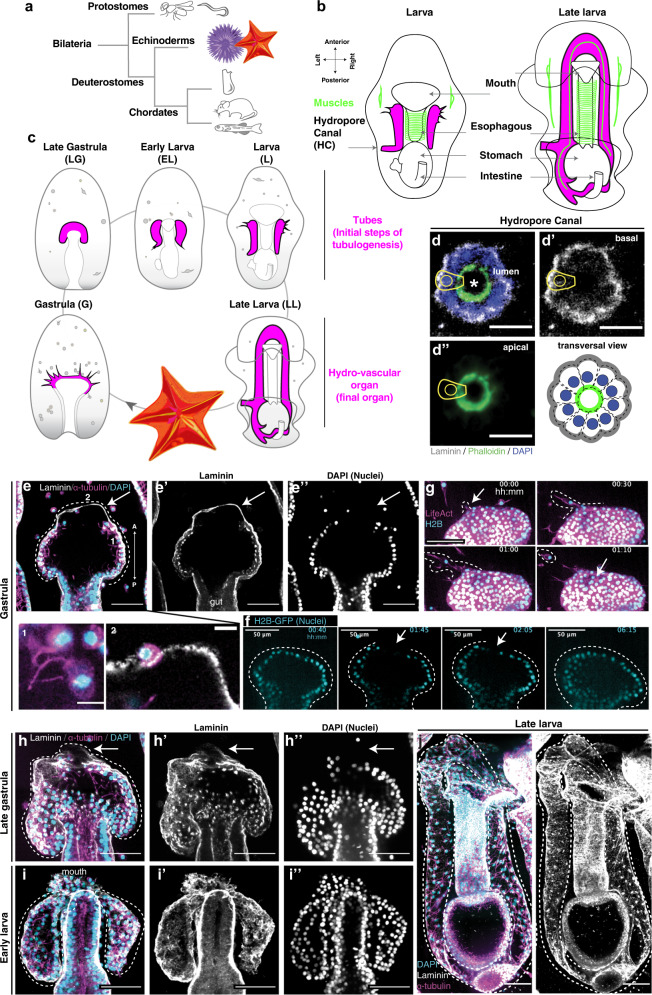
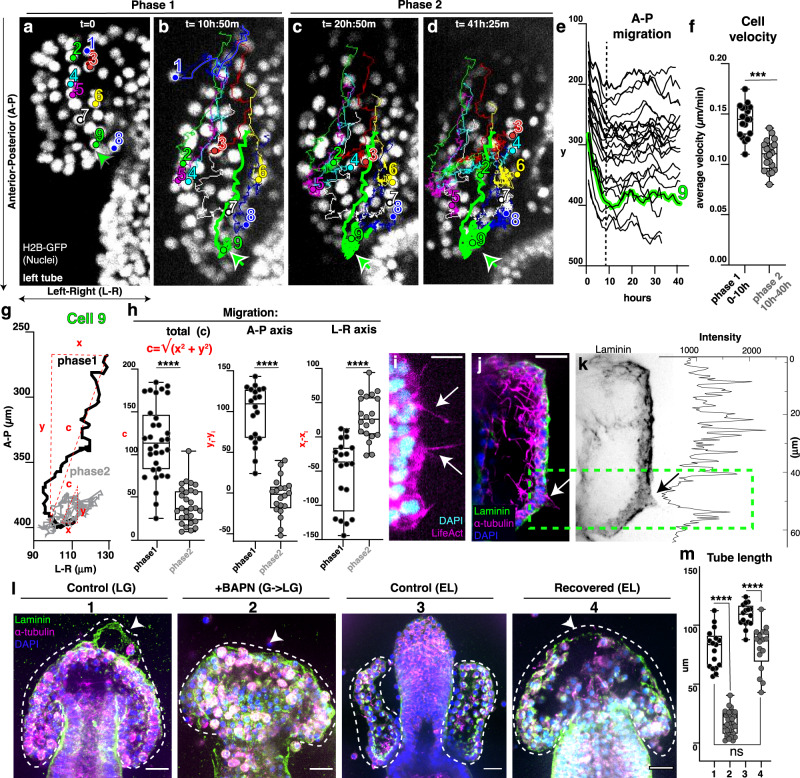
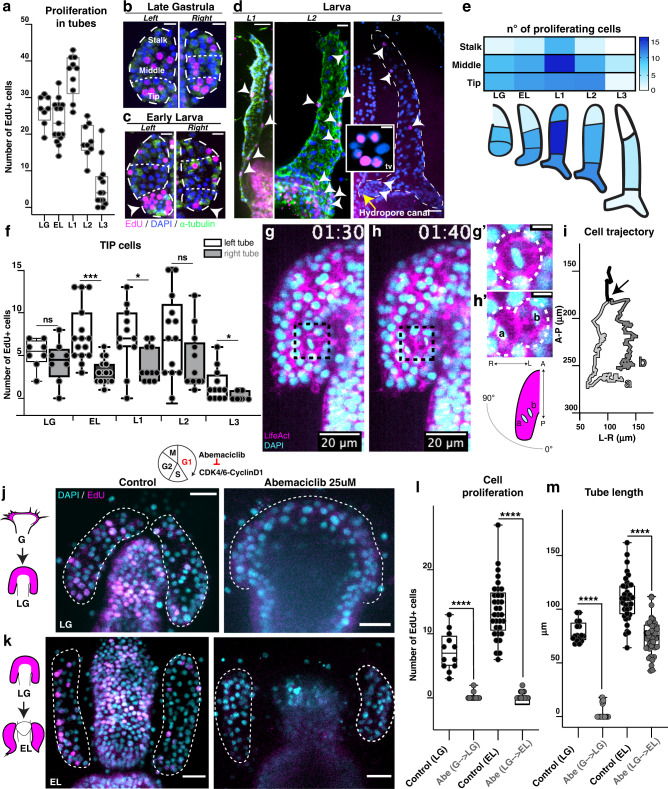
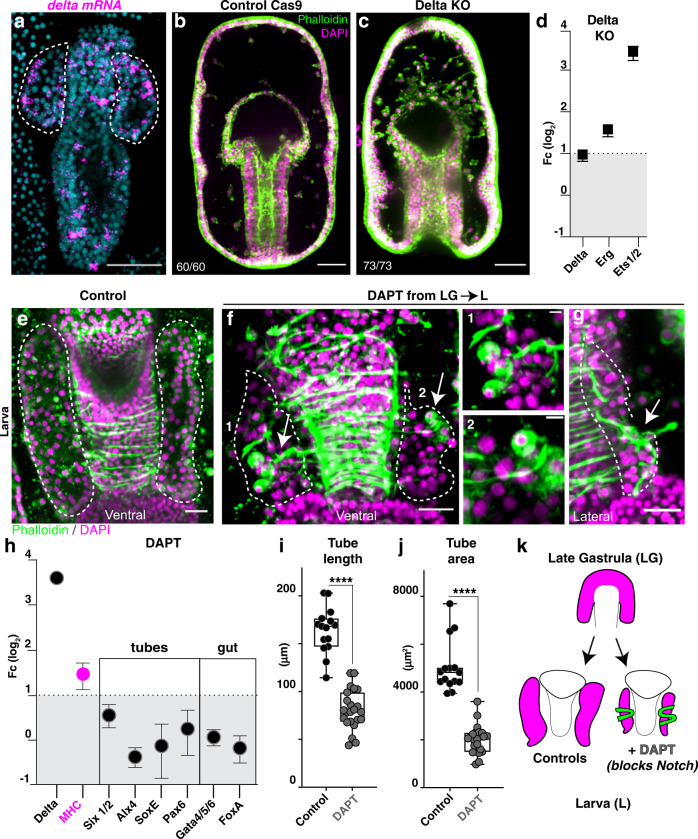
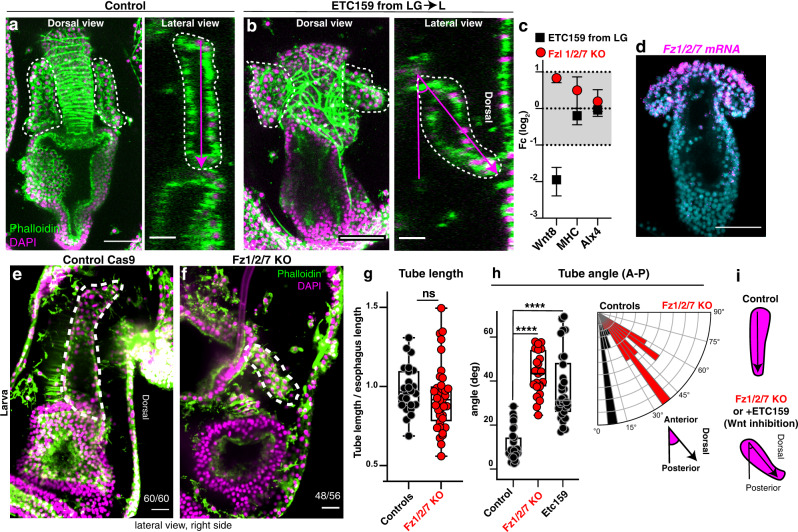
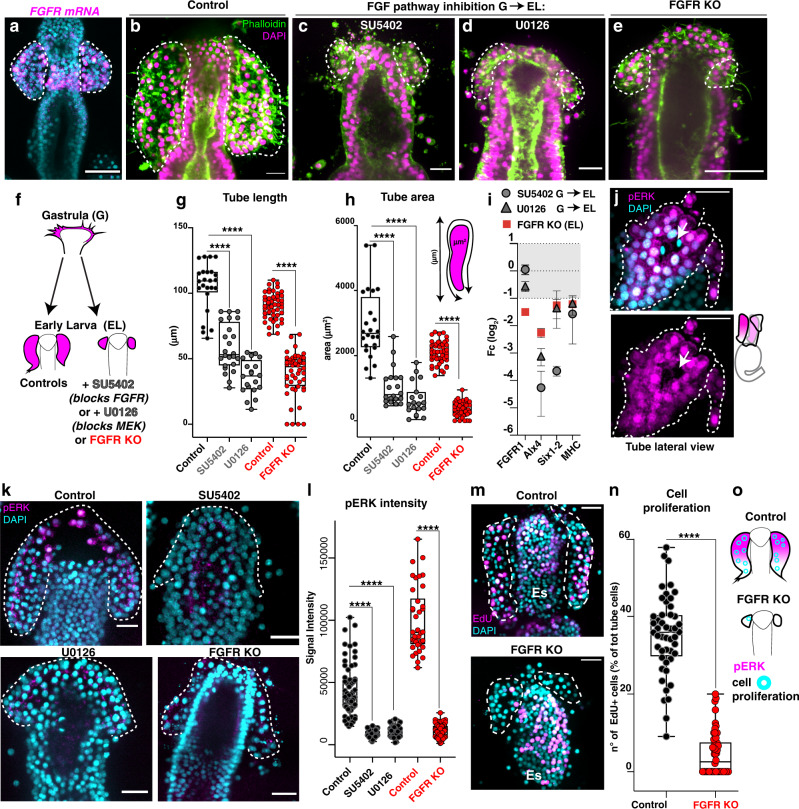
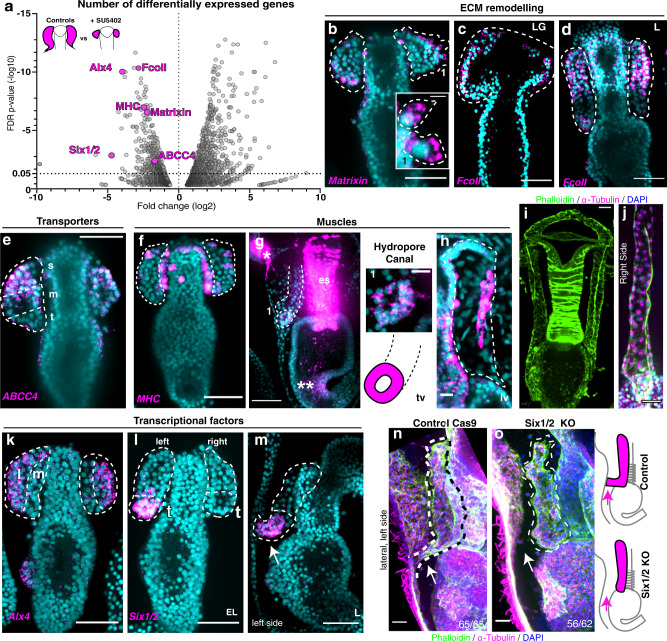
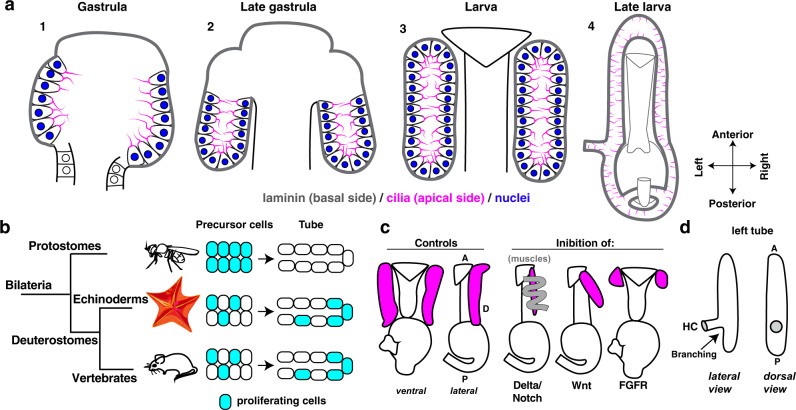
A fundamental goal in the organogenesis field is to understand how cells organize into tubular shapes. Toward this aim, we have established the hydro-vascular organ in the sea star Patiria miniata as a model for tubulogenesis. In this animal, bilateral tubes grow out from the tip of the developing gut, and precisely extend to specific sites in the larva. This growth involves cell migration coupled with mitosis in distinct zones. Cell proliferation requires FGF signaling, whereas the three-dimensional orientation of the organ depends on Wnt signaling. Specification and maintenance of tube cell fate requires Delta/Notch signaling. Moreover, we identify target genes of the FGF pathway that contribute to tube morphology, revealing molecular mechanisms for tube outgrowth. Finally, we report that FGF activates the Six1/2 transcription factor, which serves as an evolutionarily ancient regulator of branching morphogenesis. This study uncovers distinct mechanisms of tubulogenesis in vivo and we propose that cellular dynamics in the sea star hydro-vascular organ represents a key comparison for understanding the evolution of vertebrate organs.


Conflict of interest statement

Synthego provided free samples of FGFR gRNAs. Other gRNAs and all other products used in this study were purchased at market value. The authors declare no other competing interests.

Figures

Fig. 1
Fig. 1. Development of the sea star larva hydro-vascular organ.
a Phylogenetic relationships of the main bilaterian groups. b Summary of sea star larval development with a focus on the hydro-vascular organ (in magenta). The hydro-vascular organ comes from mesodermal precursors located at the tip of the growing gut in gastrula (G). Tubulogenesis starts in the late gastrula (LG), continues in the early larva (EL) and larval stages (L1 to L3). In larval stages, the initial tubes that form the organ elongate posteriorly. The left tube forms the hydropore canal, an opening toward the outside environment. The organ is fully grown in late larva (LL), when the left and right tubes merge to form the closed system of the hydro-vascular organ. c Summary of the main larval tissues and organs. dd” Transversal view of the tube trough the hydropore canal showing that the epithelium is polarized with actin on the apical side of the cells (facing the lumen) and laminin on the cell basal side. Dotted lines indicate the polarity of a single tube cell. Scale bars 10 μm. ee’ Laminin staining showing the basal lamina protrusion (arrow) in gastrulae. Alpha tubulin marks cilia in the tube lumen (Insert 1); a cell in between the basal lamina (insert 2, a different z-stack of Fig. 1 E). f Single stacks from a time lapse showing regions of the anterior-end of the growing tubes lacking cells (arrows). g Single frames from Supplementary Movie 3 showing a cell extending actin-rich protrusions and leaving the epithelium. hh” Laminin protrusions still present at late gastrula (arrows). i, j At larval stages tubes are completely separated from the gut and the laminin layer is continuous. All experiments were independently repeated at least 3 times with similar results. d: scale bar 10 μm; e, gj: scale bars 50 μm. A anterior, P posterior.
Fig. 2
Fig. 2. Tube extension and expansion involve active cell migration.
ad Time lapse images of the tubes expressing H2B-GFP to track movements of single nuclei (Supplementary Movie 6). Tracked cells are labeled with unique colors/numbers to visualize trajectories. In 2D projections, cell movements are recorded along the A-P axis (advancing direction) and the L-R axis. Note that in A and B, cell 1 has undergone an epithelial to mesenchymal transition (EMT) and migrates into the blastocoel, away from the elongating tube. e Cell migration along the A-P axis of the embryo (the y axis of the movie) over time. Cell 9 from is highlighted in green to show the two phases of migration. Graph includes cell trajectories of both tubes for 2 independent movies, (Supplementary Movie 5–8; n = 30 cells). f Average cell velocity for phase 1 and 2 for 2 independent movies. n = 19 (phase 1) and 20 (phase 2); ***p = 0.0008. g The trajectory of Cell 9 exemplifies cell movement along A-P and L-R axes. c represents the total cell displacement and is calculated as shown. h Maximum cell displacement happens in phase 1 and occurs along the A-P axis. In phase 2, cell displacement happens along the L-R axis. Track data for n = 50 cells from two independent movies. i Image from Supplementary Movie 9 showing actin-rich filopodia from tube cells (arrows), sb = 10 μm. j, k Cell protrusion marked by tubulin extend out from a gap in the basal lamina (arrows and green dotted box); sb = 10 μm. Graph indicates intensity of laminin antibody staining to highlight that where the cell protrusion extends out there is a drop in laminin signal intensity. l Pharmacological approach to block ECM remodeling inhibits tube extension; sb = 20 μm. m Tube length quantification in BAPN treatments. n = number of larvae is 17 (1); 34 (2); 16 (3); 17 (4). For all graphs, statistical significance was assessed by a two- sided Student’s t-test (****p < 0.0001; ns not significant). In box plots the median is the middle line, box represents 25th and 75th percentiles, whiskers indicate the minimum and maximum data range. Data are presented as mean values +/− SEM. Source data are provided as a Source Data file.
Fig. 3
Fig. 3. Cell division during tube outgrowth.
a EdU pulse experiments measure frequency of cell proliferation during tubulogenesis from tube outgrowth to larva stages (as defined in Supplementary Fig.1). Number of total larvae analyzed n = 60. bd EdU staining (magenta) in the three tube areas: stalk, middle and tip cells. Arrowheads in (c) and (d) indicate nuclei with incorporated EdU. Insert in (d) shows a transverse view (tv) of the hydropore canal from another specimen with nuclei stained with EdU. Scale bars 10 μm (b, c), 20 μm (d), 5 μm (insert). e Heatmap showing frequency of cell proliferation (white is zero, dark blue is max). f Frequency of cell proliferation in the tip cells for left and right tubes. n = 60 total number of larvae. Two-sided Student’s t-test: EL (***p-value = 0.0002), L1 (*p-value = 0.0260), L3 (*p-value = 0.0409). g, h Examples of a dividing cells from Supplementary Movie 10; magnification of a mitotic cell (g’) and the same cell undergoing cytokinesis (h’); sb = 5 μm. i Trajectory of a cell that divides, taken from Supplementary Movie 10. Arrow indicates the mitotic event, where a and b are the two daughter cells. j, k EdU staining in larvae treated with Abemaciclib to arrest cells in G1 from gastrula to late gastrula (during tube outgrowth) or from late gastrula to early larva (during tube elongation). Dotted lines indicate the tubes. Scale bar 20 μm. l EdU incorporation in presence of Abemaciclib to test inhibition of cell cycle and (m) effects on tube outgrowth and elongation. Number of larvae n = 16 (control LG); 32 (Abe G- > LG); 36 (control EL); 43 (Abe LG- > EL). LG (late gastrula); EL (early larva); L1 (larva stage 1); L2 (larva stage 2); L3 (larva stage 3). Statistical significance was assessed by a two- sided Student’s t-test (****p < 0.0001; ns not significant). In box plots the median is the middle line, box represents 25th and 75th percentiles, whiskers indicate the minimum and maximum data range. Source data are provided as a Source Data file.
Fig. 4
Fig. 4. Delta-Notch signaling represses a muscle phenotype in the tubes.
a Fluorescent in situ hybridization (FISH) shows Delta gene expression in scattered cells of the gut and the tubes (highlighted by dotted lines). b, c Delta knock out embryos fail to form the epithelial tubes that instead become excess mesenchymal cells. Penetrance of the Delta KO phenotype was 100% and all embryos died at the late gastrula stage; for genomic mutation see Supplementary Fig.12. d qPCR showing increase of mesodermal markers Erg, Ets1/2 and Pax6 in delta KO embryos. Bars represent mean with standard error of the mean (SEM). eg Larvae stained with phalloidin to mark muscles; Delta-Notch inhibition leads to smaller tubes constricted by muscle fibers that wrap around the tubes (arrows indicate muscles, magnification in inserts 1 and 2) and the foreguts. Arrows in g show that tube cells become muscle-like. Note that the control tubes are as long as the esophagus, while in treated embryos the tubes are shorter than the esophagus. h The increase in muscle-like cells is also reflected by increase in expression of the muscle marker MHC, while other known marker genes for tubes and the digestive system do not change. Bars represent mean with standard error of the mean (SEM). n = 3 biologically independent experiments. i, j Tubes are significantly smaller in DAPT treated than control embryos. Control: n = 15 larvae; DAPT treated n = 23 larvae. k Cartoon summarizing the result of Notch inhibition. All experiments are representative of 3 biological replicates. a, b, c, f, g scale bar = 50 μm. h scale bar is 10 μm. Statistical significance was assessed by a two- sided Student’s t-test (****p < 0.0001). In box plots the median is the middle line, box represents 25th and 75th percentiles, whiskers indicate the minimum and maximum data range. Source data are provided as a Source Data file.
Fig. 5
Fig. 5. Wnt signaling directs tube orientation through the Fzd1/2/7 receptor.
a, b Wnt inhibition with ETC159 from late gastrula to L2 caused a change in orientation of the tube outgrowth from anterior-posterior to anterior-dorsal. Confocal z-stacks are dorsal views and lateral views obtained from orthogonal projections of the same larvae. c qPCR shows Wnt8 gene expression decreases when ETC159 (that block secretion of Wnts) is used. Bars represent mean with standard error of the mean (SEM). n = 3 biologically independent experiments. d FISH showing that the Wnt receptor Fzd1/2/7 is expressed in the tube cells in early larvae. e, f In control larvae tubes grow parallel to the anterior-posterior axis, while in Fzd1/2/7 knock out larvae the tubes grow towards the dorsal side and recapitulate the same tube orientation defects seen with ETC159 treatment. Percentage of the larvae showing the Fz1/2/7 KO phenotype was 86%; for genomic mutation see Supplementary Fig.13. g Tube length measured as a ratio of tube length/esophagus length; n = 24 larvae for controls, n = 36 larvae for Fz1/2/7 KO. h Tube orientation measured as the angle that the tube makes with respect to the anterior-posterior axis of the larva. Number of tubes measured is n = 30 for controls, n = 30 for ETC159 treated and n = 23 for Fzd1/2/7 KO. Same data shown as a rose plot to indicate difference in orientation. i Schematic summarizes the observed phenotypes. All experiments are representative of 3 biological replicates. a, b, df scale bar is 50 μm. a and b lateral views are 20 μm. Statistical significance was assessed by a two-sided Student’s t-test (****p < 0.0001; ns = not significant). In box plots the median is the middle line, box represents 25th and 75th percentiles, whiskers indicate the minimum and maximum data range. Source data are provided as a Source Data file.
Fig. 6
Fig. 6. FGF signaling promotes tube outgrowth through pERK.
a FISH of FGFR shows expression in scattered cells. b Control and early larva treated with the FGFR inhibitor SU5402 (30μM) (c) or with the MEK inhibitor U0126 (10μm) (d) from the end of gastrulation to early larvae (G→EL). e Early larvae in which the FGFR is knocked out by Cas9 lack the tubes. Percentage of the FGFR KO larvae showing the phenotype was 96%; for genomic mutation see Supplementary Fig.14. f Cartoon summarizing FGFR inhibition phenotypes. g, h Tube length and area are significantly decreased in larvae where the FGF pathway was blocked. n = number of tubes (controls = 26, SU5402 = 26; U0126 = 20, CAS9 control = 48; FGFR KO = 50). i qPCR of significant genes in larvae where tube outgrowth was prevented. Bars represent mean with standard error of the mean (SEM). n = 3 biologically independent experiments. j Immunofluorescence showing that active ERK is localized in the nuclei of most tube cells. Arrows indicate dividing cells without pERK staining. k pERK staining is absent when FGF signaling is blocked. l Signal intensity of pERK in the above experiments. The Y axis in the graph shows the raw integrated intensity for pERK normalized by the background signal for each image. m EdU staining to mark proliferating cells and signal quantification (n). Since the tubes of the FGFR KO larvae had fewer cells than controls, we assessed proliferation rate by counting the EdU+ cells normalized to the total number of tube cells; n = 48 larvae (controls), n = 50 larvae (FGFR KO). o Schematic showing that inhibition of the FGF pathway at different levels prevents tube growth and pERK activation. White dotted lines outline the tubes. Es esophagus. Scale bar = 50 μm (a, e); scale bar = 20 μm (bd, j, k, m). Statistical significance was assessed by a two- sided Student’s t-test (****p < 0.0001; ns not significant). In box plots the median is the middle line, box represents 25th and 75th percentiles, whiskers indicate the minimum and maximum data range. Source data are provided as a Source Data file.
Fig. 7
Fig. 7. Differential RNA-seq reveals genes responsive to FGF signaling.
a Volcano plot of differentially expressed genes between controls and larvae where FGFR was blocked. Using the Wald test, p-values, false discovery rate (FDR) and fold changes were generated. Gene/Transcripts with p value < 0.05 were called as differentially expressed genes/transcripts for the comparison. b, c FISH for genes involved in extracellular matrix (ECM) remodeling, matrixin (b), and Fcoll (c, d). Insert 1 in (b) shows matrixin transcripts in cells extending protrusions. e FISH for the transporter ABCC4 shows expression in tube stalk cells. fh FISH showing myosin heavy chain (MHC) gene expression in the hydropore canal (1), the pyloric sphincter (** in g), the tube longitudinal muscle (h), the dorsal muscles (* in g) and the esophageal muscles (es in g). i, j Longitudinal muscles are localized on the tube ventral side. k–m FISH for Alx4 and Six1/2. Six1/2 is expressed at the tip of the left tube and later in the hydropore canal (arrow in m). n, o Six1/2 KO did not form the hydropore canal (arrow). Percentage of the Six1/2 KO phenotype was 90%; for genomic mutation see Supplementary Fig.15. All images are maximum projections of confocal z-stacks. All experiments were independently repeated at least 3 times with similar results. FDR false discovery rate, s stalk, m medial, t tip, tv transverse view, lv lateral view. scale bar = 50 μm (bg, ko); scale bar = 20 μm (i, j); scale bar = 10 μm (h). Source data are provided as a Source Data file.
Fig. 8
Fig. 8. Summary of the intrinsic and extrinsic factors that guide tubulogenesis of the hydro-vascular organ.
a Stages of sea star hydro-vascular organ development. The precursor cells of the hydro-vascular organ come from mesodermal progenitors at the tip of the growing gut (1). In the first stage of tubulogenesis, pre-polarized cells form a lumen and grow towards the posterior side of the embryo to form two tubes (2). During embryogenesis, left and right tubes detach from the esophagus (3) and finally form a close system where the left and right tube connect anteriorly and posteriorly, the hydro-vascular organ. b Phylogenetic tree showing the relationship of the in vivo systems for the study of tubulogenesis. In protostomes tubular organs form by a first step of cell proliferation followed by morphogenesis. In echinoderms and in vertebrates (both deuterostomes) cell proliferation is continuously coupled with cell migration during morphogenesis. c Cartoon summarizing the role of signaling pathways on tube formation. d Cartoon showing the branch formed by the left tube, the HC (hydropore canal) that opens on the outside environment. A anterior, P posterior, D dorsal.

Similar articles

Cited by

References

    1. Iruela-Arispe ML, Beitel GJ. Tubulogenesis. Development. 2013;140:2851–2855. doi: 10.1242/dev.070680. - DOI - PMC - PubMed
    1. Lubarsky B, Krasnow MA. Tube morphogenesis: making and shaping biological tubes. Cell. 2003;112:19–28. doi: 10.1016/S0092-8674(02)01283-7. - DOI - PubMed
    1. Kerman BE, Cheshire AM, Andrew DJ. From fate to function: the Drosophila trachea and salivary gland as models for tubulogenesis. Differentiation. 2006;74:326–348. doi: 10.1111/j.1432-0436.2006.00095.x. - DOI - PMC - PubMed
    1. Buechner, M., Yang, Z. & Al-Hashimi, H. A Series of Tubes: The C. elegans Excretory Canal Cell as a Model for Tubule Development. J. Dev. Biol.10.3390/jdb8030017 (2020). - PMC - PubMed
    1. Denker E, Di J. Ciona intestinalis notochord as a new model to investigate the cellular and molecular mechanisms of tubulogenesis. Semin. Cell Dev. Biol. 2012;23:308–319. doi: 10.1016/j.semcdb.2012.03.004. - DOI - PubMed

Publication types