. 2023 May 9;13(1):7490.
doi: 10.1038/s41598-023-33949-8.

Distinct oncogenic phenotypes in hematopoietic specific deletions of Trp53

Affiliations

Distinct oncogenic phenotypes in hematopoietic specific deletions of Trp53

Jayanth Kumar Palanichamy et al. Sci Rep. .

Abstract

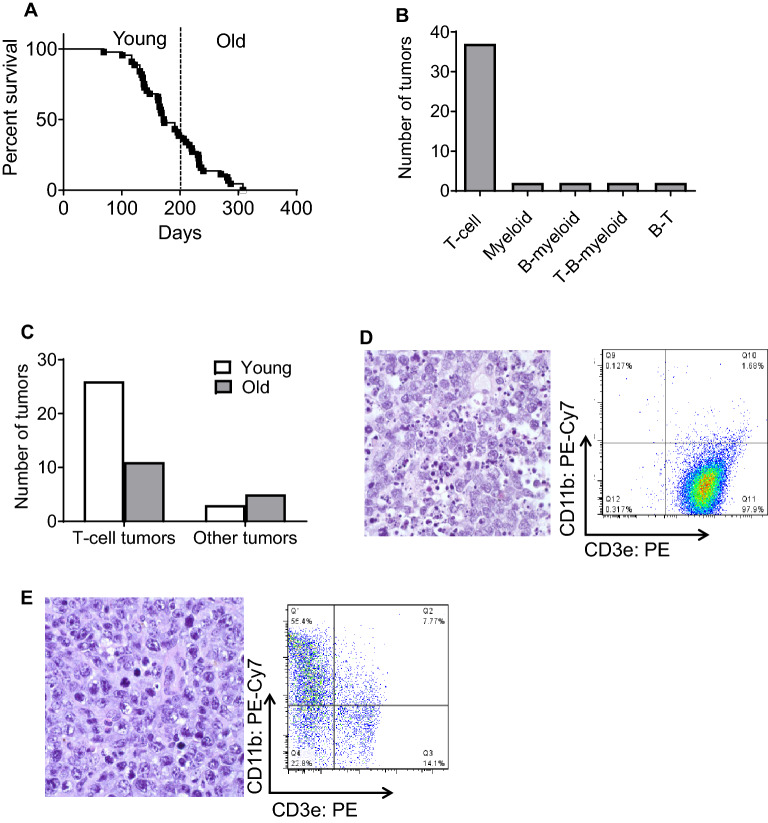
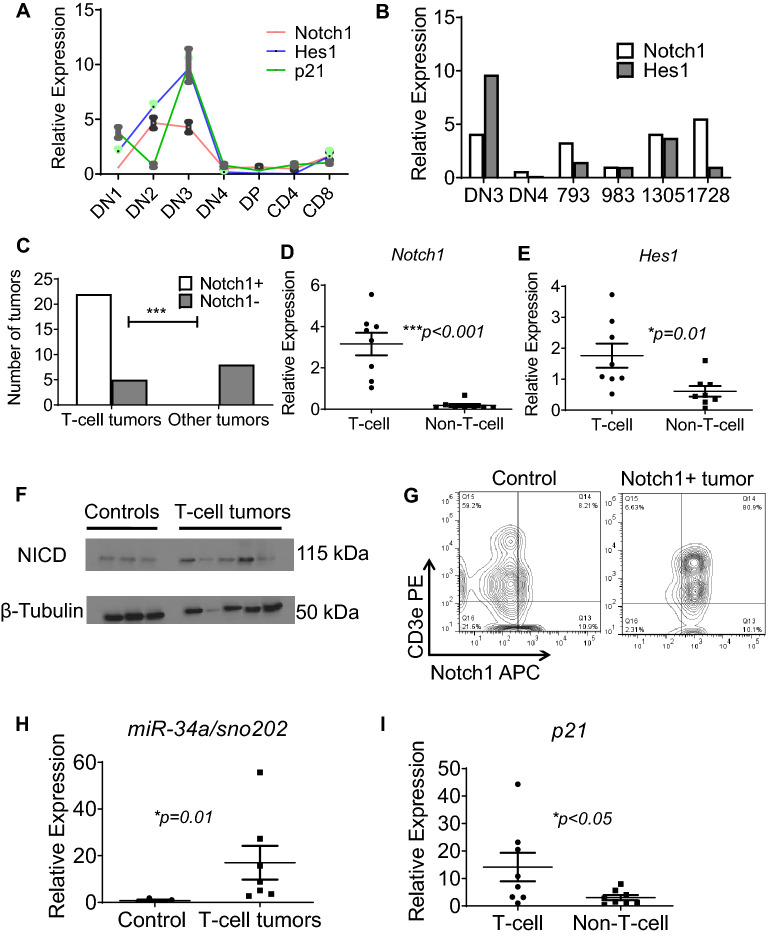
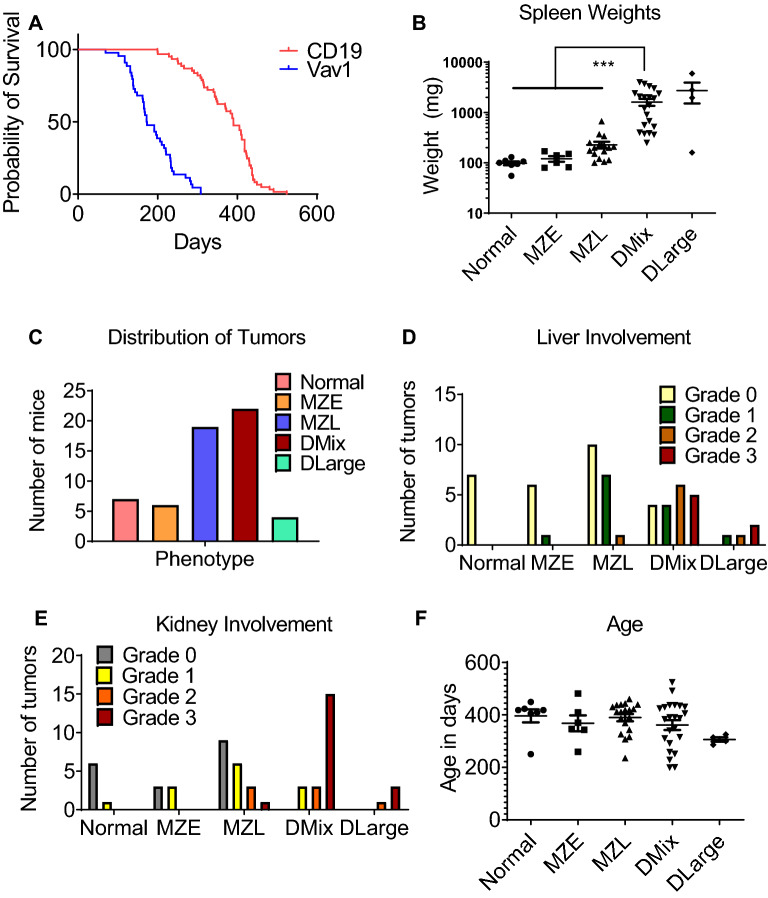
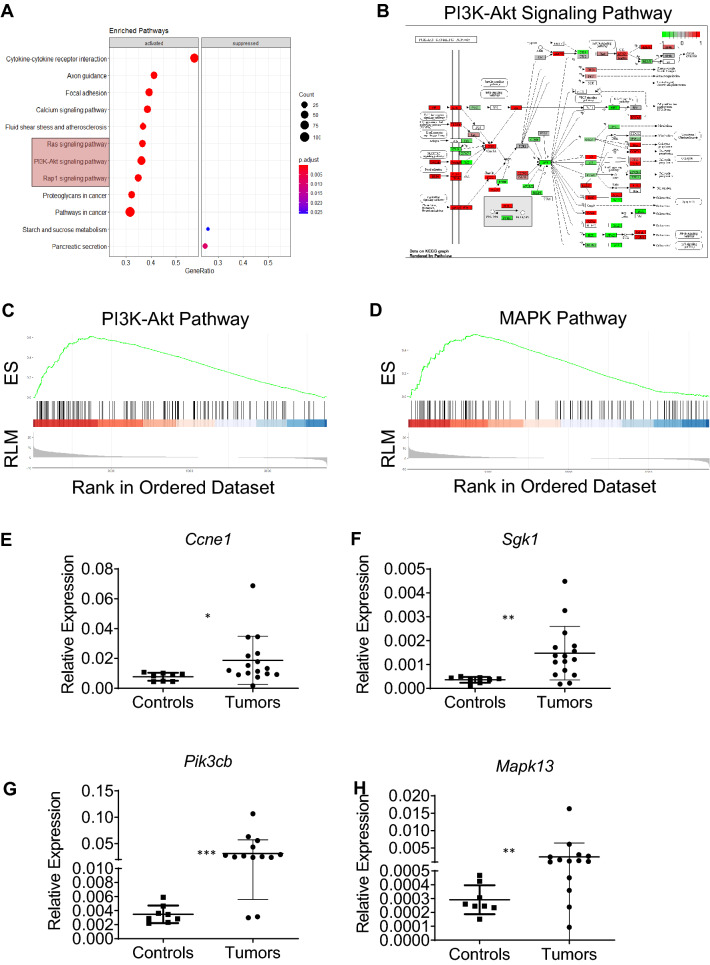
Loss of function in the tumor suppressor gene TP53 is the most common alteration seen in human cancer. In mice, P53 deletion in all cells leads predominantly to the development of T-cell lymphomas, followed by B-cell lymphomas, sarcomas and teratomas. In order to dissect the role of P53 in the hematopoietic system, we generated and analyzed two different mouse models deficient for P53. A pan-hematopoietic P53 deletion mouse was created using Vav1-Cre based deletion; and a B-cell-specific deletion mouse was created using a CD19-Cre based deletion. The Vav1-P53CKO mice predominantly developed T-cell malignancies in younger mice, and myeloid malignancies in older mice. In T-cell malignancies, there was accelerated thymic cell maturation with overexpression of Notch1 and its downstream effectors. CD19-P53CKO mice developed marginal zone expansion in the spleen, followed by marginal zone lymphoma, some of which progressed to diffuse large B-cell lymphomas. Interestingly, marginal zone and diffuse large B-cell lymphomas had a unique gene expression signature characterized by activation of the PI3K pathway, compared with wild type marginal zone or follicular cells of the spleen. This study demonstrates lineage specific P53 deletion leading to distinct phenotypes secondary to unique gene expression programs set in motion.


Conflict of interest statement

Dr. Rao has received compensation as a consultant for AbbVie, Inc. The remaining authors declare no relevant conflicts of interest.

Figures

Figure 1
Figure 1
Characterization of Vav1-P53CKO malignancies and variation with age. (A) Survival curve of Vav1-P53CKO mice (n=45). (B) Classification of tumors in Vav1-P53CKO mice by surface marker expression. Markers used: T-cell (CD3e), B-cell (B220) and Myeloid (CD11b). (C) Stratification of tumors by age (Young < 200 days, Old > 200 days). (D) Microscopic image of a thymic T-cell lymphoma with the corresponding FACS analysis showing a CD3e positive lymphoma. (E) Histology of a splenic myeloid tumor in an old mouse and FACS confirmation of CD11b positivity in the same tumor. (D, E), Magnification, 1,000x; Hematoxylin & Eosin staining.
Figure 2
Figure 2
T-cell tumors from Vav1-P53CKO mice derive from thymic T-cell progenitors. (A) Classification of T-cell lymphomas by expression of CD4 and CD8 on the cell surface. DP double positive and DN double negative (n=19) DP+CD8+ refers to lymphomas having a mixture of DP+ cells and CD8 SP+ cells. (B) Representative FACS plots of different CD3e+ T-lineage lymphomas, including CD8+, Double Positive and mixed DP+/CD8+ lymphoma. (C) Subsetting of the T-cell precursors from a control thymus (12 weeks), pre-malignant Vav1-P53CKO thymus (12 weeks) and a Vav1-P53CKO mouse with thymic lymphoma. The scatter plots show the percentages of DN3/4 cells in the 12-week-old control and KO mice. (D) Quantitation of DN3 and DN4 cells in WT and pre-malignant Vav1-P53CKO thymi.
Figure 3
Figure 3
Activation of Notch1 pathway in T-cell lymphomas in Vav1-P53CKO mice. (A) Dynamic expression of Notch1, downstream Hes1 and p21 in murine thymic subsets (2-way ANOVA, p=0.0024). (B) Comparison of Notch1 and Hes1 expression in the DN3 and DN4 subsets with T-cell lymphomas (numbered). (C) Distribution of Notch1 positivity of T-cell and other lymphomas (n=27 for T-cell lymphomas and 8 for other lymphomas); Expression of (D) Notch1 and (E) Hes1 by qPCR in T-cell (Notch1 positive) (n=8) and non-T-cell (Notch1 negative) (n=8) lymphomas. (F) Western Blotting for Intracellular Notch1 (NICD) from control thymi (n=3, first 3 samples from the left) and thymic lymphomas (n=5, right); Original blots presented in (G) Notch1 and CD3e positivity of a thymic lymphoma (H) Relative expression of miR-34a in control thymi (n=4) and T-cell lymphomas (n=7); sno202 was used as a reference gene (I) Expression of p21 in T-cell (n=8) and non T-cell lymphomas (n=8). GAPDH and L32 were used as reference genes.
Figure 4
Figure 4
Characterization of CD19-P53CKO mice and lymphomas. (A) Survival curves of Vav1-P53CKO (n=45) and CD19-P53CKO (n=54) mice (Log-rank (Mantel-Cox) test, p<0.0001). (B) Spleen weights of different groups of mice (normal n=7; marginal zone expansion (MZE) n=6; marginal zone lymphoma (MZL) n=16; diffuse mixed lymphoma (DMix) n=21; diffuse large cell lymphoma (DLarge) n=4). Significantly higher weight seen in DMix and DLarge compared to other groups (One way ANOVA ***p <0.00001). (C) Distribution of lymphomas in the CD19-P53CKO mice (D) Quantification of Liver and (E) Kidney involvement (F) Age distribution of these lymphomas.
Figure 5
Figure 5
Histologic and flow cytometric characterization of CD19-P53-CKO lymphomas. (AD) Histologic appearance of normal spleen (wild type mice) (A), marginal zone expansion (B), marginal zone lymphoma (C) and diffuse lymphoma (D) at 100X magnification; insets depicting the morphology of the lymphoma cells are shown at 1000X magnification.  Scale bars, 400 µm. The region between the dashed and dotted line contains the marginal zone, while the region within the dashed line constitutes the follicular zone.  Flow cytometric analysis shows CD19+ IgM+ lymphoma cells (E) which are negative for Notch2 (F). (G) Flow cytometric analysis of 12-week and 24-week WT and KO mice spleens showing significantly reduced marginal zone cell numbers.
Figure 6
Figure 6
Transcriptomic analysis of CD19-P53CKO lymphomas. (AD) GSEA analysis of differentially expressed genes in CD19-P53CKO lymphomas shows an enrichment for PI3K, Rap1 and MAPK pathways (ES enrichment score; RLM ranked log metric). (EH) Validation of PI3K and MAPK targets by qPCR in lymphomas (n=13) and controls (n=8). Controls included sorted marginal zone cells from 12-week-old WT or CD19-P53CKO mice.

Similar articles

Cited by

References

    1. Levine AJ. The P53 tumor suppressor gene and gene product. Princess Takamatsu Symp. 1989;20:221–30. - PubMed
    1. Levine AJ, Oren M. The first 30 years of P53: Growing ever more complex. Nat. Rev. Cancer. 2009;9(10):749–58. doi: 10.1038/nrc2723. - DOI - PMC - PubMed
    1. Levine AJ. P53: 800 million years of evolution and 40 years of discovery. Nat. Rev. Cancer. 2020;20(8):471–80. doi: 10.1038/s41568-020-0262-1. - DOI - PubMed
    1. Bykov VJN, Eriksson SE, Bianchi J, Wiman KG. Targeting mutant P53 for efficient cancer therapy. Nat. Rev. Cancer. 2018;18(2):89–102. doi: 10.1038/nrc.2017.109. - DOI - PubMed
    1. Attardi LD, Jacks T. The role of P53 in tumour suppression: Lessons from mouse models. Cell. Mol. Life Sci. 1999;55(1):48–63. doi: 10.1007/s000180050269. - DOI - PMC - PubMed

Publication types

Substances