. 2023 May 9;13(1):7555.
doi: 10.1038/s41598-023-33863-z.

Weakly supervised detection and classification of basal cell carcinoma using graph-transformer on whole slide images

Affiliations

Weakly supervised detection and classification of basal cell carcinoma using graph-transformer on whole slide images

Filmon Yacob et al. Sci Rep. .

Erratum in

Abstract

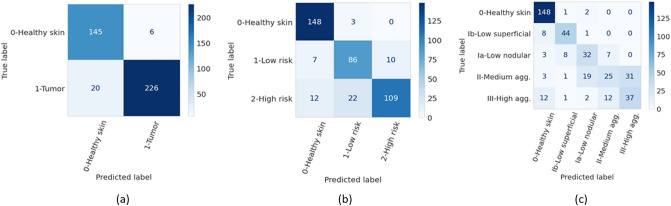
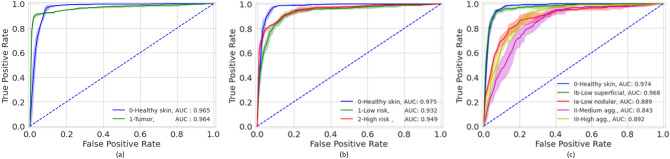
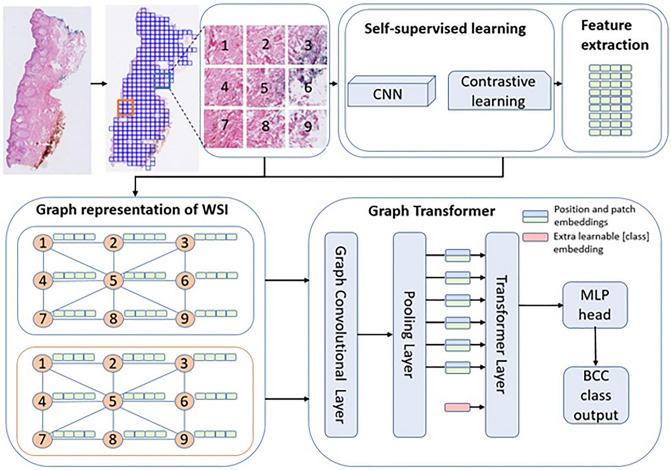
The high incidence rates of basal cell carcinoma (BCC) cause a significant burden at pathology laboratories. The standard diagnostic process is time-consuming and prone to inter-pathologist variability. Despite the application of deep learning approaches in grading of other cancer types, there is limited literature on the application of vision transformers to BCC on whole slide images (WSIs). A total of 1832 WSIs from 479 BCCs, divided into training and validation (1435 WSIs from 369 BCCs) and testing (397 WSIs from 110 BCCs) sets, were weakly annotated into four aggressivity subtypes. We used a combination of a graph neural network and vision transformer to (1) detect the presence of tumor (two classes), (2) classify the tumor into low and high-risk subtypes (three classes), and (3) classify four aggressivity subtypes (five classes). Using an ensemble model comprised of the models from cross-validation, accuracies of 93.5%, 86.4%, and 72% were achieved on two, three, and five class classifications, respectively. These results show high accuracy in both tumor detection and grading of BCCs. The use of automated WSI analysis could increase workflow efficiency.


Conflict of interest statement

The authors declare no competing interests.

Figures

Figure 1
Figure 1
Confusion matrices of the ensemble models for the three different classification tasks (T) on the test set. (a) binary classification (T1, tumor or no tumor), (b) three class classification (T2, no tumor and two grades of tumor), (c) five class classification (T3, no tumor and four grades of tumor).
Figure 2
Figure 2
Mean ROC curves of the five-fold cross-validation models based on a test set for the different classification tasks (T). (a) binary classification (T1), (b) three class classification (T2), (c) five class classification (T3).
Figure 3
Figure 3
Visualization of class activation maps (rows 2 and 3) and corresponding H&E images (rows 1 and 4). The class activation maps are built for the binary classification task (no tumor, tumor) with the areas of tumor emphasized. Representative examples are shown for all four BCC grades: (a) superficial low aggressive, (b) nodular low aggressive, (c) medium aggressive, (d) high aggressive. Rows 3 and 4 represent close up images from the areas marked with black boxes. The slides have been cropped to focus on the tissue after running the model.
Figure 4
Figure 4
Samples of BCC subtypes used in the three classification tasks (T): T1 (tumor or no tumor), T2 (no tumor and two grades of tumor), and T3 (no tumor and four grades of tumor), arranged by a pathologist in accordance with “Sabbatsberg model”. Depending on the classification task at hand, the samples in each row are assigned a different grade of tumor.
Figure 5
Figure 5
Method overview (adapted from Zheng et al.). The WSI is first tiled into patches and feature extracted via self-supervised learning. The extracted features become the nodes of a graph network, which become the inputs to a graph-transformer classifier.
Figure 6
Figure 6
An example of a WSI and its graph network. (a) WSI with six tissue sections, (b) six disconnected components of a graph network. The disconnected components are randomly placed in space. Each node represents a patch (patches not shown in the figure for better visualization).

References

    1. Levell NJ, Igali L, Wright KA, Greenberg DC. Basal cell carcinoma epidemiology in the UK: The elephant in the room. Clin. Exp. Dermatol. 2013;38:367–369. doi: 10.1111/ced.12016. - DOI - PubMed
    1. Dika E, et al. Basal cell carcinoma: A comprehensive review. Int. J. Mol. Sci. 2020;21:5572. doi: 10.3390/ijms21155572. - DOI - PMC - PubMed
    1. Cameron MC, et al. Basal cell carcinoma. J. Am. Acad. Dermatol. 2019;80:321–339. doi: 10.1016/j.jaad.2018.02.083. - DOI - PubMed
    1. Wong CSM. Basal cell carcinoma. BMJ. 2003;327:794–798. doi: 10.1136/bmj.327.7418.794. - DOI - PMC - PubMed
    1. Lo JS, et al. Metastatic basal cell carcinoma: Report of twelve cases with a review of the literature. J. Am. Acad. Dermatol. 1991;24:715–719. doi: 10.1016/0190-9622(91)70108-E. - DOI - PubMed

Publication types