. 2023 May 10;42(1):118.
doi: 10.1186/s13046-023-02686-1.

Piperlongumine conquers temozolomide chemoradiotherapy resistance to achieve immune cure in refractory glioblastoma via boosting oxidative stress-inflamation-CD8+-T cell immunity

Affiliations

Piperlongumine conquers temozolomide chemoradiotherapy resistance to achieve immune cure in refractory glioblastoma via boosting oxidative stress-inflamation-CD8+-T cell immunity

Feng Liu et al. J Exp Clin Cancer Res. .

Abstract

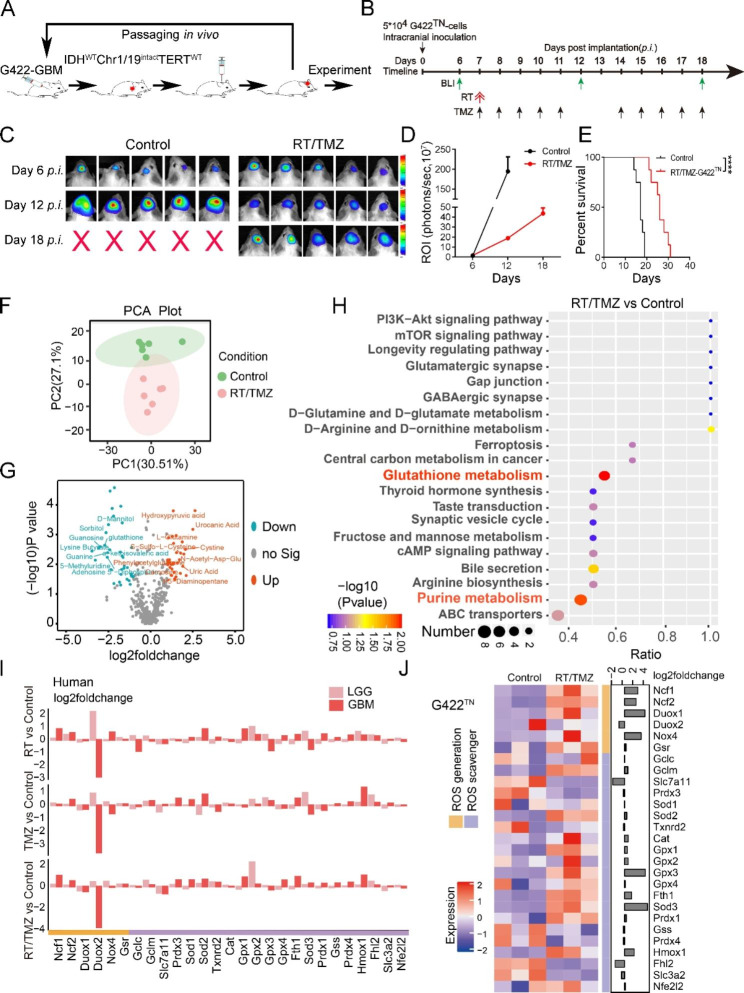
Background: The failure of novel therapies effective in preclinical animal models largely reflects the fact that current models do not really mimic the pathological/therapeutic features of glioblastoma (GBM), in which the most effective temozolomide chemoradiotherapy (RT/TMZ) regimen can only slightly extend survival. How to improve RT/TMZ efficacy remains a major challenge in clinic.

Methods: Syngeneic G422TN-GBM model mice were subject to RT/TMZ, surgery, piperlongumine (PL), αPD1, glutathione. Metabolomics or transcriptomics data from G422TN-GBM and human GBM were used for gene enrichment analysis and estimation of ROS generation/scavenging balance, oxidative stress damage, inflammation and immune cell infiltration. Overall survival, bioluminescent imaging, immunohistochemistry, and immunofluorescence staining were used to examine therapeutic efficacy and mechanisms of action.

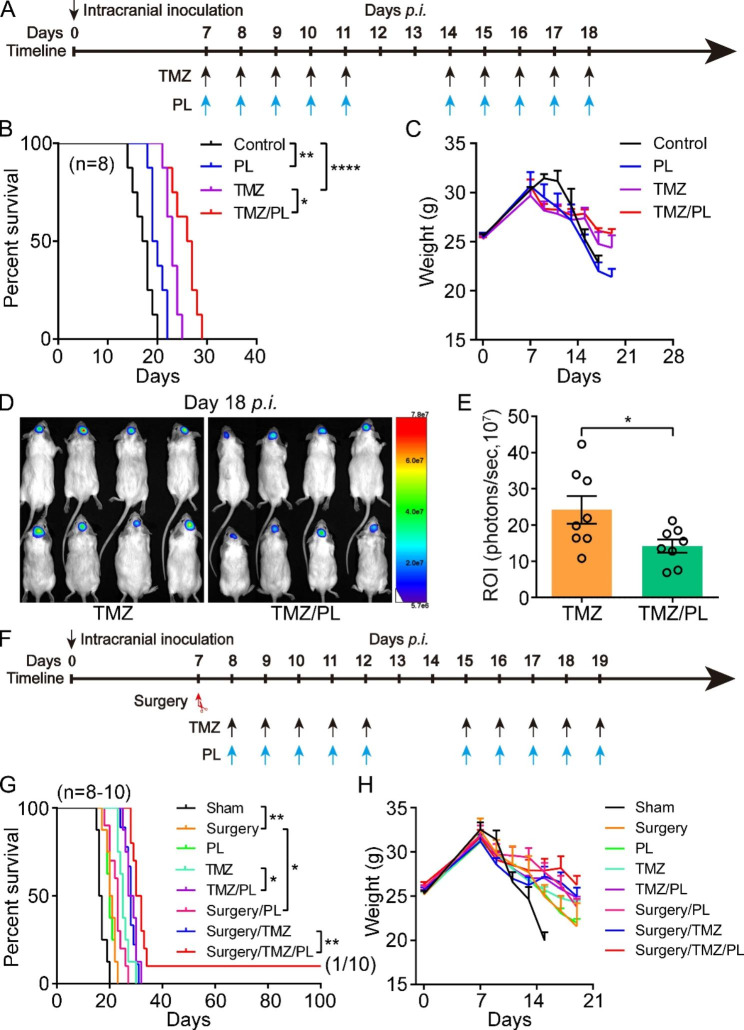
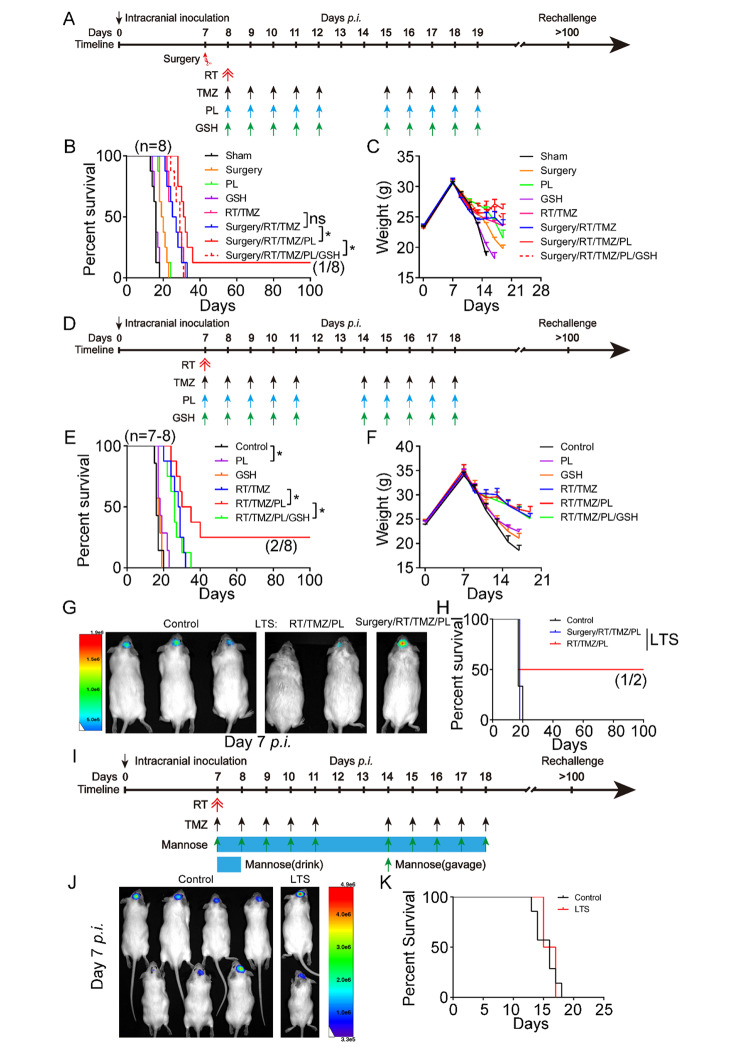
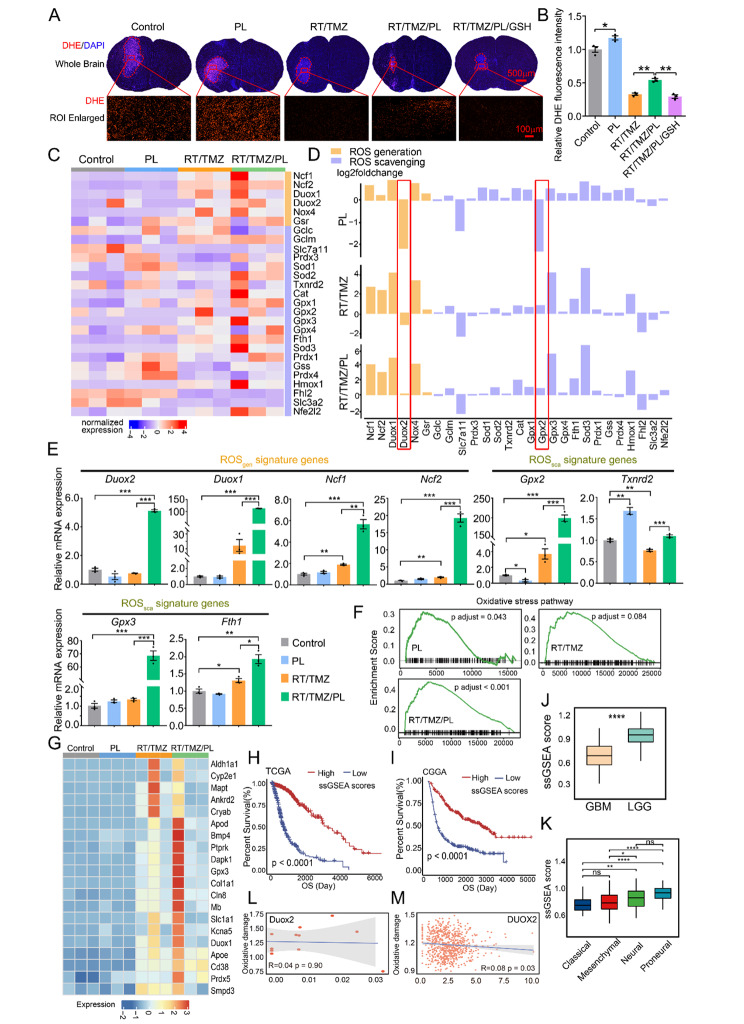
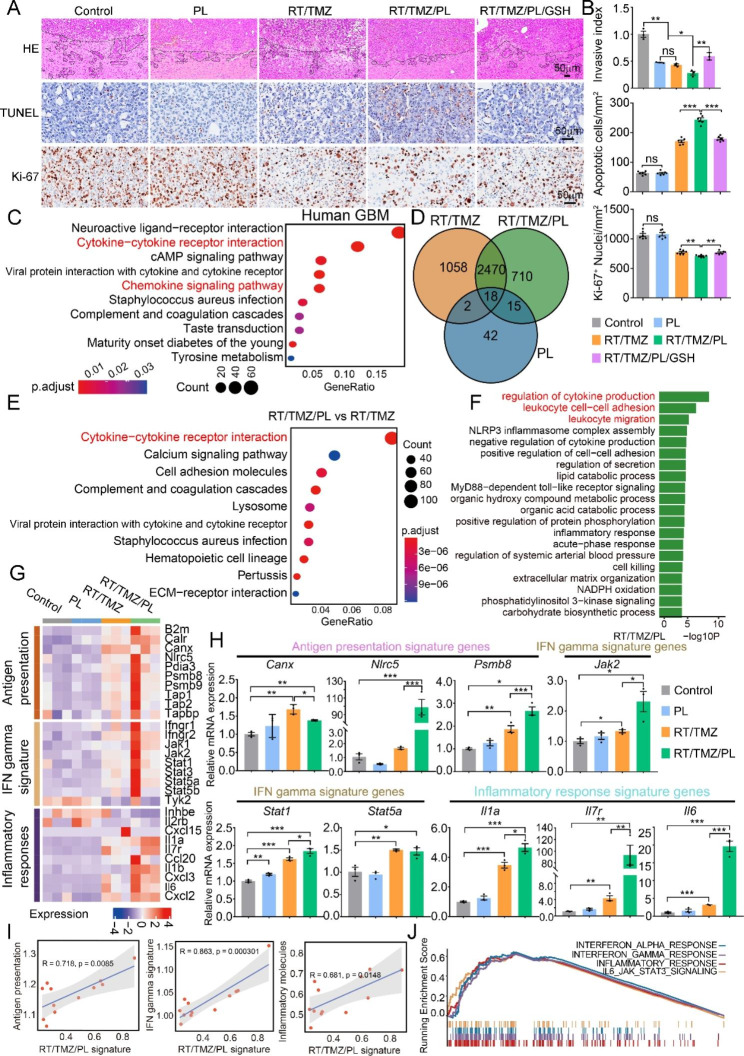
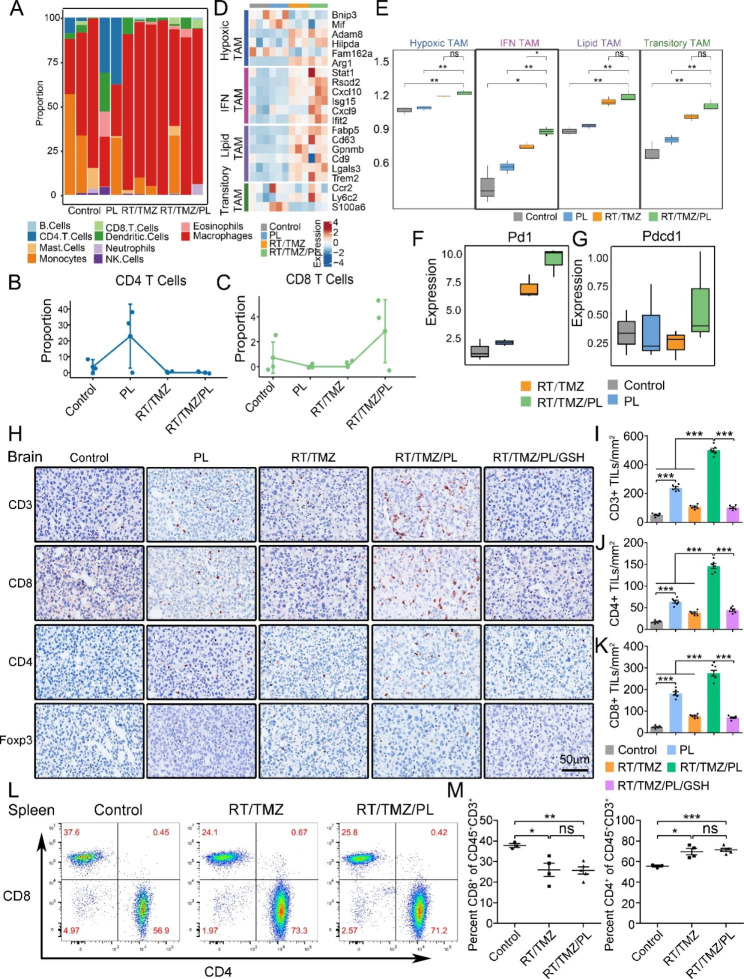
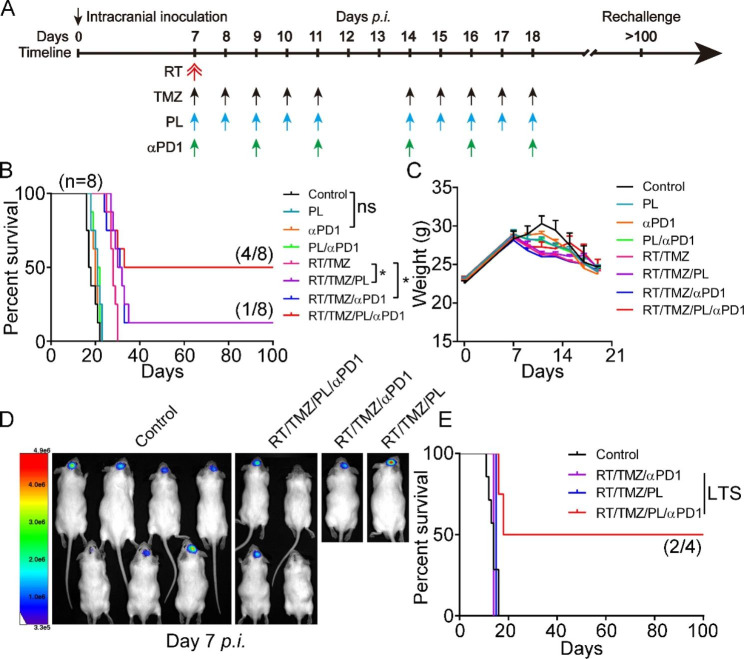
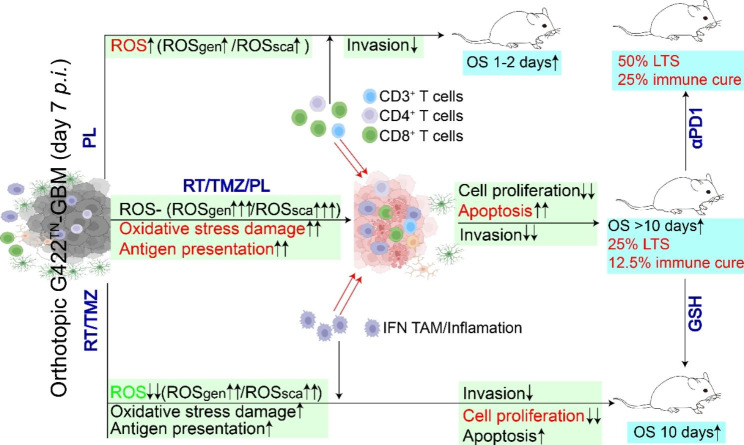
Results: Here we identified that glutathione metabolism was most significantly altered in metabolomics analysis upon RT/TMZ therapies in a truly refractory and reliable mouse triple-negative GBM (G422TN) preclinical model. Consistently, ROS generators/scavengers were highly dysregulated in both G422TN-tumor and human GBM. The ROS-inducer PL synergized surgery/TMZ, surgery/RT/TMZ or RT/TMZ to achieve long-term survival (LTS) in G422TN-mice, but only one LTS-mouse from RT/TMZ/PL therapy passed the rechallenging phase (immune cure). Furthermore, the immunotherapy of RT/TMZ/PL plus anti-PD-1 antibody (αPD1) doubled LTS (50%) and immune-cured (25%) mice. Glutathione completely abolished PL-synergistic effects. Mechanistically, ROS reduction was associated with RT/TMZ-resistance. PL restored ROS level (mainly via reversing Duox2/Gpx2), activated oxidative stress/inflammation/immune responses signature genes, reduced cancer cell proliferation/invasion, increased apoptosis and CD3+/CD4+/CD8+ T-lymphocytes in G422TN-tumor on the basis of RT/TMZ regimen.

Conclusion: Our findings demonstrate that PL reverses RT/TMZ-reduced ROS and synergistically resets tumor microenvironment to cure GBM. RT/TMZ/PL or RT/TMZ/PL/αPD1 exacts effective immune cure in refractory GBM, deserving a priority for clinical trials.

Keywords: Glioma; Immunotherapy; PD-1; Piperlongumine; ROS generation/elimination; Tumor microenvironment.


Conflict of interest statement

The authors declare that they have no conflict of interest.

Figures

Fig. 1
Fig. 1
Early alteration of glutathione metabolism restricts RT/TMZ efficacy in orthotopic G422TN-tumor. A Schematic diagram of orthotopic G422TN-GBM mouse model establishment. B Schematic diagram depicting the bioluminescent images (BLI) once every six days started on day 6 p.i. and RT/TMZ regimen started on day 7 p.i. RT, a single dose of 10 Gy-whole brain irradiation (WBI); TMZ, 10 doses of TMZ during one therapeutic course with one oral gavage of 50 µg TMZ per gram of body weight in each dose. C and D Representative bioluminescent images and statistical analysis of the ROI values of the intracranial tumors in control and RT/TMZ-treated group monitored before and after RT/TMZ treatment (on day 6, 12 and 18, n = 8/group). E The Kaplan-Meier survivals of the G422TN-mice with RT/TMZ treatment and control group (n = 8/group). F The PCA plot of metabolomic data in control and RT/TMZ treatment. G The volcano plot of RT/TMZ treatment vs. control metabolites. H The top 20 differential pathways between the Control and RT/TMZ identified by the KEGG pathway enrichment analysis. I Gene expression profile of ROS generating and scavenging genes in CGGA database including RT treatment vs. control, TMZ treatment vs. control, and RT/TMZ treatment vs. control. J Gene expression profile of ROS generating and scavenging genes in control and RT/TMZ treatment. (****P < 0.0001)
Fig. 2
Fig. 2
PL prominently improves TMZ and surgery/TMZ efficacy in G422TN-mice. A Schematic diagram depicting the Piperlongumine (PL), TMZ chemotherapy (TMZ), or their combined regimen started on day 7 p.i. PL, 10 doses of PL with once oral gavage of 5 µg/g. B and C The Kaplan-Meier survivals and body weight changes of the G422TN-mice with PL, TMZ, or TMZ/PL treatment started on day 7 p.i. (n = 8/group). D and E Representative bioluminescent images and statistical analysis of the ROI values of the intracranial tumors monitored on day 18 p.i. (n = 8/group). F Schematic diagram of the surgery, PL, TMZ chemotherapy (TMZ), or their combined regimen started on day 7–8 p.i.G and H The Kaplan-Meier survivals and body weight changes of the G422TN-mice with surgery, PL, TMZ, or their combined regimen started on day 7–8 p.i. (n = 8–10/group). (*P < 0.05; **P < 0.01; ****P < 0.0001)
Fig. 3
Fig. 3
PL prominently improves surgery/RT/TMZ and RT/TMZ efficacy to achieve long-term survival and immune cure in G422TN-mice. A Schematic diagram depicting the surgery, Piperlongumine (PL), RT, TMZ chemotherapy (TMZ), GSH, or their combined regimen started on day 7–8 p.i. GSH, 10 doses of GSH with once oral gavage of 400 µg/g. B and C The Kaplan-Meier survivals and body weight changes of the G422TN-mice with surgery, PL, RT, TMZ, GSH, or their combined regimen started on day 7–8 p.i. (n = 8/group). D Schematic diagram of the PL, RT, TMZ, GSH, or their combined regimen started on day 7 p.i.E and F The Kaplan-Meier survivals and body weight changes of the G422TN-mice with PL, RT, TMZ, GSH, or their combined regimen started on day 7 p.i. (n = 7–8/group). G and H Representative bioluminescent images and the Kaplan-Meier survivals of control (n = 3), RT/TMZ/PL (LTS, n = 2) and surgery/RT/TMZ/PL (LTS, n = 1) group during rechallenge. I Schematic diagram depicting the mannose, RT, TMZ, or their combined regimen started on day 7 p.i.. J Two of eight G422TN-mice achieved LTS in RT/TMZ/Mannose group, and were further subjected to rechallenging assay. BLI showed the presence of G422TN-tumor in control (n = 7) and LTS (n = 2) mice. K The Kaplan-Meier survival curves showed no difference between control and LTS group during rechallenge phase. (*P < 0.05; ns, not statistically significant)
Fig. 4
Fig. 4
PL restores RT/TMZ-reduced ROS and augments oxidative damage in G422TN-tumor via reprograming ROS modulator genes. A Representative DHE staining of ROS levels in control, PL, RT/TMZ, RT/TMZ/PL, RT/TMZ/PL/GSH group of G422TN-mice. Upper panel: whole brain figures. Scale bar, 500 μm. Lower panel: partial graphs. Scale bar, 100 μm. (n = 3). B Statistical analysis of ROS levels in control, PL, RT/TMZ, RT/TMZ/PL, RT/TMZ/PL/GSH group of G422TN-mice. (n = 3). C Gene expression of ROS generating and scavenging genes of all samples, the bar above the heatmap represents the group information, and the bar on the right of the heatmap represents the category of genes. D Fold changes of gene expression of ROS generating and scavenging genes in different comparison (PL treatment vs. control, top) and (RT/TMZ/PL treatment vs. control, bottom). E qRT-PCR showing the mRNA expression of ROSgen (Duox2, Duox1, Ncf1, Ncf2) and ROSsca signature genes (Gpx2, Txnrd2, Gpx3, Fth1). (n = 3). F Enrichment plot of ranked genes illustrating the enrichment of oxidative stress in different condition including PL treatment vs. control, RT/TMZ treatment vs. control, and RT/TMZ/PL treatment vs. control. G The heatmap of genes related to oxidative stress. H and I Patient survival in high oxidative signature group vs. low oxidative signature group of TCGA (H) LGG&GBM dataset, and CGGA (I) LGG&GBM dataset. J The boxplot illustrating ssGSEA score of the oxidative signature induced by RT/TMZ/PL treatment in different glioma types of TCGA dataset (Student’s t-tests). K The boxplot illustrating ssGSEA score of the oxidative signature induced by RT/TMZ/PL treatment in different GBM subtypes of TCGA dataset (Student’s t-tests). L and M Correlation between Duox2 expression and the oxidative damage signature in bulk RNA sequencing data of animal models (L), and of CGGA database (M). (*P < 0.05; **P < 0.01; ***P < 0.001; ****P < 0.0001; ns, not statistically significant)
Fig. 5
Fig. 5
PL synergizes RT/TMZ to upregulate inflammatory responses and antigen presentation signatures in G422TN-tumors. A and B H&E (invasive index, n = 3), TUNEL, KI-67 staining and statistical analysis of G422TN-tumor in control, PL, RT/TMZ, RT/TMZ/PL, RT/TMZ/PL/GSH group on day 9 p.i. Scale bar, 50 μm. (n = 6) C KEGG analysis of upregulated genes in high oxidative signature group in TCGA database. D Venn diagram illustrating the differential and overlapping genes upregulated in each group. E KEGG analysis of upregulated genes only present in RT/TMZ/PL treatment vs. control. F KEGG analysis of upregulated genes present in RT/TMZ/PL treatment vs. RT/TMZ treatment. G The heatmap illustrating expression of genes involved in the antigen presentation signature, the IFN gamma signature, and the inflammatory responses signature in different treatments. H qRT-PCR showing the mRNA expression of the antigen presentation signature genes (Canx, Nlrc5, Psmb8), the IFN gamma signature genes (Jak2, Stat1, Stat5a), and the inflammatory response signature genes (Il1a, Il7r, Il6). (n = 3). I Correlation between the RT/TMZ/PL signature and the antigen presentation signature, the IFN gamma signature, and the inflammatory responses signature, respectively. J Enrichment of hallmark pathways for upregulated genes in the RT/TMZ/PL group compared with control. (*P < 0.05; **P < 0.01; ***P < 0.001; ns, not statistically significant)
Fig. 6
Fig. 6
RT/TMZ/PL reshapes immunosuppressive microenvironment to induce CD3+/CD4+/CD8+ T cells infiltration in G422TN-tumors. A Immune cell proportion analysis in each sample. B and C The line chart illustrating CD 8 T cell and CD 4 T cell proportion in different treatments. D The heatmap illustrating expression of marker genes involved in Hypoxic TAMs, IFN TAMs, lipid TAMs and transitory TAMs in different treatments. E ssGSEA score of TAMs subtypes in different treatments. F and G Expressions of PD1 and PD-L1 in different treatments. H, I, J and K IHC staining (CD3, CD4, CD8 and Foxp3) and statistical analysis of G422TN-tumor in control, PL, RT/TMZ, RT/TMZ/PL, RT/TMZ/PL/GSH group on day 9 p.i. Scale bar, 50 μm. (n = 6). L and M Flow cytometric analysis of T cell gating and statistical analysis in spleen of mice of different groups (control, RT/TMZ and RT/TMZ/PL, n = 3–5). (*P < 0.05; **P < 0.01; ***P < 0.001; ns, not statistically significant)
Fig. 7
Fig. 7
αPD1 synergizes RT/TMZ/PL but not RT/TMZ to achieve substantial immune cure in G422TN-mice. A Schematic diagram depicting the PL, RT, TMZ, αPD1, or their combined regimen started on day 7 p.i. αPD1, 6 doses of αPD1 with once oral gavage of 200 µg/mouse except for first dose (400 µg/mouse). B and C The Kaplan-Meier survivals and body weight changes of the G422TN-mice with PL, TR, TMZ, αPD1, or their combined regimen started on day 7 p.i. (n = 8/group). D and E Representative bioluminescent images and the Kaplan-Meier survivals of control (n = 7), RT/TMZ/PL/αPD1 (LTS, n = 4), RT/TMZ/αPD1 (LTS, n = 1) and RT/TMZ/PL (LTS, n = 1) group during rechallenge. (*P < 0.05; ns, not statistically significant)
Fig. 8
Fig. 8
Schematic diagram of the article summary

References

    1. Louis DN, Perry A, Reifenberger G, von Deimling A, Figarella-Branger D, Cavenee WK, et al. The 2016 World Health Organization classification of tumors of the Central Nervous System: a summary. Acta Neuropathol. 2016;131(6):803–20. doi: 10.1007/s00401-016-1545-1. - DOI - PubMed
    1. Weller M, Wick W, Aldape K, Brada M, Berger M, Pfister SM, et al. Glioma. Nat Rev Dis Primers. 2015;1:15017. doi: 10.1038/nrdp.2015.17. - DOI - PubMed
    1. Stupp R, Mason WP, van den Bent MJ, Weller M, Fisher B, Taphoorn MJ, et al. Radiotherapy plus concomitant and adjuvant temozolomide for glioblastoma. N Engl J Med. 2005;352(10):987–96. doi: 10.1056/NEJMoa043330. - DOI - PubMed
    1. Stupp R, Hegi ME, Mason WP, van den Bent MJ, Taphoorn MJ, Janzer RC, et al. Effects of radiotherapy with concomitant and adjuvant temozolomide versus radiotherapy alone on survival in glioblastoma in a randomised phase III study: 5-year analysis of the EORTC-NCIC trial. Lancet Oncol. 2009;10(5):459–66. doi: 10.1016/S1470-2045(09)70025-7. - DOI - PubMed
    1. Yang F, He Z, Duan H, Zhang D, Li J, Yang H, et al. Synergistic immunotherapy of glioblastoma by dual targeting of IL-6 and CD40. Nat Commun. 2021;12(1):3424. doi: 10.1038/s41467-021-23832-3. - DOI - PMC - PubMed