. 2023 Oct 3;146(10):4292-4305.
doi: 10.1093/brain/awad155.

Neurologic sequelae of COVID-19 are determined by immunologic imprinting from previous coronaviruses

Affiliations

Neurologic sequelae of COVID-19 are determined by immunologic imprinting from previous coronaviruses

Marianna Spatola et al. Brain. .

Abstract

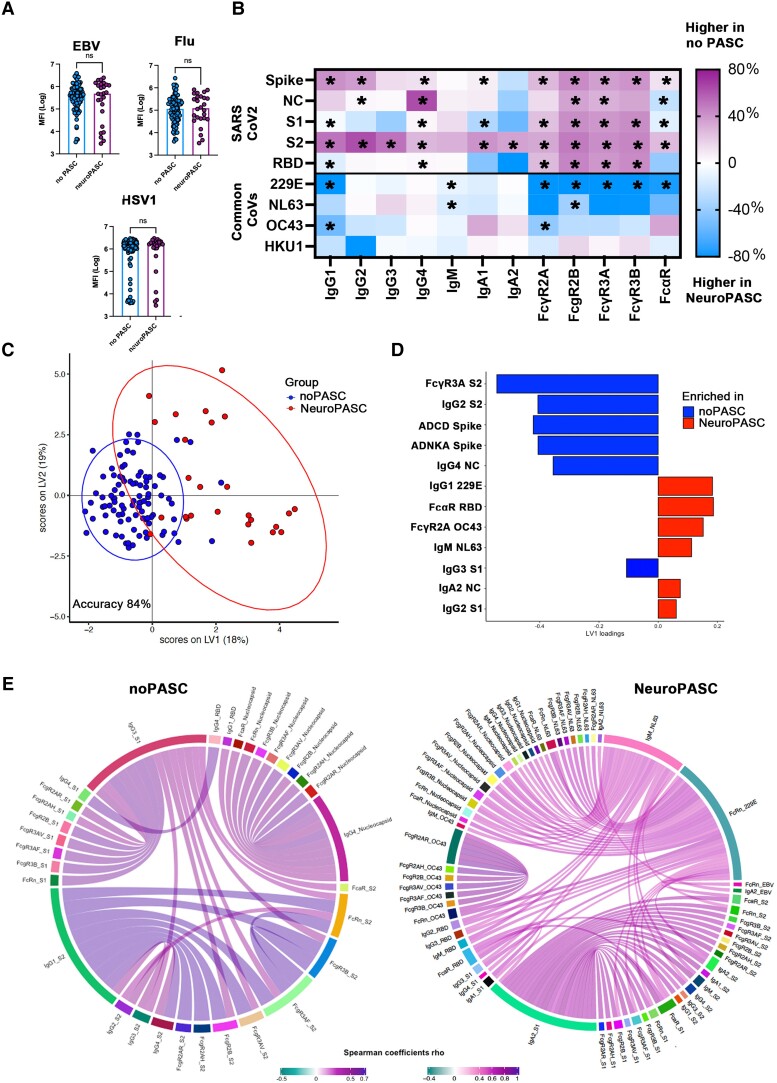
Coronavirus disease 2019 (COVID-19), which is caused by the severe acute respiratory syndrome coronavirus 2 (SARS-CoV-2), remains a global public health emergency. Although SARS-CoV-2 is primarily a respiratory pathogen, extra-respiratory organs, including the CNS, can also be affected. Neurologic symptoms have been observed not only during acute SARS-CoV-2 infection, but also at distance from respiratory disease, also known as long-COVID or neurological post-acute sequelae of COVID-19 (neuroPASC). The pathogenesis of neuroPASC is not well understood, but hypotheses include SARS-CoV-2-induced immune dysfunctions, hormonal dysregulations and persistence of SARS-CoV-2 reservoirs. In this prospective cohort study, we used a high throughput systems serology approach to dissect the humoral response to SARS-CoV-2 (and other common coronaviruses: 229E, HKU1, NL63 and OC43) in the serum and CSF from 112 infected individuals who developed (n = 18) or did not develop (n = 94) neuroPASC. Unique SARS-CoV-2 humoral profiles were observed in the CSF of neuroPASC compared with serum responses. All antibody isotypes (IgG, IgM, IgA) and subclasses (IgA1-2, IgG1-4) were detected in serum, whereas CSF was characterized by focused IgG1 (and absence of IgM). These data argue in favour of compartmentalized brain-specific responses against SARS-CoV-2 through selective transfer of antibodies from the serum to the CSF across the blood-brain barrier, rather than intrathecal synthesis, where more diversity in antibody classes/subclasses would be expected. Compared to individuals who did not develop post-acute complications following infection, individuals with neuroPASC had similar demographic features (median age 65 versus 66.5 years, respectively, P = 0.55; females 33% versus 44%, P = 0.52) but exhibited attenuated systemic antibody responses against SARS-CoV-2, characterized by decreased capacity to activate antibody-dependent complement deposition (ADCD), NK cell activation (ADNKA) and to bind Fcγ receptors. However, surprisingly, neuroPASC individuals showed significantly expanded antibody responses to other common coronaviruses, including 229E, HKU1, NL63 and OC43. This biased humoral activation across coronaviruses was particularly enriched in neuroPASC individuals with poor outcome, suggesting an 'original antigenic sin' (or immunologic imprinting), where pre-existing immune responses against related viruses shape the response to the current infection, as a key prognostic marker of neuroPASC disease. Overall, these findings point to a pathogenic role for compromised anti-SARS-CoV-2 responses in the CSF, likely resulting in incomplete virus clearance from the brain and persistent neuroinflammation, in the development of post-acute neurologic complications of SARS-CoV-2 infection.

Keywords: PASC; SARS-CoV-2; antibody-mediated complement activation; fc receptor; long-COVID.


Conflict of interest statement

S.M. received speaker honoraria from Novartis and Biogen. G.A. is a founder of SeromYx Systems, Inc. and is a member of the scientific advisory board of Sanofi Pasteur. The other authors report no competing interests.

Figures

Figure 1
Figure 1
Antibody responses to SARS-CoV-2 differentiate neuroPASC from no PASC. (A) Heat map indicating antibody functions [antibody-dependent complement deposition, (ADCD); cellular phagocytosis (ADCP); neutrophil phagocytosis (ADNP); NK activation with production of CD107a, IFNγ and MIP1β], capacity to bind Fcγ receptors (FcγR 2A, 2B, 3A, 3B) and total IgG of different SARS-CoV-2 specific antigens [Spike, S1, S2, receptor-binding domain (RBD) and neurocapsid (NC)] in individuals who did not develop (no PASC) or developed neurological PASC (neuroPASC). Each row corresponds to a single individual. Z-scores, positive (i.e. higher than the mean) in purple, negative (i.e. lower than the mean) in blue. (B) Bar dot plots show the level of IgG subclasses (IgG1, IgG2, IgG3, IgG4), IgM and IgA, FcγR binding capacity (2A, 2B, 3A, 3B) and functions (ADCD, ADNP, ADNKA with production of CD107a) of Spike-specific antibodies in individuals who did not develop (no PASC, in blue) or developed neurological PASC (neuroPASC, in purple).MFI = median fluorescence intensity. Mann–Whitney test, *P < 0.05, **P < 0.01, ***P < 0.001, ****P < 0.0001. (C) Radial plots indicate the levels of IgG subclasses (IgG1, IgG2, IgG3, IgG4), IgM, IgA1, IgA2, binding capacity to FcγR (2A, 2B, 3A, 3B), FcαR and functions (ADCD, ADCP, ADNP, ADNKA with production of CD107a, IFNγ and MIP1β) of Spike-specific antibodies in noPASC or neuroPASC individuals. Each sector represents a z-scored antibody feature. (D) Heat map indicating the average difference (%) of Spike-specific functions (ADCD, ADCP, ADNP, ADNKA with production of CD107a, IFNγ and MIP1β), binding capacity to FcγR (2A, 2B, 3A, 3B), FcαR, IgG subclasses (IgG1, IgG2, IgG3, IgG4), IgM and IgA between individuals with no PASC and with neuroPASC. Each column represents an antibody feature. Positive values indicate features enriched in no PASC; null values indicate features equally present in both no PASC and neuroPASC. None of the features were enriched in neuroPASC.
Figure 2
Figure 2
NeuroPASC is characterized by low antibody responses to SARS-CoV-2 and increased responses to common coronaviruses. (A) Bar dot plots show the level of IgG1 antibodies against non-coronaviruses [Epstein–Barr virus (EBV), influenza (Flu), Herpes simplex virus (HSV1)] in individuals who did not develop (no PASC, in blue) or developed neurological PASC (neuroPASC, in purple). MFI = median fluorescence intensity. Mann–Whitney test, ns = statistically not significant. (B) Heat map indicates the average difference (%) of SARS-CoV-2-specific [Spike, S1, S2, receptor-binding domain (RBD) and neurocapsid (NC)] and common coronavirus-specific (229E, OC43, NL63, HKU1) IgG subclasses (IgG1, IgG2, IgG3, IgG4), IgM and IgA1, IgA2, binding capacity to FcγRs (2A, 2B, 3A, 3B), FcαR, between individuals with no PASC and with neuroPASC. Each column represents an antibody feature. Positive values (purple) indicate features enriched in no PASC, negative values (blue) indicate features enriched in neuroPASC, null values (white) indicate features equally present in both no PASC and neuroPASC. Common CoVs = other non-SARS-CoV-2 common coronaviruses. Mann–Whitney test was usedto define statistically significant differences at a univariate level between no PASC and neuroPASC, *P < 0.01 or less. (C and D) Multivariate analysis of antibody signatures in individuals with neuroPASC and no PASC. Partial least square discriminant analysis of LASSO-selected features was used to resolve antibody profiles in neuroPASC and no PASC. Dots represent individual samples (no PASC, blue; neuroPASC, red) across SARS-CoV-2-specific (Spike, S1, S2, RBD, NC) and common coronavirus- specific (229E, OC43, NL63, HKU1) antibody features. Bar graph shows latent variable 1 (LV1) loadings of LASSO-selected features ranked by their variable importance in projection. Features enriched in no PASC are in blue, features enriched in neuroPASC are in red. Ten-fold cross validation was performed, resulting in 84% cross validation accuracy (P < 0.01). (E) Chord plots indicate the Spearman correlation coefficients between the LASSO-selected features enriched in no PASC (left) and neuroPASC (right), and the non-LASSO selected antibody features across SARS-CoV-2 antigens (Spike, S1, S2, RBD, NC) and other common coronavirus antigens (229E, OC43, NL63, HKU1). Only coefficients >0.5 are plotted, P < 0.01 after Benjamini–Hochberg correction for multiple comparisons. Positive values represent direct correlations, negative values represent inverse correlations (none of the features were inversely correlated with any other feature).
Figure 3
Figure 3
Compartmentalization of antibody responses to SARS-CoV-2 in serum and CSF in individuals with neuroPASC. (A) The heat map indicates functions [antibody-dependent complement deposition (ADCD), cellular phagocytosis (ADCP), neutrophil phagocytosis (ADNP), NK cell activation (ADNKA), with production of CD107a, IFNγ and MIP1β], IgG subclasses (IgG1, IgG2, IgG3, IgG4), IgM, IgA, capacity to bind to Fcγ receptors (FcγR2A, 2B, 3A, 3B) and FcαR of antibodies to different SARS-CoV-2-specific antigens [Spike, S1, S2, receptor-binding domain (RBD) and neurocapsid (NC)] in serum and CSF from individuals with neuroPASC. Each row corresponds to a single sample. Z-scores: positive (i.e. higher than the mean) in purple, negative (i.e. lower than the mean) in blue. (B) Radial plots indicate levels of IgG subclasses (IgG1, IgG2, IgG3, IgG4), IgM and IgA1, IgA2, binding capacity to FcγR (2A, 2B, 3A, 3B), FcαR, and functions (ADCD, ADCP, ADNP, ADNKA with production of CD107a, IFNγ and MIP1β) of Spike-specific antibodies in serum and CSF from individuals with neuroPASC. Each sector represents a z-scored antibody feature. (C) Bar dot plots show the level of IgG subclasses (IgG1, IgG2, IgG3), IgM and IgA, binding capacity to FcγR (2A, 2B, 3A, 3B) and FcαR, and functions (ADCD, ADNP, ADNKA) of Spike-specific antibodies in serum (purple) and CSF (blue) from individuals with neuroPASC. MFI = median fluorescence intensity. Mann–Whitney test, *P < 0.05, **P < 0.01, ***P < 0.001, ****P < 0.0001. (D) The bar plots indicate the percentage of neuroPASC subjects/samples with positive Spike-specific antibody responses of each IgG subclass in serum and CSF. Positive responses were considered if MFI of each sample was 2-fold higher than the median MFI of PBS level (background). (E) Heat map indicating the average difference (%) of Spike-specific IgG subclasses (IgG1, IgG2, IgG3, IgG4), IgM and IgA1, IgA2, binding capacity to FcγR (2A, 2B, 3A, 3B) and FcαR, between CSF and serum from individuals with neuroPASC. Each column represents an antibody feature. Positive values (purple) indicate features enriched in serum, negative values (blue) indicate features enriched in CSF, null values (white) indicate features equally present in serum and CSF. No features were enriched in CSF.
Figure 4
Figure 4
CSF and serum antibody responses to SARS-CoV-2 and other common coronaviruses in neuroPASC individuals. (A) Heat map indicating the average difference (%) of antibody responses to SARS-CoV-2 [Spike, S1, S2, receptor-binding domain (RBD) and neurocapsid (NC)], other common coronaviruses (229E, OC43, NL63, HKU1) and non-coronaviruses [Epstein–Barr virus (EBV), influenza (Flu), herpes simplex virus (HSV1)], including IgG subclasses (IgG1, IgG2, IgG3, IgG4), IgM and IgA, binding capacity to FcγR (2A, 2B, 3A, 3B) and FcαR, between serum and CSF from individuals with neuroPASC. Positive values (purple) indicate features enriched in serum, negative values (blue) indicate features enriched in CSF, null values (white) indicate features equally present in both serum and CSF. There were no features enriched in CSF. (B and C) Multivariate analyses of antibody signatures in serum and CSF from individuals with neuroPASC. Multilevel partial least square discriminant analysis on LASSO-selected features was used to resolve antibody profiles in serum:CSF pairs. Dots represent individual samples (serum, blue; CSF, purple) across SARS-CoV-2 antigens (Spike, S1, S2, RBD, NC), and common coronaviruses (229E, OC43, NL63, HKU1). Bar graph shows latent variable 1 (LV1) loadings of LASSO-selected features ranked by their variable importance in projection. Features enriched in serum are in purple, no features were enriched in CSF. Ten-fold cross validation was performed, resulting in 100% cross validation accuracy (P < 0.01). (D and E) Bar dot plots indicate CSF to serum ratios of IgG1, FcγR (2A, 2B, 3A) and FcαR binding capacity for SARS-CoV-2 (Spike, S1, S2, RBD, NC antigens combined) and other common coronaviruses (229E, OC43, NL63, HKU1 combined) antibodies in individuals with neuroPASC. Mann–Whitney test; *P < 0.05, ***P < 0.001, ****P < 0.0001. (F) Bar dot plots show the binding capacity of antibodies to the neonatal Fc receptor (FcRn) of serum and CSF SARS-CoV-2 antibodies targeting different antigens (Spike, S1, S2, RDB, NC) in individuals with neuroPASC. Mann–Whitney test, *P < 0.05, **P < 0.01, ***P < 0.001 ****P < 0.0001. (G) Bar dot plots indicate the FcRn binding capacity of serum and CSF SARS-CoV-2 antibodies (Spike, S1, S2, RBD, NC, combined), compared to common coronaviruses (229E, OC43, NL63, HKU1 combined) and non-coronaviruses (EBV, Flu, HSV1 combined). Kruskal–Wallis test, Dunn’s correction for multiple comparisons; **P < 0.01, ****P < 0.0001. Common CoVs = other non-SARS-CoV-2 common coronaviruses; MFI = median fluorescence intensity.
Figure 5
Figure 5
CSF and serum antibody signatures associated with good versus poor outcome in neuroPASC individuals. (A) The radial plots indicate the levels of IgG1 and FcγR2A binding capacity of SARS-CoV-2 antibodies [Spike, S1, S2, receptor binding domain (RBD), top half] and common coronaviruses (229E, OC43, NL63, bottom half) in individuals with neuroPASC, divided into those with good versus poor outcome. Each sector represents a z-scored antibody feature. (B and C) Volcano plots showing the correlation of each SARS-CoV-2 and common coronavirus (229E, OC43, NL63, HKU1)-antibody feature with modified Rankin Scale (mRS). Spearman correlation coefficients are indicated in the x-axis (positive correlation, right, in red; negative correlation, left, in blue), and the statistical significance is indicated on the y-axis [−log10(P-value)]. Values above the black dashed line indicate statistically significant correlations (P-adjusted value < 0.01, Benjamini–Hochberg correction for multiple comparisons). Negative correlations, indicating good outcome, were identified with serum antibodies (left, in blue), whereas negative correlations, indicating poor outcome, were identified with CSF antibody profiles (right, in red).

Comment in

References

    1. Xu Z, Shi L, Wang Y, et al. Pathological findings of COVID-19 associated with acute respiratory distress syndrome. Lancet Respir Med. 2020;8:420–422. - PMC - PubMed
    1. Lai C-C, Shih T-P, Ko W-C, et al. Severe acute respiratory syndrome coronavirus 2 (SARS-CoV-2) and coronavirus disease-2019 (COVID-19): the epidemic and the challenges. Int J Antimicrob Agents. 2020;55:105924. - PMC - PubMed
    1. Liotta EM, Batra A, Clark JR, et al. Frequent neurologic manifestations and encephalopathy-associated morbidity in COVID-19 patients. Ann Clin Transl Neurol. 2020;7:2221–2230. - PMC - PubMed
    1. Koralnik IJ, Tyler KL. COVID-19: a global threat to the nervous system. Ann Neurol. 2020;88:1–11. - PMC - PubMed
    1. Harapan BN, Yoo HJ. Neurological symptoms, manifestations, and complications associated with severe acute respiratory syndrome coronavirus 2 (SARS-CoV-2) and coronavirus disease 19 (COVID-19). J Neurol. 2021;268:3059–3071. - PMC - PubMed

Publication types