

FBXL4 suppresses mitophagy by restricting the accumulation of NIX and BNIP3 mitophagy receptors
- PMID: 37161784
- PMCID: PMC10308361
- DOI: 10.15252/embj.2022112767
FBXL4 suppresses mitophagy by restricting the accumulation of NIX and BNIP3 mitophagy receptors
Abstract
To maintain both mitochondrial quality and quantity, cells selectively remove damaged or excessive mitochondria through mitophagy, which is a specialised form of autophagy. Mitophagy is induced in response to diverse conditions, including hypoxia, cellular differentiation and mitochondrial damage. However, the mechanisms that govern the removal of specific dysfunctional mitochondria under steady-state conditions to fine-tune mitochondrial content are not well understood. Here, we report that SCFFBXL4 , an SKP1/CUL1/F-box protein ubiquitin ligase complex, localises to the mitochondrial outer membrane in unstressed cells and mediates the constitutive ubiquitylation and degradation of the mitophagy receptors NIX and BNIP3 to suppress basal levels of mitophagy. We demonstrate that the pathogenic variants of FBXL4 that cause encephalopathic mtDNA depletion syndrome (MTDPS13) do not efficiently interact with the core SCF ubiquitin ligase machinery or mediate the degradation of NIX and BNIP3. Thus, we reveal a molecular mechanism whereby FBXL4 actively suppresses mitophagy by preventing NIX and BNIP3 accumulation. We propose that the dysregulation of NIX and BNIP3 turnover causes excessive basal mitophagy in FBXL4-associated mtDNA depletion syndrome.
Keywords: BNIP3; FBXL4; NIX/BNIP3L; mitochondria; mitophagy.
© 2023 The Authors. Published under the terms of the CC BY 4.0 license.
Conflict of interest statement
M.P. is a scientific cofounder of SEED Therapeutics; receives research funding from and is a shareholder in Kymera Therapeutics; and is a consultant for, a member of the scientific advisory board of, and has financial interests in CullGen, SEED Therapeutics, Triana Biomedicines, and Umbra Therapeutics. However, no research funds were received from these entities, and the findings presented in this manuscript were not discussed with any person in these companies. The other authors have no competing interests to declare.
Figures
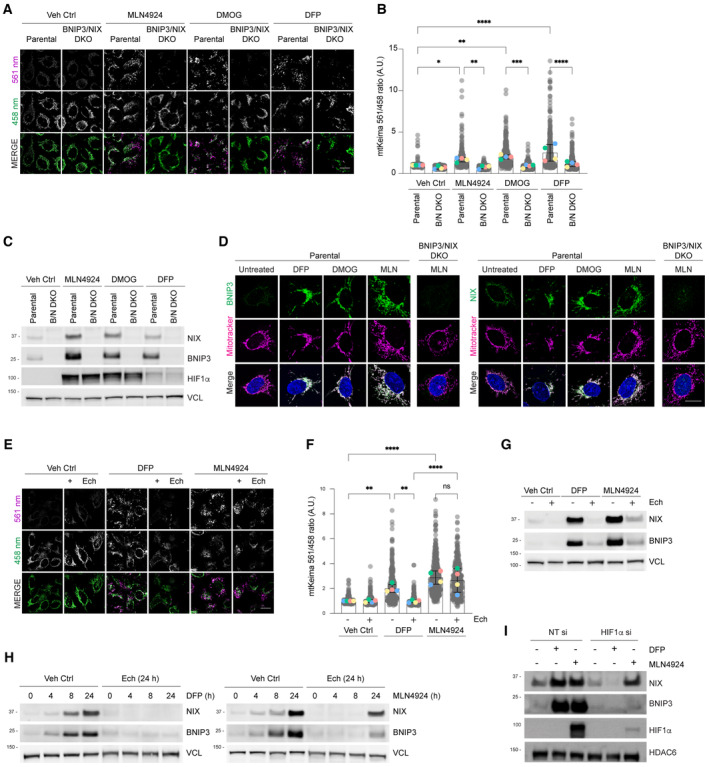
NIX and BNIP3 are required for mitophagy induced by MLN4924 and other HIF1α stabilisers. Parental HeLa cells and NIX/BNIP3 double‐knockout (NIX/BNIP3 DKO) HeLa cells expressing mt‐Keima were treated with DFP (1 mM), MLN4924 (0.5 μM) or DMOG (10 nM) for 24 h and analysed by live‐cell confocal microscopy. The emission signals obtained after excitation with the 458 nm laser (neutral pH) or 561 nm laser (acidic pH) are shown in green and magenta respectively.
Quantification of mitophagy shown in panel A. Mitophagy is represented as the ratio of mt‐Keima 561 nm fluorescence intensity to mt‐Keima 458 nm fluorescence intensity for individual cells normalised to the mean of the untreated condition.
Analysis of NIX and BNIP3 protein levels after MLN4924, DMOG or DFP treatments. HeLa cells or HeLa NIX/BNIP3 DKO cells were treated with MLN4924, DMOG or DFP for 24 h. Total‐cell lysates corresponding to conditions in panel A were subject to immunoblotting.
NIX and BNIP3 accumulate on mitochondria in response to MLN4924, DMOG or DFP treatments. HeLa cells or HeLa NIX/BNIP3 DKO cells were treated as in panel A, fixed and stained with the indicated antibodies and MitoTracker.
Inhibition of HIF1α with echinomycin prevents DFP‐induced mitophagy but not MLN4924‐induced mitophagy. U2OS cells expressing mt‐Keima were treated with the indicated drugs for 24 h and analysed by live‐cell confocal microscopy.
Quantification of mitophagy shown in panel D.
Analysis of NIX and BNIP3 levels after DFP or MLN4924 treatments when HIF1α is inhibited using echinomycin. Total‐cell lysates corresponding to conditions in panel E‐F were subject to immunoblotting.
Inhibition of HIF1α with echinomycin prevents the increase of NIX and BNIP3 in response to DFP, but not MLN4924. U2OS cells were treated with DFP or MLN4924 over a time course. Where indicated, cells were also treated for 24 h with echinomycin. Total‐cell lysates were subject to immunoblotting as shown.
Depletion of HIF1α by siRNA prevents the increase of NIX and BNIP3 in response to DFP, but not in response to MLN4924. U2OS cells were transfected with non‐targeting siRNAs (NT si) or siRNAs targeting HIF1α. Cells were treated with DFP or MLN4924 for 24 h prior to harvesting for immunoblotting.
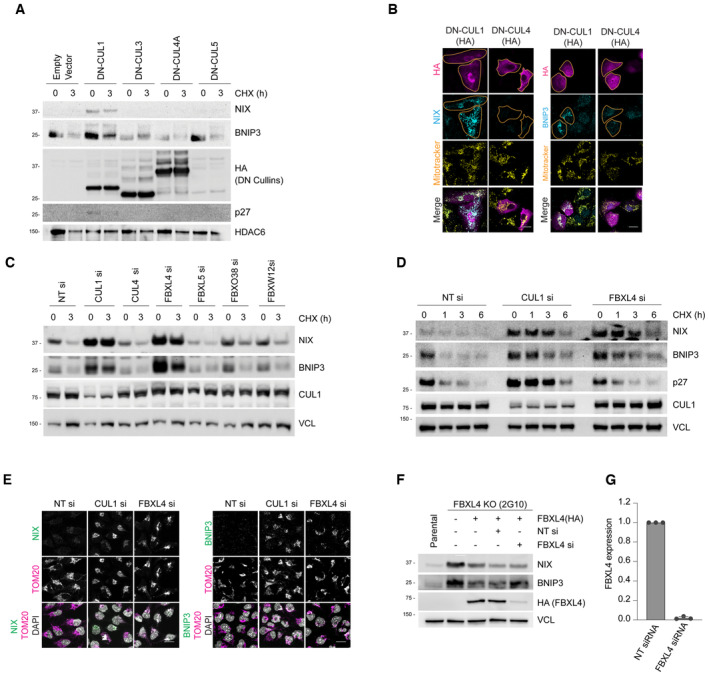
Expression of dominant‐negative (DN) Cullin 1 results in an increase in the levels and half‐life of NIX and BNIP3. HeLa‐T‐REx‐Flp‐in cells were transfected with FLAG‐HA‐tagged dominant‐negative CUL1, CUL3, CUL4A and CUL5 or an empty vector. Cells were treated with cycloheximide for 3 h followed by immunoblotting with the indicated antibodies.
Expression of dominant‐negative (DN) Cullin 1 results in the accumulation of NIX and BNIP3 at mitochondria. U2OS cells were transfected with FLAG‐HA‐tagged DN‐CUL1 or FLAG‐HA‐tagged DN‐CUL4 and immunostained for both HA and either NIX or BNIP3. An orange line marks the edge of the individual cells expressing the dominant‐negative cullin protein.
Screen for F‐box proteins required for turnover of NIX and BNIP3. U2OS cells were transfected with the indicated siRNAs. Total‐cell lysates were subject to immunoblotting as shown. NIX and BNIP3 are stabilised by depletion of CUL1 and FBXL4 (but not other F‐box proteins). NT = non‐targeting.
NIX and BNIP3 are upregulated and stabilised by depletion of FBXL4 and CUL1. U2OS cells were transfected with non‐targeting siRNA, CUL1 siRNA or FBXL4 siRNA. Cells were treated with cycloheximide for the indicated times prior to immunoblotting with the specified antibodies.
Depletion of FBXL4 and CUL1 results in NIX and BNIP3 accumulation at mitochondria. U2OS cells were transfected with non‐targeting siRNA, CUL1 siRNA or FBXL4 siRNA. Cells were fixed and stained with the indicated antibodies.
Evaluation of the efficacy of FBXL4 siRNA to reduce exogenous HA‐tagged FBXL4 protein levels. U2OS FBXL4 knockout cells (which are described in Fig 2 and Table EV1) constitutively expressing FBXL4‐HA (FBXL4 tagged with C‐terminal HA) were transfected with non‐targeting siRNA or FBXL4 siRNA. Immunoblotting was performed as indicated.
U2OS cells were transfected with non‐targeting siRNA or FBXL4 siRNA and the efficiency of FBXL4 siRNA was evaluated using quantitative‐PCR. Bars represent the mean ± SD from three independent transfections.
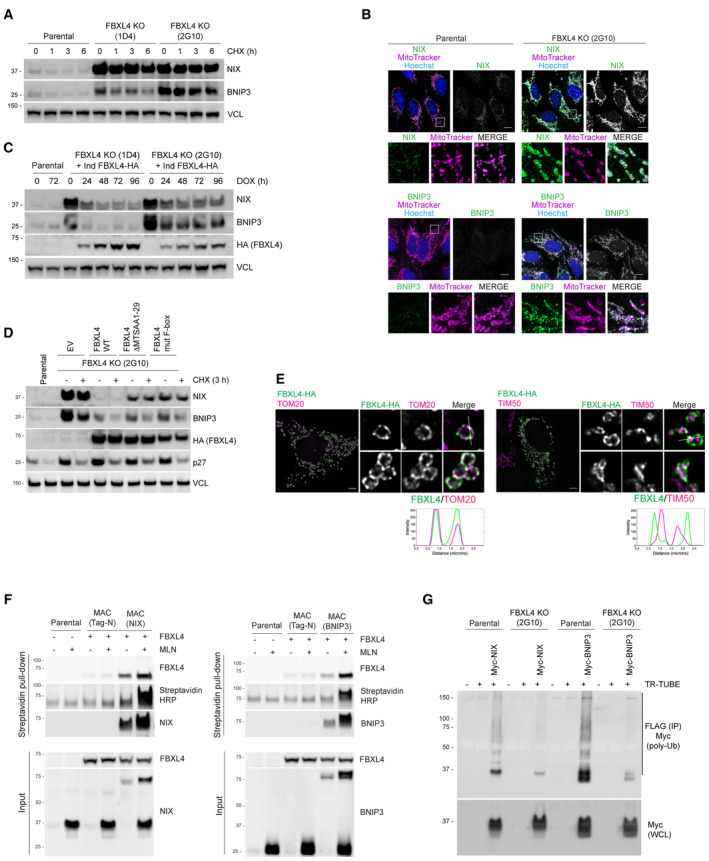
NIX and BNIP3 are upregulated and stabilised in CRISPR–Cas9 generated FBXL4‐deficient cells. CRISPR‐mediated genome editing was used to modify the FBXL4 locus in U2OS cells. Clonal cell lines lacking FBXL4 were treated with cycloheximide for the indicated times prior to immunoblotting.
NIX and BNIP3 accumulate at mitochondria in FBXL4‐deficient cells. FBXL4‐deficient cells (clone 2G10) were fixed and stained with MitoTracker (magenta) and with antibodies to NIX or BNIP3 (green). Scale bar = 10 μm.
Re‐expression of FBXL4 into FBXL4‐defective CRISPR lines reduces the levels of NIX and BNIP3 in FBLX4‐deficient clones. FBXL4‐deficient 2G10 and FBXL4‐deficient 1D4 cell lines were stably transduced with a doxycycline‐inducible FBXL4‐HA construct. Cells were treated with doxycycline for the indicated times prior to immunoblotting with the specified antibodies.
FBXL4 requires its mitochondrial targeting sequence and F‐box domain to mediate NIX and BNIP3 turnover. U2OS FBXL4 KO (2G10) cells were rescued with wild‐type FBXL4‐HA or variants lacking either the mitochondrial targeting sequence (FBXL4‐ΔMTS) or the F‐box domain (FBXL4‐F‐box mut) variants. Cells were treated with cycloheximide for 3 h prior to harvesting.
FBXL4 localises to the mitochondrial outer membrane. Cells transiently transfected with FBXL4‐HA‐C were treated with DFP for 24 h. Cells were stained with an anti‐HA antibody (to recognise FBXL4) and either TOM20 (an outer mitochondrial membrane protein) or TIM50 (an inner mitochondrial membrane protein). The line scan intensity profiles for FBXL4 (green) and TOM20/TIM50 (magenta) represent fluorescence intensity (y‐axis) plotted against distance (x‐axis). Scale bars = 5 μm.
FBXL4 is a proximity interactor of NIX and BNIP3. Cells expressing inducible BirA‐BNIP3, BirA‐NIX and BirA control were transduced with a lentiviral vector expressing FBXL4, as indicated. Cells were treated with doxycycline for 48 h (to induce BirA‐bait protein expression), biotin for 24 h (for the biotinylation reaction) and, where indicated, MLN4924 for 24 h (to stabilise NIX and BNIP3). Streptavidin‐coupled beads were used to capture the biotinylated proteins. FBXL4 was specifically detected in the eluate from BirA‐BNIP3 and BirA‐NIX compared with BirA‐alone.
NIX and BNIP3 polyubiquitylation depend on FBXL4. U2OS or U2OS‐FBXL4 KO cells were co‐transfected with TR‐TUBE and either myc‐BNIP3 or myc‐NIX, as indicated. Cell lysates obtained 48 h post‐transfection were immunoprecipitated with anti‐FLAG beads, and the immunoprecipitates were analysed by immunoblotting using anti‐myc antibody (to detect ubiquitylated NIX or BNIP3). The line on the right marks a ladder of bands corresponding to polyubiquitylated myc‐BNIP3 or myc‐NIX.
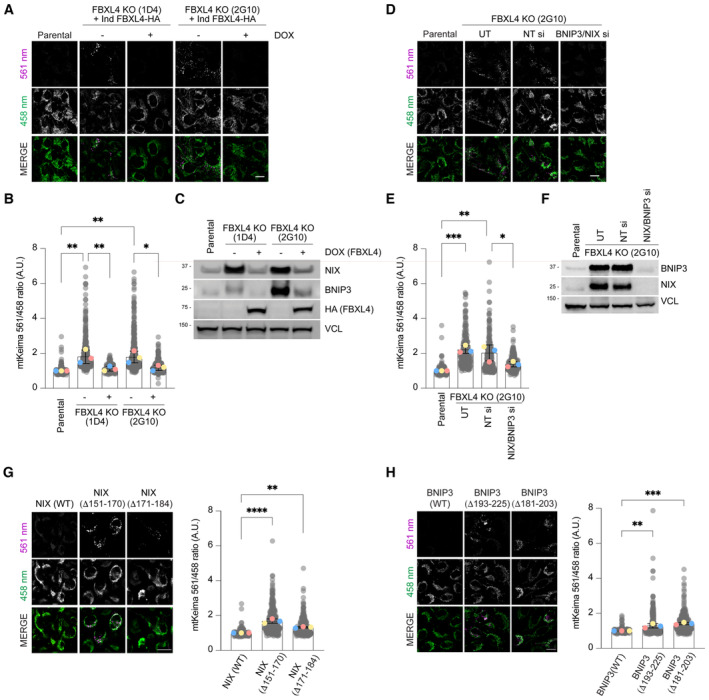
Loss of FBXL4 leads to an increase in mitophagy, which can be reduced by re‐expression of FBXL4. U2OS mt‐Keima FBXL4 KO clones (2G10 and 1D4) expressing doxycycline‐inducible wild‐type FBXL4‐HA were treated with doxycycline for 72 h. The emission signals obtained after excitation with the 458 nm laser (neutral pH) or 561 nm laser (acidic pH) are shown in green and magenta respectively.
Quantification of mitophagy shown in panel A. Mitophagy is represented as the ratio of mt‐Keima 561 nm fluorescence intensity divided by mt‐Keima 458 nm fluorescence intensity for individual cells normalised to the parental condition.
Corresponding cells from (A, B) were harvested for immunoblotting to analyse the extent of NIX and BNIP3 reduction by induction of FBXL4‐HA.
Depleting NIX/BNIP3 via siRNA reduces the increased mitophagy caused by FBXL4 deficiency. U2OS mt‐Keima cells and U2OS mt‐Keima FBXL4 KO 2G10 cells were transfected with siRNAs targeting both NIX and BNIP3 (NIX/BNIP3 si) or non‐targeting siRNA (NT si). UT, untransfected.
Quantification of (D).
Corresponding cells from (D, E) were harvested for immunoblotting to analyse the extent of NIX and BNIP3 reduction after siRNA transfection.
Hyper‐stable NIX deletion mutants increase mitophagy compared with wild‐type NIX. Hela Flp‐in NIX KO mt‐Keima cells stably expressing inducible NIX(WT), FLAG‐NIXΔ151‐170 or FLAG‐NIXΔ171‐184 were treated with doxycycline for 48 h (see Fig EV2B and E, top panel). Mitophagy was visualised as in (A) and quantified as in (B).
Hyper‐stable BNIP3 deletion mutants increase mitophagy compared with wild‐type NIX. Hela Flp‐in NIX/BNIP3 DKO mt‐Keima cells stably expressing BNIP3 deletion mutants were treated with doxycycline for 48 h (see Fig EV2C and E, bottom panel).
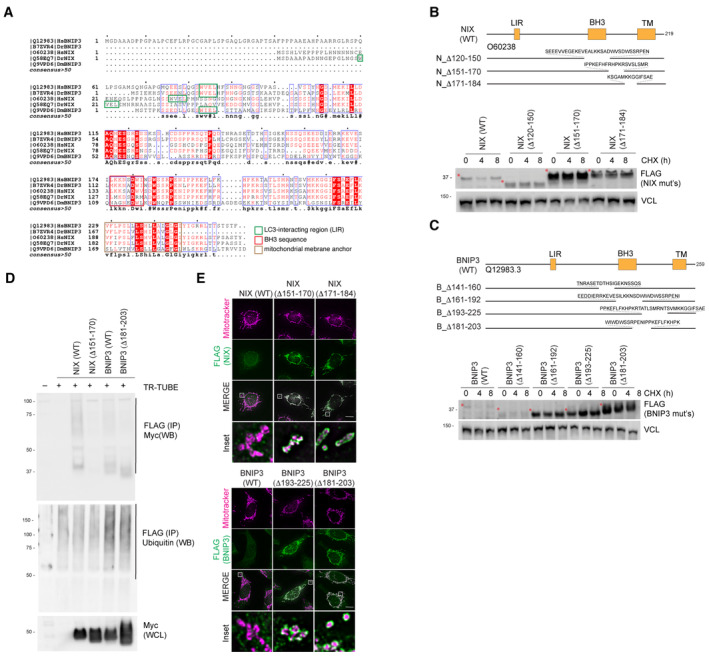
Alignment of NIX and BNIP3 orthologues outlining conserved residues. The LC3‐interacting region, non‐canonical BH3 region and the trans‐membrane domains are shown. The blue boxes represent regions of conservation. White letters on a red background are strictly conserved, and red letters are highly conserved.
Deletion of regions from the C‐terminus of NIX results in its stabilisation compared with wild‐type NIX. Hela‐Flp‐In NIX knockout cells expressing inducible FLAG‐NIX‐WT, FLAG‐NIXD120‐150, FLAG‐NIXD151‐170 and FLAG‐NIXD171‐184 were treated with cycloheximide (CHX) for the indicated times. Cells were then lysed and analysed by immunoblotting. Red asterisks denote the size of NIX or its deletion mutants.
Deletion of regions from the C‐terminus of BNIP3 results in its stabilisation compared with wild‐type BNIP3. HeLa Flp‐in BNIP3 knockout cells expressing inducible FLAG‐BNIP3‐WT or the specified FLAG‐BNIP3 deletions mutants were treated with CHX. Red asterisks denote the size of BNIP3 or its deletion mutants.
Hyper‐stable NIX and BNIP3 are ubiquitylated to a lesser extent than wild‐type NIX and BNIP3. HeLa NIX/BNIP3 DKO cells were co‐transfected with FLAG‐tagged TR‐TUBE and myc‐tagged NIX/BNIP3 constructs: NIX(WT), hyper‐stable NIXΔ151‐170, BNIP3(WT) or hyper‐stable BNIP3(Δ181‐203). FLAG‐tagged TUBE protein was affinity purified from the corresponding lysates using FLAG‐beads, and the precipitates were analysed by immunoblotting using antibodies to detect myc. The ladder of signal in the wild‐type NIX and BNIP3 lanes corresponds to polyubiquitylated myc‐BNIP3 or myc‐NIX.
FLAG‐NIX/BNIP3 and deletion mutants localise to the mitochondria. HeLa‐Flp‐in cells expressing inducible FLAG‐NIX/BNIP3‐WT or deletion mutants were stained for MitoTracker (magenta) and FLAG antibodies (green). Scale bars = 20 mm.
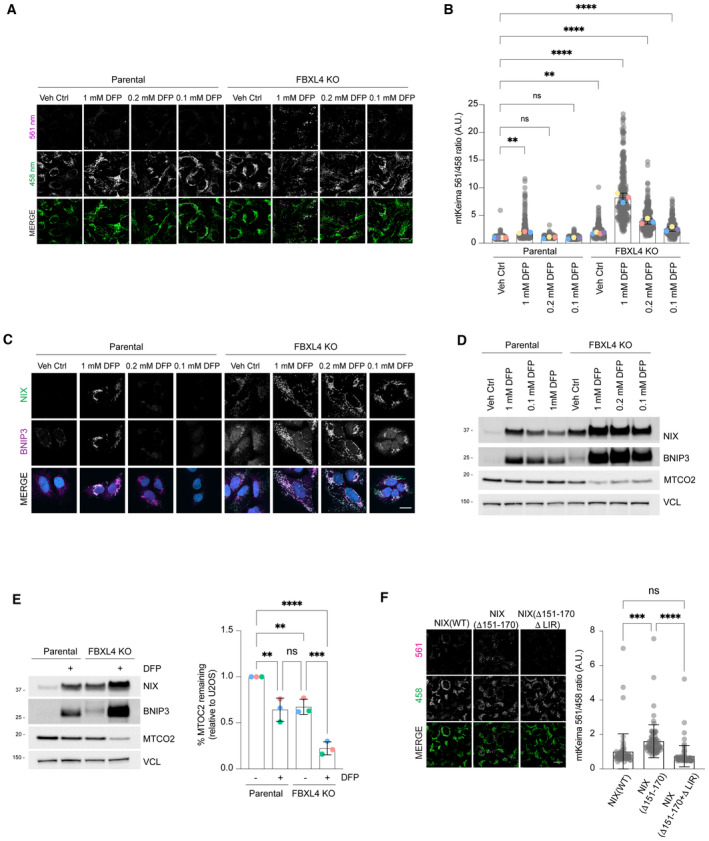
FBXL4‐deficient cells are ultra‐sensitive to DFP‐induced mitophagy. U2OS mt‐Keima cells and U2OS mt‐Keima FBXL4 KO cells were treated with DFP at specified concentrations for 24 h and analysed by live‐cell confocal microscopy. The emission signals obtained after excitation with the 458 nm laser (neutral pH) or 561 nm laser (acidic pH) are shown in green and magenta respectively.
Quantification of mitophagy shown in panel (A). Mitophagy is represented as the ratio of mt‐Keima 561 nm fluorescence intensity divided by mt‐Keima 458 nm fluorescence intensity for individual cells normalised to the parental condition.
Corresponding conditions from (A, B) were harvested for immunoblotting to analyse levels of NIX and BNIP.
Analysis of NIX and BNIP localisation in parental cells or FBXL4 KO cells treated with specified concentration of DFP.
Quantification of the MT‐CO2 protein levels in parental or FBXL4 KO cells treated with DFP. Western blotting was used to assess MT‐CO2 levels remaining relative to parental untreated cells.
Mitophagy induced by hyper‐stable NIX (Δ151‐170) requires NIX's LC3 interaction domain. Hela Flp‐in Keima cells stably expressing inducible NIX(WT), NIX(Δ151‐170) or NIX (151–170, LIRmut) were treated with doxycycline for 48 h. Mitophagy was quantified as in (B).
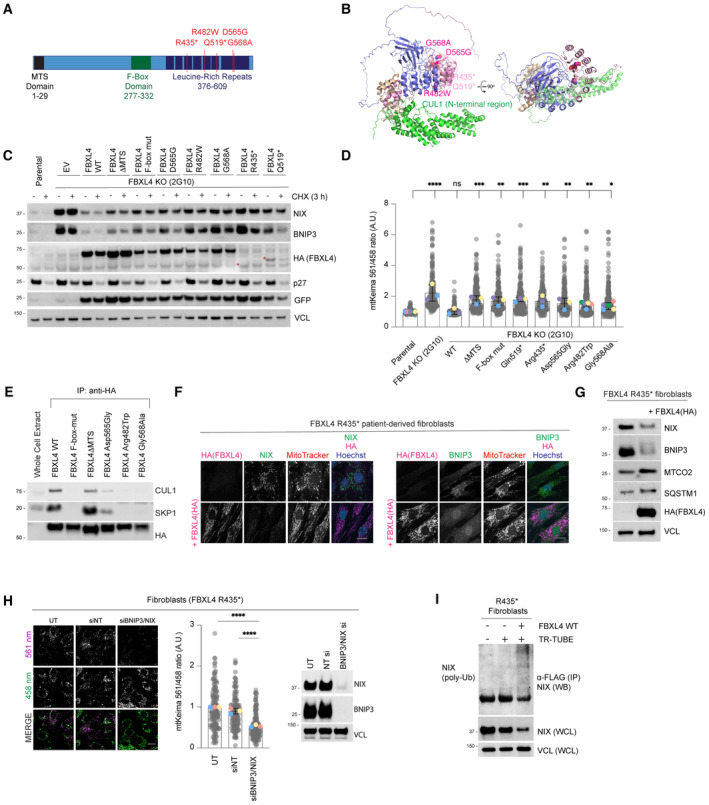
Schematic representation of domain structure of FBXL4. Pathological variants tested herein are shown in red.
Alphafold2 structural modelling of FBXL4 and its complex formation with SCF components SKP1 and CUL1. Pathogenic variants of FBXL4 indicated in magenta spheres. The pale pink section of the LRRs represents the region deleted by the truncation deletions (Arg435).
FBXL4 patient‐derived variants exhibit reduced efficiency compared to wild‐type FBXL4 in mediating the downregulation and destabilisation of NIX and BNIP3. U2OS FBXL4 KO (2G10) cells were rescued with constructs expressing wild‐type FBXL4‐HA, FBXL4(F‐box mut), FBXL4(ΔMTS) or specified patient variants. Cells were treated with cycloheximide for 3 h prior to harvesting. Samples were lysed, and immunoblotting was performed. GFP serves as a marker of transduction efficiency/transgene expression. EV = empty vector.
FBXL4 patient‐derived variants exhibit reduced efficiency compared to wild‐type FBXL4 in suppressing mitophagy. U2OS mt‐Keima cells (parental), U2OS mt‐Keima FBXL4 KO cells and U2OS mt‐Keima FBXL4 KO cells rescued with the specified FBXL4 constructs were visualised using live cell confocal microscopy. Mitophagy is represented as the ratio of mt‐Keima 561 nm fluorescence intensity divided by mt‐Keima 458 nm fluorescence intensity for individual cells normalised to untreated U2OS cells.
FBXL4‐Arg482Trp and FBXL4‐Gly568Ala patient variants are less efficient than FBXL4 wild‐type at assembling into a complex with SKP1 and CUL1. FBXL4‐KO cells expressing wild‐type FBXL4‐HA or FBXL4 variants were harvested and lysed. Whole‐cell extracts were subjected to immunoprecipitation (IP) with anti‐HA agarose beads and immunoblotting, as indicated.
Expression of FBXL4‐HA into FBXL4‐deficient patient fibroblast cells causes down‐regulation of NIX and BNIP3 and extensive changes in mitochondrial morphology. FBXL4‐deficient patient fibroblasts (derived from patients harbouring homozygous non‐sense mutation in FBXL4 at pArg435*) were transduced with FBXL4‐HA construct. Cells were stained with MitoTracker, fixed and co‐immunostained with antibodies to HA (to detect FBXL4) and either NIX or BNIP3.
Steady‐state protein levels after expression of FBXL4‐HA‐C in FBXL4‐deficient patient fibroblasts analysed by Western blotting. FBXL4‐deficient patient fibroblasts were transduced with FBXL4‐HA‐C.
NIX/BNIP3 depletion mediated by siRNA reduces mitophagy in FBXL4‐deficient patient fibroblast cells. FBXL4‐deficient patient fibroblasts were transfected with siRNAs targeting both NIX and BNIP3 (NIX/BNIP3 si) or non‐targeting siRNA (NT si) (left). Live‐cell confocal microscopy was performed to visualise mitophagy, and quantification was performed as in D (middle). The siRNA‐mediated depletion of NIX and BNIP3 was evaluated by Western blotting (right).
Ubiquitylation of endogenous NIX is restored upon expression of FBXL4 in patient‐derived cells. Patient‐derived fibroblasts were transfected with FLAG‐tagged TR‐TUBE, as indicated. FLAG‐tagged TUBE protein was affinity purified from the corresponding lysates using FLAG‐beads, and the precipitates were analysed by immunoblotting using antibodies to endogenous NIX.
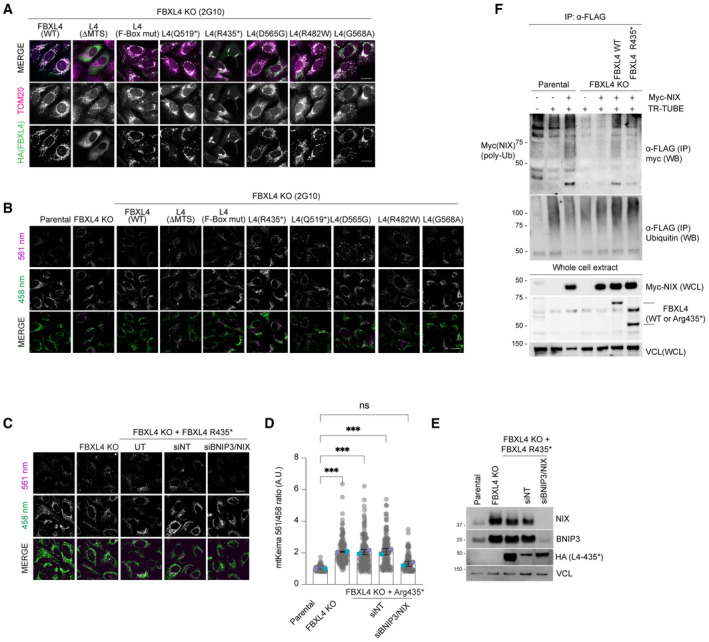
Localisation of FBXL4 variants. FBXL4 KO cells expressing FBXL4‐HA wild‐type or specified variants were fixed and stained for HA (to detect FBXL4 in green) or TOM20 (in magenta).
FBXL4 patient‐derived variants exhibit reduced efficiency in mediating the suppression of mitophagy compared to wild‐type FBXL4. U2OS mt‐Keima cells, U2OS mt‐Keima FBXL4 KO cells and U2OS mt‐Keima FBXL4 KO cells rescued with FBXL4 constructs were analysed by confocal microscopy. The emission signals obtained after excitation with the 458 nm laser (neutral pH) or 561 nm laser (acidic pH) are shown in green and magenta respectively. Quantification of these conditions is shown in Fig 4C.
Elevated mitophagy in FBXL4 KO cells expressing FBXL4Arg435* truncation variant is reduced when NIX/BNIP3 are depleted using siRNA. FBXL4 KO cells stably expressing FBXL4Arg435* were transfected with siRNAs targeting both NIX and BNIP3 (NIX/BNIP3 si) or non‐targeting siRNA (NT si). Live‐cell confocal microscopy was performed to visualise mitophagy.
Quantification of mitophagy shown in panel (C). Translucent grey dots represent measurements from individual cells. Coloured circles represent the mean ratio from independent experiments (N = 2). The centre lines and bars represent the mean of the independent replicates ± SD. At least 50 cells were analysed per condition, and over 100 cells were analysed in total per condition. P values were calculated based on the mean values using a one‐way ANOVA (*P < 0.05, **P < 0.005, ***P < 0.001, ****P < 0.0001).
Evaluation of the extent of NIX/BNIP3 depletion in (C, D) using Western blotting.
FBXL4Arg435* truncation variant is less efficient than wild‐type FBXL4 at promoting NIX ubiquitylation. Parental, FBXL4 KO cells, FBXL4 KO cells expressing either wild‐type FBXL4 or FBXL4‐Arg435* were transfected with TR‐TUBE and myc‐NIX, as indicated. Cell lysates obtained 48 h post‐transfection were immunoprecipitated with anti‐FLAG antibody, and the immunoprecipitates were analysed by immunoblotting using anti‐myc antibody (to detect ubiquitylated NIX or BNIP3). The line on the left marks a ladder of bands corresponding to polyubiquitylated myc‐BNIP3 or myc‐NIX.
Comment in
-
Eating your mitochondria-when too much of a good thing turns bad.EMBO J. 2023 Jul 3;42(13):e114542. doi: 10.15252/embj.2023114542. Epub 2023 Jun 5. EMBO J. 2023. PMID: 37272260 Free PMC article.
References
Publication types
MeSH terms
Substances
Grants and funding
LinkOut - more resources
Full Text Sources
Molecular Biology Databases
Research Materials
