. 2023 Jun 7;15(6):e16505.
doi: 10.15252/emmm.202216505. Epub 2023 May 10.

Comparison of tumor-informed and tumor-naïve sequencing assays for ctDNA detection in breast cancer

Affiliations

Comparison of tumor-informed and tumor-naïve sequencing assays for ctDNA detection in breast cancer

Angela Santonja et al. EMBO Mol Med. .

Abstract

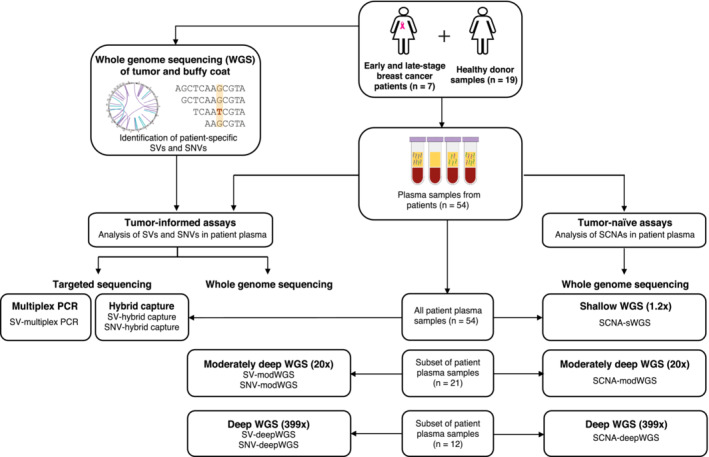
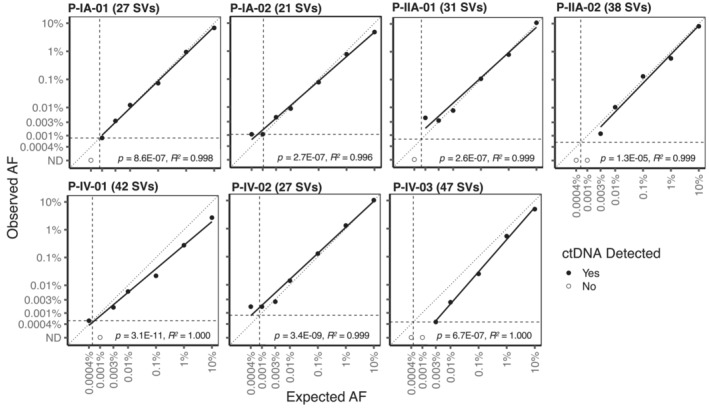
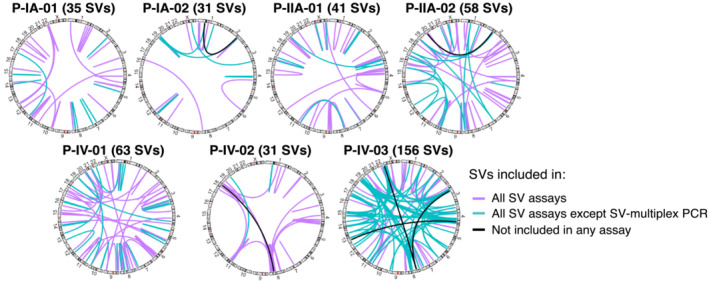
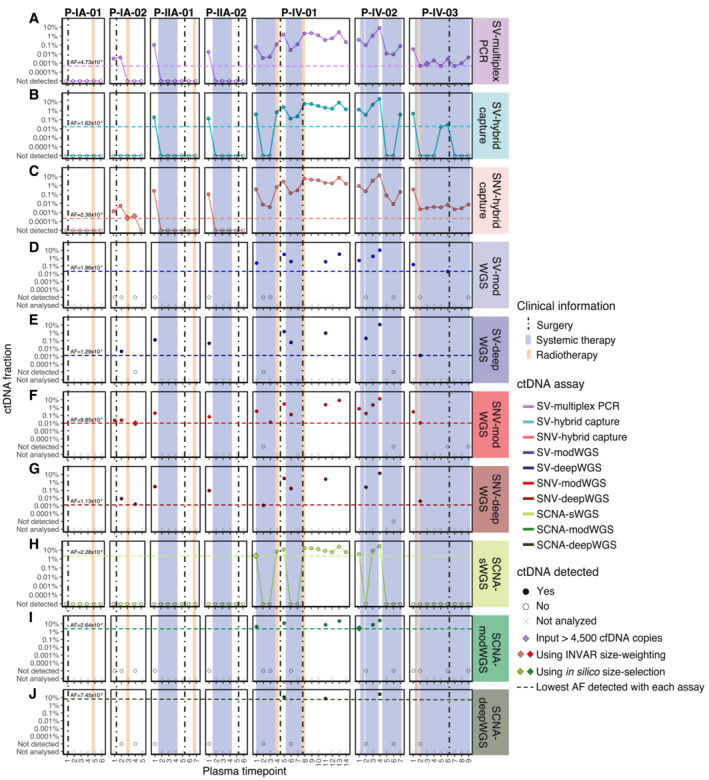
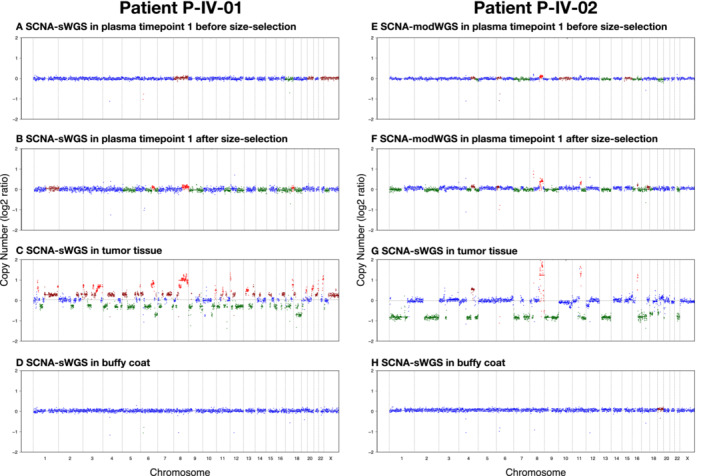
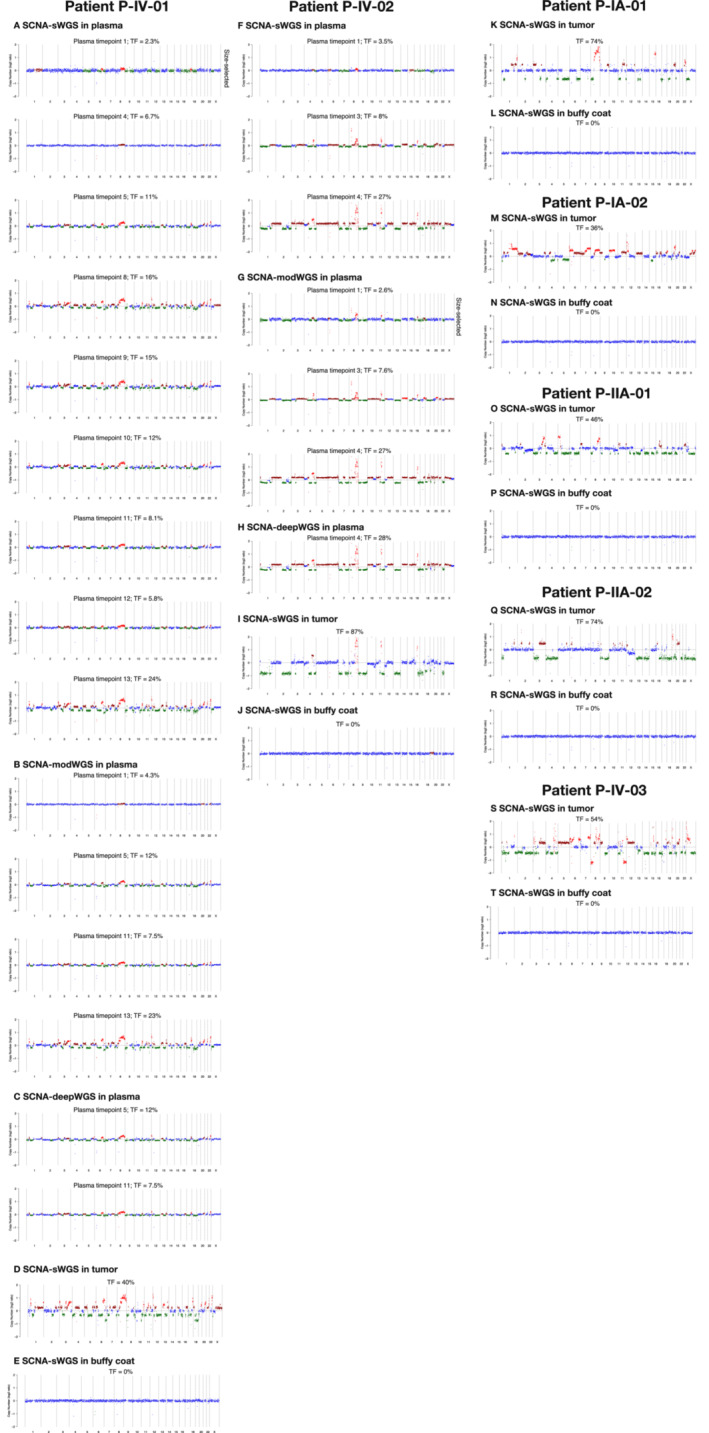
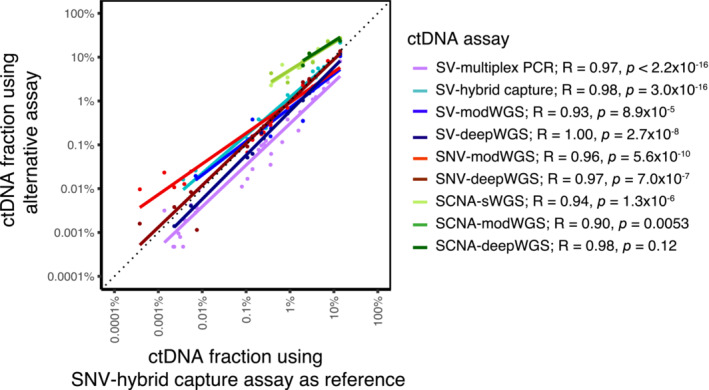
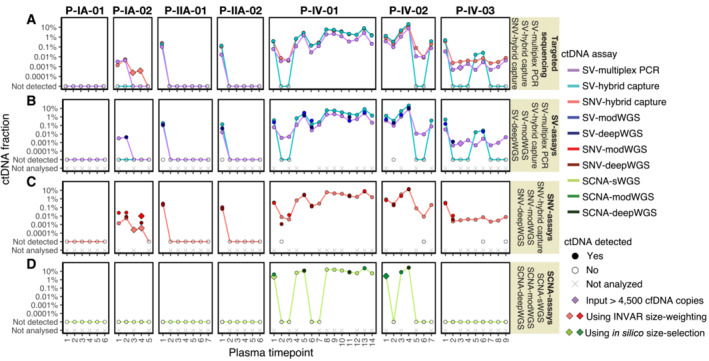
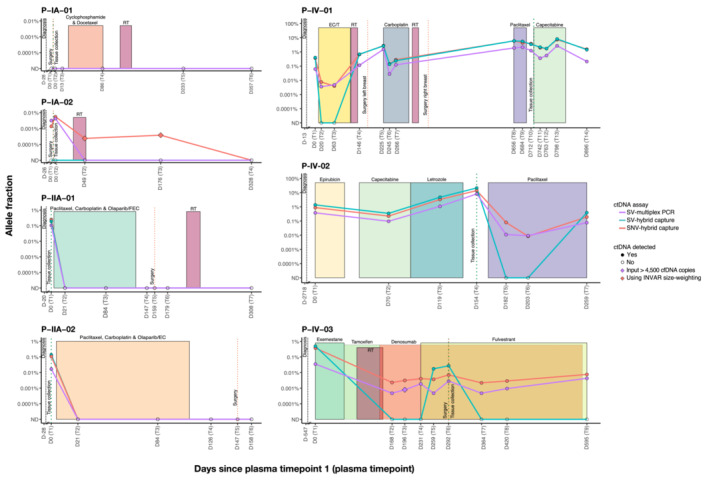
Analysis of circulating tumor DNA (ctDNA) to monitor cancer dynamics and detect minimal residual disease has been an area of increasing interest. Multiple methods have been proposed but few studies have compared the performance of different approaches. Here, we compare detection of ctDNA in serial plasma samples from patients with breast cancer using different tumor-informed and tumor-naïve assays designed to detect structural variants (SVs), single nucleotide variants (SNVs), and/or somatic copy-number aberrations, by multiplex PCR, hybrid capture, and different depths of whole-genome sequencing. Our results demonstrate that the ctDNA dynamics and allele fractions (AFs) were highly concordant when analyzing the same patient samples using different assays. Tumor-informed assays showed the highest sensitivity for detection of ctDNA at low concentrations. Hybrid capture sequencing targeting between 1,347 and 7,491 tumor-identified mutations at high depth was the most sensitive assay, detecting ctDNA down to an AF of 0.00024% (2.4 parts per million, ppm). Multiplex PCR targeting 21-47 tumor-identified SVs per patient detected ctDNA down to 0.00047% AF (4.7 ppm) and has potential as a clinical assay.

Keywords: circulating tumor DNA; hybrid capture; liquid biopsy; multiplex PCR; whole-genome sequencing.


Conflict of interest statement

NR and DG are co‐founders of Inivata. CGS is a current employee of Inivata. DG, JAM, and KH are current employees of AstraZeneca. Inivata and AstraZeneca had no role in the conceptualization or design of the clinical study, statistical analysis, or decision to publish the manuscript. All other authors declare that they have no competing interests.

Figures

Figure 1
Figure 1. Overview of the study design
Longitudinal plasma samples (n = 54) from seven breast cancer patients, with either early‐stage (n = 4) or late‐stage (n = 3) disease, were analyzed using different ctDNA assays. As controls, plasma samples (n = 19) from healthy donors were analyzed. Whole‐genome sequencing (WGS) of tumor and matched buffy coat DNA was first performed to identify patient‐specific structural variants (SVs) and single nucleotide variants (SNVs). These were used to define tumor‐informed ctDNA assays including targeted sequencing and whole‐genome sequencing (WGS) to different depths of sequencing. Targeted sequencing to evaluate SVs and SNVs (SV‐multiplex PCR, SV‐hybrid capture, and SNV‐hybrid capture) was performed in all 54 patient plasma samples. WGS at various depths was performed in a subset of 21 samples that were then downsampled to 600 M reads (modWGS, mean coverage depth 20×) prior to further analyses; these included 12 samples with deep sequencing (deepWGS, mean coverage depth 399×) analyzed before and after downsampling. As a tumor‐informed approach, SVs and SNVs were analyzed in the modWGS (SV‐modWGS and SNV‐modWGS) and the deepWGS assays (SV‐deepWGS and SNV‐deepWGS). Somatic copy‐number aberrations (SCNAs) were evaluated using WGS as a tumor‐naïve approach (not requiring prior knowledge of the tumor) by shallow WGS (SCNA‐sWGS, mean coverage depth 1.2×, 54 samples), modWGS (SCNA‐modWGS, 21 samples), and deepWGS (SCNA‐deepWGS, 12 samples).
Figure 2
Figure 2. Relationship between observed and expected allele fractions (AFs) in tumor dilution series with SV‐multiplex PCR
Numbers in brackets indicate the number of SVs (structural variants) targeted by SV‐multiplex PCR in each patient. Tumor dilutions ranged from 0.0004% to 10% AF. The vertical and horizontal dashed lines represent the theoretical limit of detection of each assay based on the number of analyzed SVs and input cell‐free DNA copies. The diagonal dotted line represents the unit line. The solid black line shows the linear regression fit. The P‐values of the slope parameter Wald t‐tests as well as the linear model‐fit R‐squared estimates are also indicated.
Figure EV1
Figure EV1. Circos plots showing patient‐specific SVs (structural variants) from all breast cancer patients
Plots show the number and location of all patient‐specific SVs identified by tumor WGS (number in brackets), which were subsequently targeted by the different ctDNA assays (see Table EV3). The breakpoints of all SVs depicted (except those indicated in black) were confirmed by multiplex PCR or hybrid capture. Purple lines indicate SVs included in all SV assays (SV‐multiplex PCR, SV‐hybrid capture, SV‐modWGS, and SV‐deep‐WGS). Turquoise lines indicate SVs analyzed only by SV‐hybrid capture, SV‐modWGS, and SV‐deepWGS but not by SV‐multiplex PCR. Black lines indicate six SVs identified by WGS of the tumor tissue that was not detected in plasma using any assay (due to no reads observed or homology with repetitive regions) and therefore was removed from further analysis.
Figure 3
Figure 3. ctDNA detection and fractions using the different ctDNA assays
ctDNA fractions are plotted as an allele fraction for SV/SNV assays and as tumor fraction for SCNA assays. (A–C) Targeted assays and (H) shallow WGS (sWGS, mean depth 1.2×) were performed in all plasma samples (n = 54), (D, F, I) moderately deep WGS (modWGS, mean depth 20×) in a subset of 21 plasma samples, and (E, G, J) deep WGS (deepWGS, mean depth 399×) in a subset of 12 samples (included also in modWGS). Plots (A–J) show the ctDNA fraction from each individual assay. (A) SV‐multiplex PCR assay: all detected plasma samples were assayed using up to 4,500 cell‐free DNA amplifiable copies except patient P‐IV‐03 plasma timepoint 3, which was detected after increasing the input amount to 27,000 cell‐free DNA copies; (B) SV‐hybrid capture assay; (C) SNV‐hybrid capture assay: patient P‐IA‐02 plasma timepoint 3 and timepoint 4 were detected only after applying INVAR size‐weighting feature; (D) SV‐modWGS assay; (E) SV‐deepWGS; (F) SNV‐modWGS: patient P‐IA‐02 plasma timepoint 4 was detected only after applying INVAR size‐weighting feature; (G) SNV‐deepWGS; (H) SCNA‐sWGS assay: patient P‐IV‐01 plasma timepoint 1 was detected only after in silico 90–150 bp size selection; (I) SCNA‐modWGS assay: patient P‐IV‐02 plasma timepoint 1 was detected only after in silico 90‐150 bp size selection; and (J) SCNA‐deepWGS.
Figure 4
Figure 4. SCNA signal enrichment after in silico 90–150 bp size selection in patients P‐IV‐01 and P‐IV‐02
(A–D) Patient P‐IV‐01: When analyzed with SCNA‐sWGS, (A) P‐IV‐01 plasma timepoint 1 shows a flat profile before in silico size selection and a tumor fraction of 2.3%, that is below the ichorCNA recommended cut‐off of 3%, while (B) after 90–150 bp size selection, copy‐number changes can be observed. These copy numbers match those observed (C) in tumor and are not present in (D) matched buffy coat. (E–H) P‐IV‐02: (E) When analyzed with SCNA‐modWGS, P‐IV‐02 plasma timepoint 1 has a tumor fraction below the ichorCNA recommended cut‐off of 3% (tumor fraction of 2.6%) and is, therefore, classified as undetected even though small copy‐number changes can be observed. (F) Following in silico size selection, those changes become more apparent. The copy‐number aberrations match those observed (G) in tumor and are not present in (H) matched buffy coat.
Figure EV2
Figure EV2. SCNA plots and tumor fraction (TF) observed with the SCNA assays in plasma
All plasma samples with ctDNA detected either before or after size selection with SCNA‐sWGS, modWGS, and deepWGS are plotted as well as tumor and buffy coat from the seven patients. Plots and tumor fraction (TF) plotted before size selection for all samples except those marked as “size‐selected”; in those samples, the plot corresponds to the SCNAs observed after size selection, while the tumor fraction is that generated before size selection. Tumor fraction estimated from ichorCNA. (A–E) SCNA plots from P‐IV‐01, (A) plasma samples detected with SCNA‐sWGS, (B) plasma samples detected with SCNA‐modWGS, (C) plasma samples detected with SCNA‐deepWGS, (D) sWGS of tumor tissue, and (E) sWGS of buffy coat. (F–J) SCNA plots from P‐IV‐02, (F) plasma samples detected with sWGS, (G) plasma samples detected with SCNA‐modWGS, (H) plasma samples detected with SCNA‐deepWGS, (I) sWGS of tumor tissue, and (J) sWGS of buffy coat. For both patients, all plasma samples detected have similar alterations between different plasma samples from the same patient tested with the different SCNA assays as well as with the tumor tissue. (K–T) sWGS of tumor and buffy coat from the remaining five patients with no plasma sample detected by the analysis of SCNAs.
Figure 5
Figure 5. Correlation of the ctDNA fractions calculated with all assays performed
Allele fractions plotted for SV/SNV assays, and tumor fractions for SCNA assays. The SNV‐hybrid capture assay was used as reference (x axis), with the other assays plotted on a common y axis. Colored lines correspond to the linear regression fits per assay. The Pearson's correlation coefficient estimates and P‐values of the corresponding tests of associations are also indicated. Spearman rank correlations led to the same conclusions (range R = 0.98 to R = 1.00).
Figure EV3
Figure EV3. ctDNA detection and fractions using the different ctDNA assays
ctDNA fractions are plotted as an allele fraction for SV/SNV assays and as tumor fraction for SCNA assays. Plots (A–D) show comparisons of the detection and ctDNA fraction obtained with different assays. (A) Comparison of targeted sequencing assays (SV‐multiplex PCR, SV‐hybrid capture, and SNV‐hybrid capture); (B) Comparison of all assays targeting SVs (SV‐multiplex PCR, SV‐hybrid capture, SV‐modWGS, and SV‐deepWGS); (C) Comparison of all assays targeting SNVs (SNV‐hybrid capture, SNV‐modWGS, and SNV‐deepWGS); and (D) Comparison of all assays evaluating SCNAs (SCNA‐sWGS, SCNA‐modWGS, and SCNA‐deepWGS). The individual plots and number of samples assayed are shown in Fig 3.
Figure EV4
Figure EV4. Clinical information and detection of ctDNA in each patient using targeted ctDNA assays
The shaded boxes represent different treatment periods and the vertical dotted lines mark the time of diagnosis (black), the time of surgery where appropriate (dark orange), and the time of tissue collection for whole‐genome sequencing (dark green). Days indicated on the x axis refer to the number of days before or after the collection of the first plasma sample. Two samples were taken at day 0 (D0) in stage IA patients (P‐IA‐01 and P‐IA‐02), before (T1) and after surgery (T2). Individual plots showing the allele fraction from every ctDNA assay can be found in Fig 3. RT: radiotherapy; FEC: 5 fluorouracil (5FU), epirubicin, and cyclophosphamide; EC: epirubicin and cyclophosphamide; /T followed by docetaxel; ND: Not detected.

References

    1. Abbosh C, Birkbak NJ, Wilson GA, Jamal‐Hanjani M, Constantin T, Salari R, le Quesne J, Moore DA, Veeriah S, Rosenthal R et al (2017) Phylogenetic ctDNA analysis depicts early‐stage lung cancer evolution. Nature 545: 446–451 - PMC - PubMed
    1. Adalsteinsson VA, Ha G, Freeman SS, Choudhury AD, Stover DG, Parsons HA, Gydush G, Reed SC, Rotem D, Rhoades J et al (2017) Scalable whole‐exome sequencing of cell‐free DNA reveals high concordance with metastatic tumors. Nat Commun 8: 1324 - PMC - PubMed
    1. Almogy G, Pratt M, Oberstrass F, Lee L, Mazur D, Beckett N, Barad O, Soifer I, Perelman E, Etzioni Y et al (2022) Cost‐efficient whole genome‐sequencing using novel mostly natural sequencing‐by‐synthesis chemistry and open fluidics platform. bioRxiv 10.1101/2022.05.29.493900 [PREPRINT] - DOI
    1. Bettegowda C, Sausen M, Leary RJ, Kinde I, Wang Y, Agrawal N, Bartlett BR, Wang H, Luber B, Alani RM et al (2014) Detection of circulating tumor DNA in early‐ and late‐stage human malignancies. Sci Transl Med 6: 224ra24 - PMC - PubMed
    1. Broad Institute (2019) Picard Toolkit. http://broadinstitute.github.io/picard/

Publication types